


 本文介绍了一种基于MATLAB的图像处理方法,该方法首先读取并灰度化图像,接着进行旋转处理,并利用Canny算法检测图像边缘,再通过霍夫变换检测图像中的直线。最终,文章展示了如何提取并标记出图像中的最长直线。
clc;
clear all;
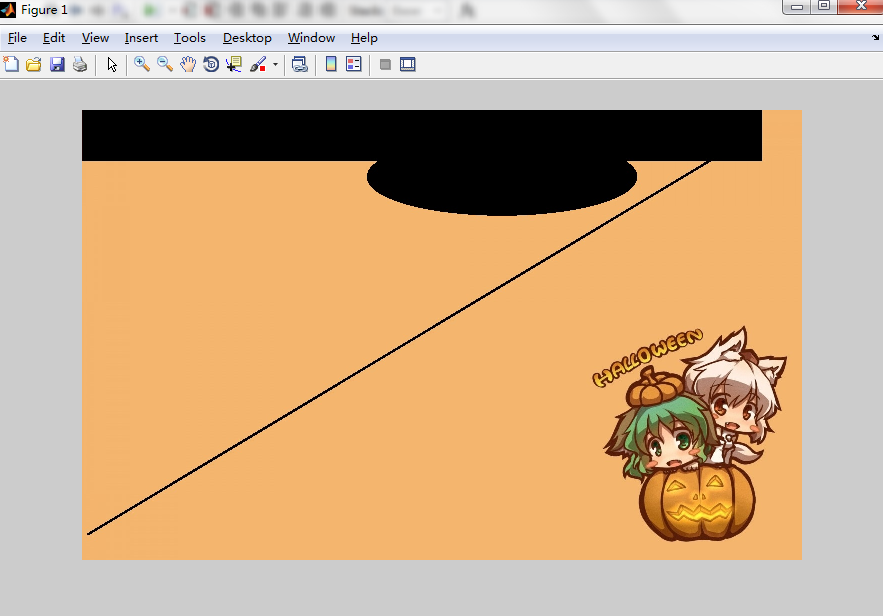
I=imread('test.jpg');
figure;
imshow(I);
I=rgb2gray(I);
rot1=imrotate(I,33,'crop'); %旋转图像
bw=edge(rot1,'canny'); %使用边缘检测形成二值图像
[H,T,R]=hough(bw); %生成点的叠加矩阵和坐标T,R
figure;
imshow(H,[],'XData',T,'YData',R,'InitialMagnification','fit'); %显示统计点的图形
title('变换结果');
xlabel('\theta'),ylabel('\rho');
axis on,axis normal;hold on; %使坐标易于观察
p=houghpeaks(H,5,'threshold',ceil(0.3*max(H(:)))); %提取5个极值点,p中为极坐标的位置
x=T(p(:,2));y=R(p(:,1));
plot(x,y,'s','color','blue');
lines=houghlines(bw,T,R,p,'FillGap',5,'MinLength',7); %生成这五个点在图像中的直线矩阵
figure;
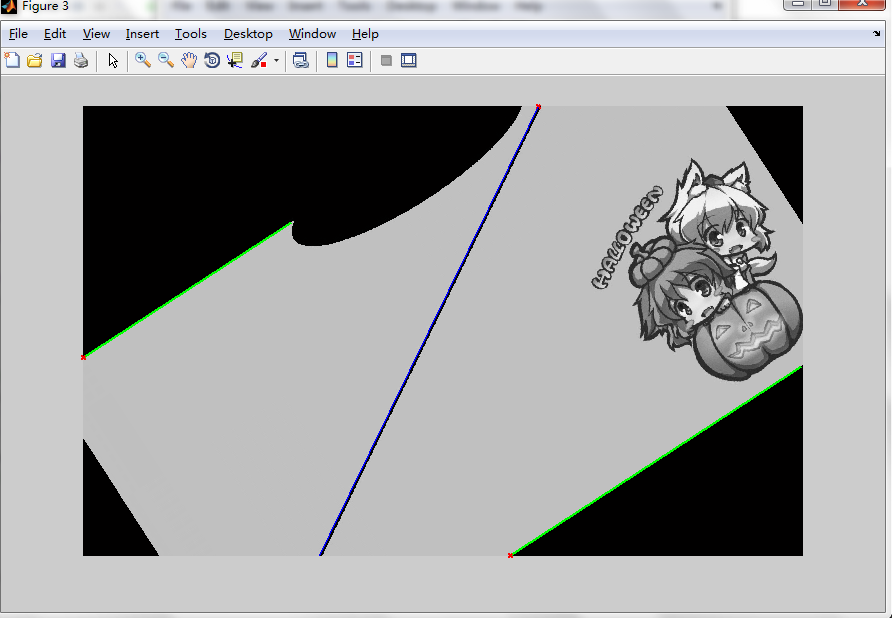
imshow(rot1);,hold on;
max_len=0;
for k=1:length(lines) %计算线的数量
xy=[lines(k).point1;lines(k).point2]; %
plot(xy(:,1),xy(:,2),'LineWidth',2,'Color','green'); %通过直线的起点和终点画出直线
plot(xy(1,1),xy(1,2),'x','LineWidth',2,'Color','red'); %标出起点和终点
len=norm(lines(k).point1-lines(k).point2);
if(len>max_len) %算出最大的直线
max_len=len;
xy_long=xy;
end
end
clear all;
I=imread('test.jpg');
figure;
imshow(I);
I=rgb2gray(I);
rot1=imrotate(I,33,'crop'); %旋转图像
bw=edge(rot1,'canny'); %使用边缘检测形成二值图像
[H,T,R]=hough(bw); %生成点的叠加矩阵和坐标T,R
figure;
imshow(H,[],'XData',T,'YData',R,'InitialMagnification','fit'); %显示统计点的图形
title('变换结果');
xlabel('\theta'),ylabel('\rho');
axis on,axis normal;hold on; %使坐标易于观察
p=houghpeaks(H,5,'threshold',ceil(0.3*max(H(:)))); %提取5个极值点,p中为极坐标的位置
x=T(p(:,2));y=R(p(:,1));
plot(x,y,'s','color','blue');
lines=houghlines(bw,T,R,p,'FillGap',5,'MinLength',7); %生成这五个点在图像中的直线矩阵
figure;
imshow(rot1);,hold on;
max_len=0;
for k=1:length(lines) %计算线的数量
xy=[lines(k).point1;lines(k).point2]; %
plot(xy(:,1),xy(:,2),'LineWidth',2,'Color','green'); %通过直线的起点和终点画出直线
plot(xy(1,1),xy(1,2),'x','LineWidth',2,'Color','red'); %标出起点和终点
len=norm(lines(k).point1-lines(k).point2);
if(len>max_len) %算出最大的直线
max_len=len;
xy_long=xy;
end
end
plot(xy_long(:,1),xy_long(:,2),'LineWidth',2,'Color','Cyan'); %标记出最大的直线


 465
465

 被折叠的 条评论
为什么被折叠?
被折叠的 条评论
为什么被折叠?
 到【灌水乐园】发言


