


 本文详细介绍了Streamlit库中用于创建数据可视化应用的各种组件和图表显示方法,包括header、subheader、text、markdown、code、write、dataframe、json、pyplot、altair、vega_lite_chart、plotly、bokeh、graphviz、line_chart、area_chart、bar_chart、map、image、audio、video、button、checkbox、radio、selectbox、multiselect、slider、text_input、number_input、text_area、date_input、time_input、echo、progress、spinner、balloons、error、warning、info、success、empty、help、cache、add_rows、docs等。每个组件和图表的使用方法、参数及示例代码都有详尽的解释,是掌握Streamlit数据可视化的重要参考资料。
文章目录
- st.header - 显示主标题
- st.subheader - 显示副标题
- st.text - 显示文本
- st.markdown - 显示markdown文本
- st.code - 显示代码块
- st.write - 通用显示方法
- st.dataframe - 显示可交互数据帧
- st.json - 显示JSON对象
- st.pyplot - 显示pyplot图表
- st.altair - 显示altair图表
- st.vega_lite_chart - 显示Vega-Lite图表
- st.plotly - 显示Plotly图表
- st.bokeh - 显示bokeh图表
- st.graphviz_chart - 显示Graphviz图表
- st.line_chart - 显示折线图
- st.area_chart - 显示区域图
- st.bar_chart - 显示柱状图
- st.map - 显示地图
- st.image - 显示图像
- st.audio - 显示音频播放器
- st.video - 显示视频播放器
- st.button - 显示按钮
- st.checkbox - 显示复选框
- st.radio - 显示单选框
- st.selectbox - 显示列表选择框
- st.multiselect - 显示列表多选框
- st.slider - 显示滑动拉杆
- st.text_input - 显示文本输入框
- st.number_input - 显示数值输入框
- st.text_area - 显示多行文本框
- st.date_input - 显示日期输入框
- st.time_input - 显示时间输入框
- st.echo - 显示应用源代码
- st.progress - 显示进度
- st.spinner - 显示执行状态
- st.balloons - 显示庆祝气球
- st.error - 显示错误信息
- st.warning - 显示警告信息
- st.info - 显示提示信息
- st.success - 显示成功信息
- st.exception - 显示异常信息
- st.empty - 添加占位符
- st.help - 显示帮助信息
- st.cache - 函数缓存装饰器
- dg.add_rows - 追加数据行
- streamlit help - 查看帮助信息
- 原文链接
st.header - 显示主标题
使用streamlit的header方法显示主标题。
方法原型
streamlit.header(body)
参数:
body:要显示的标题文本,字符串
示例代码
>>> st.header('This is a header')
st.subheader - 显示副标题
使用streamlit的subheader方法显示副标题。
方法原型
streamlit.subheader(body)
参数:
body:要显示的标题文本,字符串
示例代码
>>> st.subheader('This is a subheader')
st.text - 显示文本
使用streamlit的text方法显示定宽文本。
方法原型
streamlit.text(body)
参数:
body:要显示的文本,字符串
示例代码
>>> st.text('This is a header')
st.markdown - 显示markdown文本
使用streamlit的markdown方法解析并显示markdown文本。
方法原型
streamlit.markdown(body, unsafe_allow_html=False)
调用参数:
body:要显示的markdown文本,字符串。采用github增强语法,参考 https://github.github.com/gfm
unsafe_allow_html: 是否允许出现html标签,布尔值,默认:false,表示所有的html标签都将转义。 注意,这是一个临时特性,在将来可能取消。
示例代码
>>> st.markdown('Streamlit is **_really_ cool**.')
st.code - 显示代码块
使用streamlit的code方法显示代码块,支持语法高亮。
方法原型
streamlit.code(body, language=‘python’)
调用参数:
body:要显示的代码,字符串
language:代码所使用的开发语言,字符串,默认值:python。 如果省略的话,将没有语法高亮效果
示例代码
>>> code = '''def hello():
...     print("Hello, Streamlit!")'''
>>> st.code(code, language='python')
st.write - 通用显示方法
streamlit的write方法属于瑞士军刀性质,根据你传入的参数不同 而有不同的显示效果。
与其他streamlit方法不同,write方法有一些独特的性质:
你可以传入多个要显示的参数,显示效果依赖于传入的参数
返回值为None,因此在应用中它会占用一个不可复用的槽位
方法原型
streamlit.write(*args, **kwargs)
参数:
*args:一个或多个要显示的对象参数,支持如下类型的调用:
write(string) :显示输出格式化处理后的markdown内容
write(data_frame) : 表格形式显示Pandas的DataFrame对象
write(error):显示输出异常信息
write(func):显示指定函数的信息
write(module):显示指定模块的信息
write(dict) :使用一个交互组件显示字典对象的内容
write(obj):默认行为是显示输出str(obj)的结果
write(mpl_fig):显示指定的Matplotlib图表
write(altair):显示指定的Altair图表
write(keras):显示指定的Keras模型
write(graphviz):显示指定的Graphviz图表
write(plotly_fig):显示指定的Plotly图表
write(bokeh_fig) :显示指定的Bokeh图表
unsafe_allow_html :是否允许不安全的HTML标签,布尔类型,默认值:false
示例代码
下面的代码显示解析后的Markdown文本,虽然传入的是字符串:
>>> write('Hello, *World!*')
效果如下:

write方法也支持其他数据格式,例如数值、Pandas数据帧、排序对象等:
>>> st.write(1234)
>>> st.write(pd.DataFrame({
...     'first column': [1, 2, 3, 4],
...     'second column': [10, 20, 30, 40],
... }))
效果如下:

你也可以传入多个参数,例如:
>>> st.write('1 + 1 = ', 2)
>>> st.write('Below is a DataFrame:', data_frame, 'Above is a dataframe.')
效果如下:

write命令也可以传入图表对象!例如:
>>> import pandas as pd
>>> import numpy as np
>>> import altair as alt
>>>
>>> df = pd.DataFrame(
...     np.random.randn(200, 3),
...     columns=['a', 'b', 'c'])
...
>>> c = alt.Chart(df).mark_circle().encode(
...     x='a', y='b', size='c', color='c')
>>>
>>> st.write(c)
效果如下:

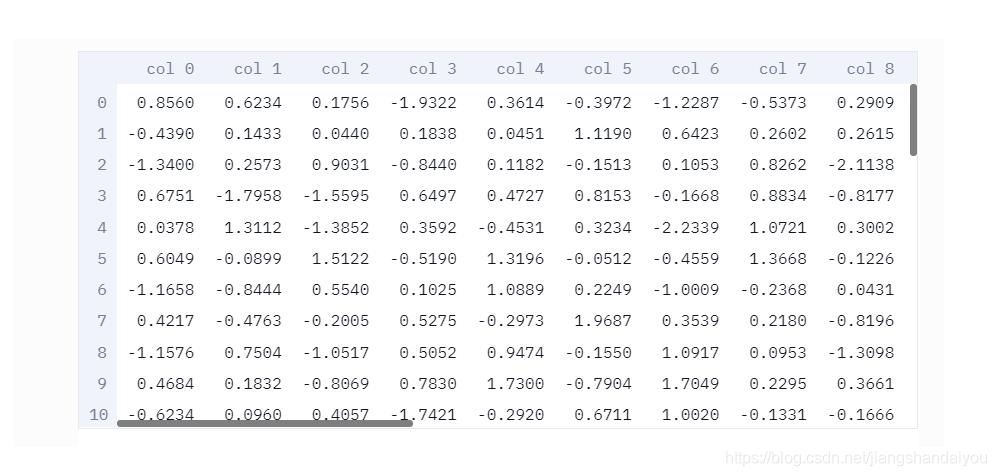
st.dataframe - 显示可交互数据帧
使用streamlit的dataframe方法显示Pandas数据帧,支持交互。
方法原型
streamlit.dataframe(data=None, width=None, height=None)
参数:
data:要显示的数据对象,类型可以是pandas.DataFrame、pandas.Styler、numpy.ndarray、Iterable、dict或None。 如果是pandas.Styler对象,那么将被应用到DataFrame对象上。Streamlit支持自定义单元值和颜色,不过不支持 pandas的某些样式特性,例如条形图、鼠标悬停效果和说明文字。Styler的支持目前还是实验性质的。
width:UI元素的期望宽度,单位:像素,类型为Int或None,如果是None的话,Streamlit将基于页面宽度计算元素宽度
height:UI元素的期望高度,单位:像素,类型为Int或None
调用代码
>>> df = pd.DataFrame(
...    np.random.randn(50, 20),
...    columns=('col %d' % i for i in range(20)))
...
>>> st.dataframe(df)  # Same as st.write(df)
 ```python >>> st.dataframe(df, 200, 100) 也可以传入一个Pandas Styler对象来修改所渲染的DataFrame的样式:
df = pd.DataFrame(
… np.random.randn(10, 20),
… columns=(‘col %d’ % i for i in range(20)))
…st.dataframe(df.style.highlight_max(axis=0))
效果如下:

<img src="https://img-blog.csdnimg.cn/39c1cba1e6ae4ea29074ebf9501ea23a.png?x-oss-process=image/watermark,type_ZmFuZ3poZW5naGVpdGk,shadow_10,text_aHR0cHM6Ly9ibG9nLmNzZG4ubmV0L2ppYW5nc2hhbmRhaXlvdQ==,size_16,color_FFFFFF,t_70" width="70%">
# st.table - 显示静态数据表
使用streamlit的table方法显示静态数据表。与dataframe方法的区别 在于,这个方法显示的表格是静态不可交互的。

方法原型
streamlit.table(data=None)

参数:
data:要显示的数据对象,类型可以是:
- pandas.DataFrame
- pandas.Styler
- numpy.ndarray
- Iterable
- dict
- None

示例代码
```python
>>> df = pd.DataFrame(
...    np.random.randn(10, 5),
...    columns=('col %d' % i for i in range(5)))
...
>>> st.table(df)
效果如下:

st.json - 显示JSON对象
streamlit的json方法可以显示缩进格式的JSON对象内容。
方法原型
streamlit.json(body)
参数:
body:要显示的JSON对象或JSON字符串,如果是JSON字符串的话, 则假设其包含序列化的JSON对象
示例代码
>>> st.json({
...     'foo': 'bar',
...     'baz': 'boz',
...     'stuff': [
...         'stuff 1',
...         'stuff 2',
...         'stuff 3',
...         'stuff 5',
...     ],
... })
效果如下:

st.pyplot - 显示pyplot图表
streamlit的pyplot方法显示指定的matplotlib.pyplot图表。
方法原型
streamlit.pyplot(fig=None, **kwargs)
参数:
fig:要使用的绘制面板,当为None时,使用整个绘图区域
**kwargs :传入Matplotlib的savefig函数的关键字参数
示例代码
>>> import matplotlib.pyplot as plt
>>> import numpy as np
>>>
>>> arr = np.random.normal(1, 1, size=100)
>>> plt.hist(arr, bins=20)
>>>
>>> st.pyplot()
效果如下:

st.altair - 显示altair图表
streamlit的altair方法使用Altair库显示指定的图表。
方法原型
streamlit.altair_chart(altair_chart, width=0)
参数:
altair_chart:要显示的Altair图表对象,类型:altair.vegalite.v2.api.Chart
width:宽度模式,0 表示拉伸图表到文档宽度,-1表示使用Altair的默认值,大于0表示 设置的宽度像素。默认值:0。注意如果顶层宽度已定义,那么将覆盖这里的设定。
示例代码
>>> import pandas as pd
>>> import numpy as np
>>> import altair as alt
>>>
>>> df = pd.DataFrame(
...     np.random.randn(200, 3),
...     columns=['a', 'b', 'c'])
...
>>> c = alt.Chart(df).mark_circle().encode(
...     x='a', y='b', size='c', color='c')
>>>
>>> st.altair_chart(c, width=-1)
效果如下:

st.vega_lite_chart - 显示Vega-Lite图表
streamlit的vega_lite_chart方法使用Vega-Lite库显示指定的图表。
方法原型
streamlit.vega_lite_chart(data=None, spec=None, width=0, **kwargs)
参数:
data:要显示的数据对象或Vega-Lite图表规格,数据类型可以是:
- pandas.DataFrame
- pandas.Styler
- numpy.ndarray
- Iterable
- dict
- None
spec:Vega-Lite的图表规格,如果在前面data参数已经传入图表规格,这里 必须传入None
width:宽度模式。0表示使用整个文档宽度,-1表示使用Veta-Lite的默认值。 大于0表示要设置的宽度像素。注意如果定义了spec[‘width’],那么这里的 设置无效
**kwargs:与spec参数相同,只是采用关键词参数
示例代码
>>> import pandas as pd
>>> import numpy as np
>>>
>>> df = pd.DataFrame(
...     np.random.randn(200, 3),
...     columns=['a', 'b', 'c'])
>>>
>>> st.vega_lite_chart(df, {
...     'mark': 'circle',
...     'encoding': {
...         'x': {'field': 'a', 'type': 'quantitative'},
...         'y': {'field': 'b', 'type': 'quantitative'},
...         'size': {'field': 'c', 'type': 'quantitative'},
...         'color': {'field': 'c', 'type': 'quantitative'},
...     },
... })
st.plotly - 显示Plotly图表
streamlit的plotly方法显示可交互的Plotly图表。要在Streamlit 中显示Plotly图表,只需要用plotly_chart调用替代原本 的Plotly的py.plot或py.iplot调用。
Plotly是一个Python的图表库。该方法的参数基本遵循Plotly的plot() 函数的定义。你可以在这里查看详细信息:https://plot.ly/python。
方法原型
streamlit.plotly_chart(figure_or_data, width=0, height=0, sharing=‘streamlit’, **kwargs)
参数:
figure_or_data :plotly图表数据或matplotlib绘图面板。如果是 matplotlib绘图面板,会将其转化为Plotly绘图面板然后再显示
width:图表宽度,单位为像素,或者设置为0,表示使用全部宽度
height:图表高度,单位为像素,或者设置为0,表示使用默认高度
sharing:共享模式,可选值:streamlit、private、secret、public。设置为 streamlit将图表以及依赖插入Streamlit应用,这意味着可以离线 运行。使用其他设置会发送到Plotly的服务器,然后嵌入Streamlit应用。
**kwargs:Plotly的plot()方法接受的其他参数
示例代码
下面的示例直接取自Plotly官网示例:
>>> import streamlit as st
>>> import plotly.figure_factory as ff
>>> import numpy as np
>>>
>>> # Add histogram data
>>> x1 = np.random.randn(200) - 2
>>> x2 = np.random.randn(200)
>>> x3 = np.random.randn(200) + 2
>>>
>>> # Group data together
>>> hist_data = [x1, x2, x3]
>>>
>>> group_labels = ['Group 1', 'Group 2', 'Group 3']
>>>
>>> # Create distplot with custom bin_size
>>> fig = ff.create_distplot(
...         hist_data, group_labels, bin_size=[.1, .25, .5])
>>>
>>> # Plot!
>>> st.plotly_chart(fig)
效果如下:

st.bokeh - 显示bokeh图表
streamlit的bokeh方法显示可交互的Bokeh图表。要在Streamlit 中显示Bokeh图表,只要在本该调用Bokeh的show方法时调用 st.bokeh_chart即可。
Bokeh是一个Python的图表库,bokeh方法的参数基本遵从Bokeh 的show方法的要求。详情可参考 https://bokeh.pydata.org 。
方法原型
streamlit.bokeh_chart(figure)
参数:
figure:要显示的Bokeh绘图面板
示例代码
>>> import streamlit as st
>>> from bokeh.plotting import figure
>>>
>>> x = [1, 2, 3, 4, 5]
>>> y = [6, 7, 2, 4, 5]
>>>
>>> p = figure(
...     title='simple line example',
...     x_axis_label='x',
...     y_axis_label='y')
...
>>> p.line(x, y, legend='Trend', line_width=2)
>>>
>>> st.bokeh_chart(p)
效果如下:

st.graphviz_chart - 显示Graphviz图表
streamlit的graphviz_chart使用dagre-d3库显示图表。
方法原型
streamlit.graphviz_chart(figure_or_dot, width=0, height=0)
参数:
figure_or_dot:要现实的Graphlib图对象或dot字符串
width:图表宽度像素数,0表示使用完整宽度
height:图表高度像素数,0表示使用默认高度
示例代码
>>> import streamlit as st
>>> import graphviz as graphviz
>>>
>>> # Create a graphlib graph object
>>> graph = graphviz.DiGraph()
>>> graph.edge('run', 'intr')
>>> graph.edge('intr', 'runbl')
>>> graph.edge('runbl', 'run')
>>> graph.edge('run', 'kernel')
>>> graph.edge('kernel', 'zombie')
>>> graph.edge('kernel', 'sleep')
>>> graph.edge('kernel', 'runmem')
>>> graph.edge('sleep', 'swap')
>>> graph.edge('swap', 'runswap')
>>> graph.edge('runswap', 'new')
>>> graph.edge('runswap', 'runmem')
>>> graph.edge('new', 'runmem')
>>> graph.edge('sleep', 'runmem')
>>>
>>> st.graphviz_chart(graph)
你也可以使用GraphViz的Dot语法绘制图表:
>>> st.graphviz_chart('''
    digraph {
        run -> intr
        intr -> runbl
        runbl -> run
        run -> kernel
        kernel -> zombie
        kernel -> sleep
        kernel -> runmem
        sleep -> swap
        swap -> runswap
        runswap -> new
        runswap -> runmem
        new -> runmem
        sleep -> runmem
    }
''')
效果如下:

st.line_chart - 显示折线图
streamlit的line_chart方法显示折线图。
方法原型
streamlit.line_chart(data=None, width=0, height=0)
参数:
data:要绘制的数据,可以是如下类型:
- pandas.DataFrame
- pandas.Styler
- numpy.ndarray
- Iterable
- dict – None
width:图表宽度像素数,0表示使用完整宽度
height:图表高度像素数,0表示使用默认高度
示例代码
>>> chart_data = pd.DataFrame(
...     np.random.randn(20, 3),
...     columns=['a', 'b', 'c'])
...
>>> st.line_chart(chart_data)
效果如下:

st.area_chart - 显示区域图
streamlit的area_chart方法显示区域图。
方法原型
streamlit.area_chart(data=None, width=0, height=0)
参数:
data:要绘制的数据, 可以是如下类型:
- pandas.DataFrame
- pandas.Styler
- numpy.ndarray
- Iterable
- dict – None
width:图表宽度像素数,0表示使用完整宽度
height:图表高度像素数,0表示使用默认高度
示例代码
>>> chart_data = pd.DataFrame(
...     np.random.randn(20, 3),
...     columns=['a', 'b', 'c'])
...
>>> st.area_chart(chart_data)
效果如下:

st.bar_chart - 显示柱状图
streamlit的bar_chart方法显示棒状图。
方法原型
streamlit.bar_chart(data=None, width=0, height=0)
参数:
data:要绘制的数据,可以是如下类型:
- pandas.DataFrame
- pandas.Styler
- numpy.ndarray
- Iterable
- dict
- None
width:图表宽度像素数,0表示完整宽度
height:图表高度像素数,0表示默认高度
示例代码
>>> chart_data = pd.DataFrame(
...     [[20, 30, 50]],
...     columns=['a', 'b', 'c'])
...
>>> st.bar_chart(chart_data)
效果如下:

st.map - 显示地图
streamlit的map方法显示地图及叠加的数据点。 该方法时对st.deck_gl_chart的封装,用于快速创建 基于地图的scatter图表,支持自动居中与自动缩放。
方法原型
streamlit.map(data, zoom=None)
参数:
data:要显示的数据,必须包含字段lat、lon、latitude或longitude,可以是如下类型:
- pandas.DataFrame
- pandas.Styler
- numpy.ndarray
- Iterable
- dict
- None
zoom:缩放等级,参见 https://wiki.openstreetmap.org/wiki/Zoom_levels
示例代码
>>> import pandas as pd
>>> import numpy as np
>>>
>>> df = pd.DataFrame(
...     np.random.randn(1000, 2) / [50, 50] + [37.76, -122.4],
...     columns=['lat', 'lon'])
>>>
>>> st.map(df)
效果如下:

st.image - 显示图像
streamlit的image方法可以显示一张或多张图像。
方法原型
streamlit.image(image, caption=None, width=None, use_column_width=False, clamp=False, channels=‘RGB’, format=‘JPEG’)
参数:
image:要显示的图像,类型可以是numpy.ndarray, [numpy.ndarray], BytesIO, str, 或 [str]) – 单色图像为(w,h) 或 (w,h,1)
彩色图像为(w,h,3)
RGBA图像为(w,h,4)
也可以指定一个图像url,或url列表
caption:图像标题,字符串。如果显示多幅图像,caption应当是字符串列表
width :图像宽度,None表示使用图像自身宽度
use_column_width:如果设置为True,则使用列宽作为图像宽度
clamp:是否将图像的像素值压缩到有效域(0~255) ,仅对字节数组图像有效。
channels:图像通道类型,‘RGB’ 或 ‘BGR’,默认值:RGB
format:图像格式:‘JPEG’ 或’PNG’),默认值:JPEG
示例代码
>>> from PIL import Image
>>> image = Image.open('sunrise.jpg')
>>>
>>> st.image(image, caption='Sunrise by the mountains',
...          use_column_width=True)
效果如下:

st.audio - 显示音频播放器
streamlit的audio方法显示一个音频播放器。
方法原型
streamlit.audio(data, format=‘audio/wav’, start_time=0)
参数:
data:要播放的原始音频数据,类型可以是:
- URL字符串,指向本地或远程文件
- 字节码流
- BytesIO
- numpy.ndarray
- 打开的文件
start_time:播放起始时间
format:音频文件的MIME类型。默认:audio/wav
示例代码
>>> audio_file = open('myaudio.ogg', 'rb')
>>> audio_bytes = audio_file.read()
>>>
>>> st.audio(audio_bytes, format='audio/ogg')
效果如下:

st.video - 显示视频播放器
方法原型
streamlit.video(data, format=‘video/mp4’, start_time=0)
参数:
data:要播放的视频,可以是如下类型:
- URL字符串,指向本地或远程视频文件
- 字节码流
- BytesIO
- numpy.ndarray
- 打开的文件
format:视频文件的MIME类型,默认值:video/mp4
start_time:视频开始播放的时间
示例代码
>>> video_file = open('myvideo.mp4', 'rb')
>>> video_bytes = video_file.read()
>>>
>>> st.video(video_bytes)
效果如下:

st.button - 显示按钮
streamlit的button方法显示一个按钮。
方法原型
streamlit.button(label, key=None)
参数:
label:按钮标题字符串
key:按钮组件的键,可选。如果未设置的话,streamlit将自动生成一个唯一键。
返回值:
button方法返回一个布尔值,表示在上个应用周期按钮是否被点击。
示例代码
>>> if st.button('Say hello'):
...     st.write('Why hello there')
... else:
...     st.write('Goodbye')
st.checkbox - 显示复选框
streamlit的checkbox方法显示一个复选框组件。
方法原型
streamlit.checkbox(label, value=False, key=None)
参数:
label :复选框文本字符串
value:选中状态,布尔值
key:组件ID,可选
返回值:
checkbox方法返回一个布尔值,表示复选框是否被选中。
示例代码
>>> agree = st.checkbox('I agree')
>>>
>>> if agree:
...     st.write('Great!')
st.radio - 显示单选框
streamlit的radio方法显示单选框组件。
方法原型
streamlit.radio(label, options, index=0, format_func=<class ‘str’>, key=None)
参数:
label:单选框文本,字符串
options:选项列表,可以是以下类型:
- list
- tuple
- numpy.ndarray
- pandas.Series
index:选中项的序号,整数
format_func:选项文本的显示格式化函数
key:组件ID,当未设置时,streamlit会自动生成
返回值:
radio方法返回选中的选项。
示例代码
>>> genre = st.radio(
...     'What's your favorite movie genre',
...     ('Comedy', 'Drama', 'Documentary'))
>>>
>>> if genre == 'Comedy':
...     st.write('You selected comedy.')
... else:
...     st.write('You didn't select comedy.')
st.selectbox - 显示列表选择框
streamlit的selectbox显示列表选择框组件。
方法原型
streamlit.selectbox(label, options, index=0, format_func=<class ‘str’>, key=None)
参数:
label:选择框说明文本,字符串
options:选项列表,可以是以下类型:
- list
- tuple
- numpy.ndarray
- pandas.Series
index:选中的选项的序号,整数
format_func:选项显示格式化函数
key:选择框组件的ID
返回值:
selectbox方法返回选中的选项。
示例代码
>>> option = st.selectbox(
...     'How would you like to be contacted?',
...     ('Email', 'Home phone', 'Mobile phone'))
>>>
>>> st.write('You selected:', option)
st.multiselect - 显示列表多选框
streamlit的multiselect显示列表多选框组件。
方法原型
streamlit.multiselect(label, options, default=None, format_func=<class ‘str’>, key=None)
参数:
label:选择框说明文本,字符串
options:选项列表,可以是以下类型:
- list
- tuple
- numpy.ndarray
- pandas.Series
index:选中的选项的序号,整数
format_func:选项显示格式化函数
key:选择框组件的ID
返回值:
multiselect方法返回选中的选项列表。
示例代码
>>> options = st.multiselect(
...     'What are your favorite colors',
        ('Yellow', 'Red')
...     ('Green', 'Yellow', 'Red', 'Blue'))
>>>
>>> st.write('You selected:', options)
st.slider - 显示滑动拉杆
streamlit的slider方法显示滑动拉杆组件。
方法原型
streamlit.slider(label, min_value=None, max_value=None, value=None, step=None, format=None, key=None)
参数:
label:说明文本,字符串
min_value:允许的最小值,默认值:0或0.0
max_value:允许的最大值,默认值:0或0.0
value:当前值,默认值为min_value
step:步长,默认值为1或0.01
format:数字显示格式字符串
key:组件ID
返回值:
slider方法返回滑动拉杆组件的当前值。
示例代码
>>> age = st.slider('How old are you?', 0, 130, 25)
>>> st.write("I'm ", age, 'years old')
也可以指定一个值范围:

>>> values = st.slider(
...     'Select a range of values',
...     0.0, 100.0, (25.0, 75.0))
>>> st.write('Values:', values)
st.text_input - 显示文本输入框
streamlit的text_input方法显示单行文本输入框。
方法原型
streamlit.text_input(label, value=’’, key=None)
参数:
label:组件说明文本,字符串
value:组件的输入文本
key:组件ID
返回值:
text_input方法返回文本输入框组件的当前内容。
示例代码
>>> title = st.text_input('Movie title', 'Life of Brian')
>>> st.write('The current movie title is', title)
st.number_input - 显示数值输入框
streamlit的number_input方法显示数值输入框。
方法原型
streamlit.number_input(label, min_value=None, max_value=None, value=<streamlit.DeltaGenerator.NoValue object>, step=None, format=None)
参数:
label:组件说明文本,字符串
min_value:允许的最小值,int或float或None,如果是None则表示没有最小值限制
max_value:允许的最大值,int或float或None,如果是None则表示没有最大值限制
value:组件的当前值
step:数值变化步长,默认值:1或0.01
format:数值显示格式化字符串或None
返回值:
number_input方法返回输入组件的当前值。
示例代码
>>> number = st.number_input('Insert a number')
>>> st.write('The current number is ', number)
st.text_area - 显示多行文本框
streamlit的text_area方法显示多行文本框。
方法原型
streamlit.text_area(label, value=’’, key=None)
参数:
label:组件说明文本,字符串
value:组件当前文本内容
key:组件ID
返回值:
text_area方法返回组件的当前文本内容。
示例代码
>>> txt = st.text_area('Text to analyze', '''
...     It was the best of times, it was the worst of times, it was
...     the age of wisdom, it was the age of foolishness, it was
...     the epoch of belief, it was the epoch of incredulity, it
...     was the season of Light, it was the season of Darkness, it
...     was the spring of hope, it was the winter of despair, (...)
...     ''')
>>> st.write('Sentiment:', run_sentiment_analysis(txt))
st.date_input - 显示日期输入框
streamlit的date_input方法显示日期输入框组件。
方法原型
streamlit.date_input(label, value=None, key=None)
参数:
label:组件说明文本
value:组件当前值,可以是以下类型:datetime.date/datetime.datetime。默认值:今天
key:组件ID
返回值:
date_input方法返回组件的当前值。
示例代码
>>> d = st.date_input(
...     'When's your birthday',
...     datetime.date(2019, 7, 6))
>>> st.write('Your birthday is:', d)
st.time_input - 显示时间输入框
streamlit的time_input方法显示时间输入框组件。
方法原型
streamlit.time_input(label, value=None, key=None)
参数:
label:组件说明文本
value:组件当前值,类型为: datetime.time/datetime.datetime。默认值:当前时间
key:组件ID
返回值:
time_input方法返回组件的当前值。
示例i代码
>>> t = st.time_input('Set an alarm for', datetime.time(8, 45))
>>> st.write('Alarm is set for', t)
st.echo - 显示应用源代码
在with块中使用streamlit的echo方法显示应用源代码,然后执行。
方法原型
streamlit.echo()
示例代码
>>> with st.echo():
>>>     st.write('This code will be printed')
下面的示例将中部代码可视化:
import streamlit as st

def get_user_name():
    return 'John'

# ------------------------------------------------
# Want people to see this part of the code...

def get_punctuation():
    return '!!!'

greeting = "Hi there, "
user_name = get_user_name()
punctuation = get_punctuation()

st.write(greeting, user_name, punctuation)

# ...up to here
# ------------------------------------------------

foo = 'bar'
st.write('Done!')
上面的文件创建了一个Streamlit应用,包含词语“Hi there, John”, 以及 “Done!”.
现在让我们使用st.echo()让中间部分的代码可视化:
import streamlit as st

def get_user_name():
    return 'John'

with st.echo():
    # Everything inside this block will be both printed to the screen
    # and executed.

    def get_punctuation():
        return '!!!'

    greeting = "Hi there, "
    value = get_user_name()
    punctuation = get_punctuation()

    st.write(greeting, value, punctuation)

# And now we're back to _not_ printing to the screen
foo = 'bar'
st.write('Done!')
真的很简单!
提示:在一个文件中你可以使用多个st.echo块。
st.progress - 显示进度
streamlit的progress方法显示一个进度条组件。
方法原型
streamlit.progress(value)
参数:
value:完成的百分比,范围为:[0,100]
示例代码
>>> import time
>>>
>>> my_bar = st.progress(0)
>>>
>>> for percent_complete in range(100):
...     my_bar.progress(percent_complete + 1)
st.spinner - 显示执行状态
streamlit的spinner方法在执行代码块时显示状态信息。
方法原型
streamlit.spinner(text=‘In progress…’)
参数:
text:要显示的状态信息
示例代码
>>> with st.spinner('Wait for it...'):
>>>     time.sleep(5)
>>> st.success('Done!')
st.balloons - 显示庆祝气球
streamlit的balloons方法显示一个庆祝气球。
方法原型
streamlit.balloons()
示例代码
>>> st.balloons()
st.error - 显示错误信息
方法原型
streamlit.error(body)
参数:
body:要显示的错误信息。
示例代码
>>> st.error('This is an error')
st.warning - 显示警告信息
streamlit的warning方法显示警告信息。
方法原型
streamlit.warning(body)
参数:
body:要显示的警告信息
示例代码
>>> st.warning('This is a warning')
st.info - 显示提示信息
streamlit的info方法显示提示信息。
方法原型
streamlit.info(body)
参数:
body:要显示的提示信息
示例代码
>>> st.info('This is a purely informational message')
st.success - 显示成功信息
streamlit的success方法显示成功信息。
方法原型
streamlit.success(body)
参数:
body:要显示的成功信息文本
示例代码
>>> st.success('This is a success message!')
st.exception - 显示异常信息
streamlit的exception方法显示异常信息。
方法原型
streamlit.exception(exception, exception_traceback=None)
参数:
exception:要显示的异常对象,类型:Exception
exception_traceback:如果是None或False,则不显示栈回溯历史。如果是True,则 尝试自动捕捉栈回溯历史。如果是一个Traceback对象,则直接显示该对象的内容
示例代码
>>> e = RuntimeError('This is an exception of type RuntimeError')
>>> st.exception(e)
st.empty - 添加占位符
streamlit的empty方法为应用添加一个占位符。 可以调用返回值的方法来填充占位符。
方法原型
streamlit.empty()
示例代码
>>> my_placeholder = st.empty()
>>>
>>> # Now replace the placeholder with some text:
>>> my_placeholder.text("Hello world!")
>>>
>>> # And replace the text with an image:
>>> my_placeholder.image(my_image_bytes)
st.help - 显示帮助信息
streamlit的help方法显示指定对象的doc字符串。
方法原型
streamlit.help(obj)
参数:
obj:要显示其doc字符串的对象
示例代码
如果你记不住如何初始化DataFrame,可以使用如下代码:
>>> st.help(pandas.DataFrame)
如果你希望快速查看某个函数的输出数据类型是什么,可以尝试:

>>> x = my_poorly_documented_function()
>>> st.help(x)
st.cache - 函数缓存装饰器
streamlit的cache装饰器用于记忆函数的历史执行。
方法原型
streamlit.cache(func=None, persist=False, allow_output_mutation=False, show_spinner=True, suppress_st_warning=False, **kwargs)
参数:
func:要缓存的函数
persist :是否缓存到磁盘,布尔值
allow_output_mutation:是否允许修改输出,布尔值
show_spinner:是否显示执行状态,布尔值
suppress_st_warning:是否抑制警告信息输出,布尔值
示例代码
>>> @st.cache
... def fetch_and_clean_data(url):
...     # Fetch data from URL here, and then clean it up.
...     return data
...
>>> d1 = fetch_and_clean_data(DATA_URL_1)
>>> # Actually executes the function, since this is the first time it was
>>> # encountered.
>>>
>>> d2 = fetch_and_clean_data(DATA_URL_1)
>>> # Does not execute the function. Just returns its previously computed
>>> # value. This means that now the data in d1 is the same as in d2.
>>>
>>> d3 = fetch_and_clean_data(DATA_URL_2)
>>> # This is a different URL, so the function executes.
下面的代码设置persist参数:

>>> @st.cache(persist=True)
... def fetch_and_clean_data(url):
...     # Fetch data from URL here, and then clean it up.
...     return data
要禁止哈希返回值,可以设置allow_output_mutation参数为True:

>>> @st.cache(allow_output_mutation=True)
... def fetch_and_clean_data(url):
...     # Fetch data from URL here, and then clean it up.
...     return data
dg.add_rows - 追加数据行
DeltaGenerator的add_rows方法为现有数据追加数据行。
方法原型
DeltaGenerator.add_rows(data=None, **kwargs)
参数:
data:要追加的数据表,类型可以是:
- pandas.DataFrame
- pandas.Styler
- numpy.ndarray
- Iterable
- dict
- None
**kwargs:同上,只是采用关键字参数格式
示例代码
>>> df1 = pd.DataFrame(
...    np.random.randn(50, 20),
...    columns=('col %d' % i for i in range(20)))
...
>>> my_table = st.table(df1)
>>>
>>> df2 = pd.DataFrame(
...    np.random.randn(50, 20),
...    columns=('col %d' % i for i in range(20)))
...
>>> my_table.add_rows(df2)
>>> # Now the table shown in the Streamlit app contains the data for
>>> # df1 followed by the data for df2.
也可以为图表添加数据。例如:

>>> # Assuming df1 and df2 from the example above still exist...
>>> my_chart = st.line_chart(df1)
>>> my_chart.add_rows(df2)
>>> # Now the chart shown in the Streamlit app contains the data for
>>> # df1 followed by the data for df2.
如果图表使用命名数据集,你可以使用关键字参数传入:

>>> my_chart = st.vega_lite_chart({
...     'mark': 'line',
...     'encoding': {'x': 'a', 'y': 'b'},
...     'datasets': {
...       'some_fancy_name': df1,  # <-- named dataset
...      },
...     'data': {'name': 'some_fancy_name'},
... }),
>>> my_chart.add_rows(some_fancy_name=df2)  # <-- name used as keyword
streamlit help - 查看帮助信息
使用streamlit的help子命令查看帮助文档。
命令调用
$ streamlit --help
使用streamlit的run子命令运行streamlit应用。你可以随时 使用Ctrl+c终止应用。
命令调用
$ streamlit run your_script.py [-- script args]
注意:
当应用脚本传入参数时,必须使用双横线,否则参数就被视为streamlit的而非应用 脚本的。
也可以传入配置选项来修改应用端口、禁用自动保存等特性。要查看可用选型,运行 如下命令:
$ streamlit run --help
提示:
如果你希望永久性设置配置项,可以修改$CWD/.streamlit/config.toml或这 修改全局配置文件~/.streamlit/config.toml。
运行预置演示应用
使用下面命令运行Steamlit预置的演示应用:
$ streamlit hello
这会在web浏览器中打开Streamlit的Hello World 应用,对快速上手Streamlit很有帮助。
streamlit config show - 查看配置选项
使用streamlit的config show子命令查看配置选项。该命令 显示Streamlit所有可用的配置项以及其当前值。可以使用三种 不同的方法来修改这些配置项:
全局配置文件:~/.streamlit/config.toml
项目配置文件:$CWD/.streamlit/config.toml
每次执行时:在命令行传入选项即可
命令调用
$ streamlit config show
streamlt cache clear - 清理缓存
使用streamlit的cache clear方法清理缓存。
命令调用
$ streamlit cache clear
streamlit docs - 查看文档
使用streamlit的docs子命令查看文档。该命令将在web浏览器 中打开Streamlit的文档。
命令调用
$ streamlit docs
原文链接
http://cw.hubwiz.com/card/c/streamlit-manual/


 5万+
5万+

 被折叠的 条评论
为什么被折叠?
被折叠的 条评论
为什么被折叠?
 到【灌水乐园】发言


