


对Prometheus感兴趣的朋友请加入QQ群:70860761 一起探讨
Prometheus常用服务架构图
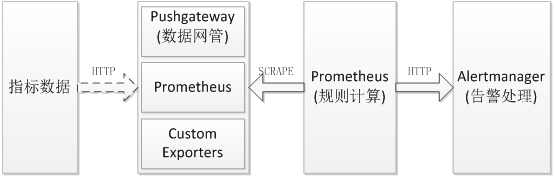
指标的采集有以下三种方式:
1. 指标数据先存储到第三方组件中(如:Kafka),通过http协议发送到Pushgateway,然后Prometheus周期性的从Pushgateway中获取指标数据。
2. Prometheus互相可以成为对方的target(目标),从对方服务中获取指标数据。
3. 自定义指标数据(CustomExporter),Prometheus将CustomExporter设置为自己的target.
Pushgateway方式
在Prometheus的prometheus.yml配置文件中的scrape_configs标签下添加一下啊配置:
scrape_configs:
  # The job name is added as a label `job=<job_name>` to any timeseries scraped from this config.
  - job_name: 'windows-test'

    # Override the global default and scrape targets from this job every 5 seconds.
    scrape_interval: 1s

    # metrics_path defaults to '/metrics'
    # scheme defaults to 'http'.

    static_configs:
      - targets: ['192.168.3.120:9091']
说明:Pushgateway默认端口为9091
发送指标到Pushgateway
import io.prometheus.client.CollectorRegistry;
import io.prometheus.client.Gauge;
import io.prometheus.client.exporter.PushGateway;

void executeBatchJob() throws Exception {
 CollectorRegistry registry = new CollectorRegistry();
 Gauge duration = Gauge.build()
     .name("my_batch_job_duration_seconds")
     .help("Duration of my batch job in seconds.")
     .register(registry);
 Gauge.Timer durationTimer = duration.startTimer();
 try {
   // Your code here.

   // This is only added to the registry after success,
   // so that a previous success in the Pushgateway is not overwritten on failure.
   Gauge lastSuccess = Gauge.build()
       .name("my_batch_job_last_success_unixtime")
       .help("Last time my batch job succeeded, in unixtime.")
       .register(registry);
   lastSuccess.setToCurrentTime();
 } finally {
   durationTimer.setDuration();
   PushGateway pg = new PushGateway("127.0.0.1:9091");
   pg.pushAdd(registry, "my_batch_job");
 }
}
所依赖Maven包
 <dependency>
    <groupId>io.prometheus</groupId>
    <artifactId>simpleclient</artifactId>
    <version>0.0.10</version>
</dependency>
<dependency>
    <groupId>io.prometheus</groupId>
    <artifactId>simpleclient_pushgateway</artifactId>
    <version>0.0.10</version>
</dependency>
Prometheus互相采集方式
与Pushgateway方式类似,将Prometheus的地址(格式IP:端口)加入到指定prometheus.yml配置文件中启动即可。
自定义方式
实现方式
1、自定义的指标收集类都必须到CollectorRegistry进行注册, 指标数据通过CollectorRegistry类的方法或者函数,返回给Prometheus.
2、CollectorRegistry必须提供register()和unregister()函数,一个指标收集器可以注册多个CollectorRegistry.
3、客户端库必须是线程安全的.
示例
func NewCollector(program string) *prometheus.GaugeVec {
    buildInfo := prometheus.NewGaugeVec(
        prometheus.GaugeOpts{
            Namespace: program,
            Name:      "build_info",
            Help: fmt.Sprintf(
                "A metric with a constant '1' value labeled by version, revision, branch, and goversion from which %s was built.",
                program,
            ),
        },
        []string{"version", "revision", "branch", "goversion"},
    )
    buildInfo.WithLabelValues(Version, Revision, Branch, GoVersion).Set(1)
    return buildInfo
}

prometheus.MustRegister(version.NewCollector("mysqld_exporter"))
告警发送服务接口
Prometheus根据告警规则配置自动发送告警信息。以HTTP POST的方式发送报警信息,只要告警的状态活跃就会不停的告警,告警默认地址: http://AlertManagerIP:9093/api/v1/alerts。
告警格式如下:
[
  {
    "labels": {
      "<labelname>": "<labelvalue>",
      ...
    },
    "annotations": {
      "<labelname>": "<labelvalue>",
    },
    "startsAt": "<rfc3339>",
    "endsAt": "<rfc3339>"
    "generatorURL": "<generator_url>"
  },
  ...
]
说明:
labels:区分具相同告警实体不同标签类别的告警。
annotations:表示最新接收没有被标识的告警
startsAs和endsAt时间戳在省略的情况下,startsAs为Alertmanager当前时间,endsAt只能设置为告警的结束时间。其它情况下配置的超时时间从最近一次接受到告警开始计时。
generatorURL:唯一标识告警客户端的入口。


 1472
1472

 被折叠的 条评论
为什么被折叠?
被折叠的 条评论
为什么被折叠?
 到【灌水乐园】发言


