


本节主要讲一下怎么使用QPainter来绘制一个图像的灰度直方图。
灰度直方图表示图象中具有每种灰度级的象素的个数,可以用来评价图像的一些性质:例如,明亮图像的直方图倾向于灰度级高的一侧;低对比度图像的直方图窄而集中于灰度级的中部,高对比度图像的直方图成分覆盖的灰度级很宽而且像素的分布没有不太均匀,只有少量的垂线比其他高许多。
要绘制灰度直方图,直接从定义入手,首先根据输入的二维图像获得每个灰度级的像素个数,以vector的形式来保存,如下:
static vector<int> Histogram(QImage* img)
		{
			unsigned char* graydata = img->bits();
			vector<int> hist(256);
			for (int i=0;i!=img->width();i++)
			{
				for (int j=0;j!=img->height();j++)
				{
					int index = int(*graydata);
					hist[index] = hist[index]+1;
					graydata+=3;
				}
			}
			graydata = NULL;
			return hist;
		}
然后就可以根据得到的数据使用QPainter绘制直方图了
void HistogramWidget::paintEvent(QPaintEvent *e)
{
	QPainter p(this);
	p.setBrush(QBrush(QColor(121,121,121)));
	p.drawRect(0,0,this->width(),this->height());
	if(!readToDraw)
		return;

	p.setBrush(QBrush(QColor(255,255,255)));
	p.drawRect(0,0,this->width(),this->height());
	std::vector<int> sortcount = count;
	std::sort(sortcount.begin(),sortcount.end());
	int maxcount = sortcount[sortcount.size()-1];


	hist = new QImage(this->width(),this->height(),QImage::Format_RGB888);
	hist->fill(qRgb(255,255,255));
	p.translate(0,hist->height());


	p.drawLine(0,0,100,100);

	int wid=hist->width();
	int hei=hist->height();

	p.drawLine(10,-10,wid-10,-10);// 横轴
	p.drawLine(10,-10,10,-hei+10);//纵轴

	float xstep = float(wid-20) / 256;
	float ystep = float(hei-20) / maxcount;

	for (int i=0;i!=256;i++)
	{
		if(i!=255)
		{
			QColor color(i,255-i,0);
			//p.setPen(Qt::blue);
			//p.setBrush(Qt::blue);
			p.setBrush(color);
			p.setPen(color);
			//p.drawLine(QPointF(10+(i+0.5)*xstep,-10-ystep*count[i]),QPointF(10+(i+1.5)*xstep,-10-ystep*count[i+1]));
			p.drawRect(10+i*xstep,-10,xstep,-10-ystep*count[i]);
		}

		if(i % 32 == 0||i==255)
		{
			p.drawText(QPointF(10+(i-0.5)*xstep,0),QString::number(i));
		}

	}
}
首先要获得像素个数最多的那一个灰度级,将这个数量与窗口的高度进行一个映射,其他灰度级在绘制的时候都要按照这个比例来绘制,这样得到的结果就是在数量最多的灰度级是最高的。值得注意的是每个方向都预留点空间绘制坐标轴
由于QPainter的坐标系是从左上角开始的,这里对坐标系进行了一个简单的转换,使原点为左下角,x轴向右,y轴向上。这里将QPainter绘制的结果以QImage的形式保存,是方便后续将直方图输出保存到硬盘中。
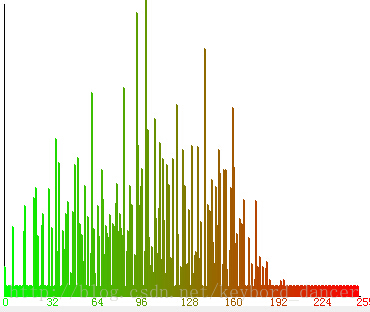
绘制出来的结果如下图所示:


 241
241


 被折叠的 条评论
为什么被折叠?
被折叠的 条评论
为什么被折叠?
 到【灌水乐园】发言


