要素外接矩形的四个角点坐标、长度、宽度、面积如何计算到要素属性表中?

使用工具 Calculate Field。


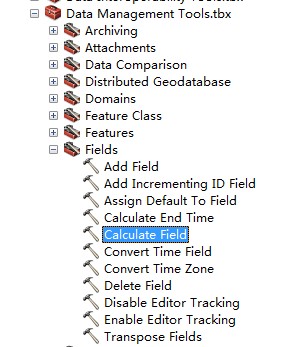
9.3以上版本可按下图的方法分别求出envelope的x、y坐标的最大、最小值,由此可得出你要的那些值,需注意的的是求长度、面积等要在投影坐标系下进行。


X的最大值:!shape.extent.XMax!

X的最小值:!shape.extent.XMin!

Y的最大值:!shape.extent.YMax!

Y的最大值:!shape.extent.YMin!

面积:!shape.area!

周长:!shape.length!


  • 2
    点赞
  • 4
    收藏
    觉得还不错? 一键收藏
  • 1
    评论
List of ArcGIS API for Flex 1.2 packages. See the Adobe Flex 3 Language Reference at http://livedocs.adobe.com/flex/3/langref/ for Adobe Flex 3 packages. Package Description com.esri.ags This package contains the main mapping classes: Map, Graphic, SpatialReference and Units. com.esri.ags.controls This package contains the InfoWindow, Navigation and ScaleBar control classes. com.esri.ags.controls.infoClasses This package contains the InfoWindow and InfoSymbol supporting classes. com.esri.ags.controls.navigationClasses This package contains the classes for styling the navigation control. com.esri.ags.events Event classes for map navigation, loading layers, geoprocessing tasks and toolbars. com.esri.ags.geometry MapPoint, Multipoint, Polyline, and Polygon are the main geometry classes. com.esri.ags.layers Supported map layers include ArcGIS (dynamic or tiled), ArcIMS, and Graphics. com.esri.ags.renderers Renderers help symbolize graphics according to their attributes. Useful for thematic mapping. [Added in version 1.2] com.esri.ags.symbol Symbols are used to represent "geometries" on the map. Marker symbols are available for point and multipoint geometries. Line symbols are available for polyline geometries. Fill symbols are available for polygon geometries. com.esri.ags.tasks This package contains classes related to ArcGIS Server tasks: find, geometry, geoprocessor, identify, locator, query and route services. com.esri.ags.toolbars This package contains non-UI toolbar classes. Use them to create your own toolbar implementations. com.esri.ags.utils This package contains utility classes for the ArcGIS API for Flex, such as getting the extent of several graphics, or converting data between geographic and web mercator projections. [Added in version 1.2] com.esri.ags.virtualearth This package contains classes related to Virtual Earth mapping and geocoding. [Added in version 1.2]
首先,可以使用 `cv2.rectangle()` 函数绘制矩形轮廓,并且该函数需要输入矩形的左上角和右下角顶点坐标。如果已知矩形四个顶点坐标,则可以计算出左上角和右下角顶点坐标,然后调用 `cv2.rectangle()` 函数绘制矩形轮廓。 如果要根据矩形四个角点坐标得到矩形轮廓所有点坐标,可以使用 NumPy 库的 `linspace()` 函数在两个顶点之间生成一组等间隔的坐标值,然后根据这些坐标值生成矩形轮廓的所有点坐标。具体步骤如下: 1. 计算矩形的左上角和右下角顶点坐标: ```python x1, y1 = min(x_coords), min(y_coords) x2, y2 = max(x_coords), max(y_coords) ``` 其中 `x_coords` 和 `y_coords` 分别为四个角点的横坐标和纵坐标列表。 2. 生成横坐标和纵坐标的等间隔坐标值: ```python x_values = np.linspace(x1, x2, num=100, endpoint=True) y_values = np.linspace(y1, y2, num=100, endpoint=True) ``` 这里生成了 100 个等间隔的坐标值,可以根据实际情况调整 `num` 参数。 3. 生成矩形轮廓的所有点坐标: ```python points = [(x, y) for x in x_values for y in y_values] ``` 这里使用了列表推导式和 `zip()` 函数生成所有点的坐标元组。 完整代码示例: ```python import cv2 import numpy as np # 四个角点坐标 points = [(100, 100), (300, 100), (300, 200), (100, 200)] # 提取横坐标和纵坐标列表 x_coords, y_coords = zip(*points) # 计算左上角和右下角顶点坐标 x1, y1 = min(x_coords), min(y_coords) x2, y2 = max(x_coords), max(y_coords) # 生成横坐标和纵坐标的等间隔坐标值 x_values = np.linspace(x1, x2, num=100, endpoint=True) y_values = np.linspace(y1, y2, num=100, endpoint=True) # 生成矩形轮廓的所有点坐标 points = [(x, y) for x in x_values for y in y_values] # 绘制矩形轮廓并显示 img = np.zeros((300, 400, 3), dtype=np.uint8) cv2.drawContours(img, [np.array(points)], 0, (0, 255, 0), 2) cv2.imshow('image', img) cv2.waitKey(0) cv2.destroyAllWindows() ```
评论 1
添加红包

请填写红包祝福语或标题

红包个数最小为10个

红包金额最低5元

当前余额3.43前往充值 >
需支付:10.00
成就一亿技术人!
领取后你会自动成为博主和红包主的粉丝 规则
hope_wisdom
发出的红包
实付
使用余额支付
点击重新获取
扫码支付
钱包余额 0

抵扣说明:

1.余额是钱包充值的虚拟货币,按照1:1的比例进行支付金额的抵扣。
2.余额无法直接购买下载,可以购买VIP、付费专栏及课程。

余额充值