


问题描述:
我使用GEE想导出全球的SPEI指数,在设置范围的时候我尝试了两种方法:(1)不写研究区范围(2)研究区范围写成(-180,-90,180,90),这两种方法导出来的影像数据都只有1列(314*1)。
我尝试换了一个数据集,同样用了这两种办法,结果导出来的影像却是正常的。
这个问题与数据集有关系。如果遇到了这种情况,可以采取设置小一点的研究范围来解决。
详细解释:
(1)原始的代码:
// Retrieve the last date from the SPEI dataset.
var dataset = ee.ImageCollection("CSIC/SPEI/2_9").
  filterDate('2022-12-01', '2023-01-01');

// Select the 24-month analysis.
var spei24 = dataset.select('SPEI_24_month');

// Set the visualization ranges and color palette.
var visParams = {
  min: -2.33,
  max:  2.33,
  palette: [
    '8b1a1a', 'de2929', 'f3641d',
    'fdc404', '9afa94', '03f2fd',
    '12adf3', '1771de', '00008b',
  ]
};

// Set the map center to Spain's location.
Map.setCenter(-3.75, 40.47, 4);

// Display the SPEI 24-month layer.
Map.addLayer(spei24, visParams, 'SPEI 24 month');

// Define an area of interest
var geometry = ee.Geometry.Rectangle([-180, -90, 180, 90]);

// Export the image to Google Drive
Export.image.toDrive({
  image: spei24.mean(), // Exporting the mean of the 24-month SPEI
  description: 'SPEI_24_month_mean',
  folder: 'GEE_exports', // Change to your folder name in Google Drive
  region: geometry,
  scale: 50000, // Change according to your preference
  crs: 'EPSG:4326', // Change according to your preference
  maxPixels: 1e13 // Adjust as per your requirement
});
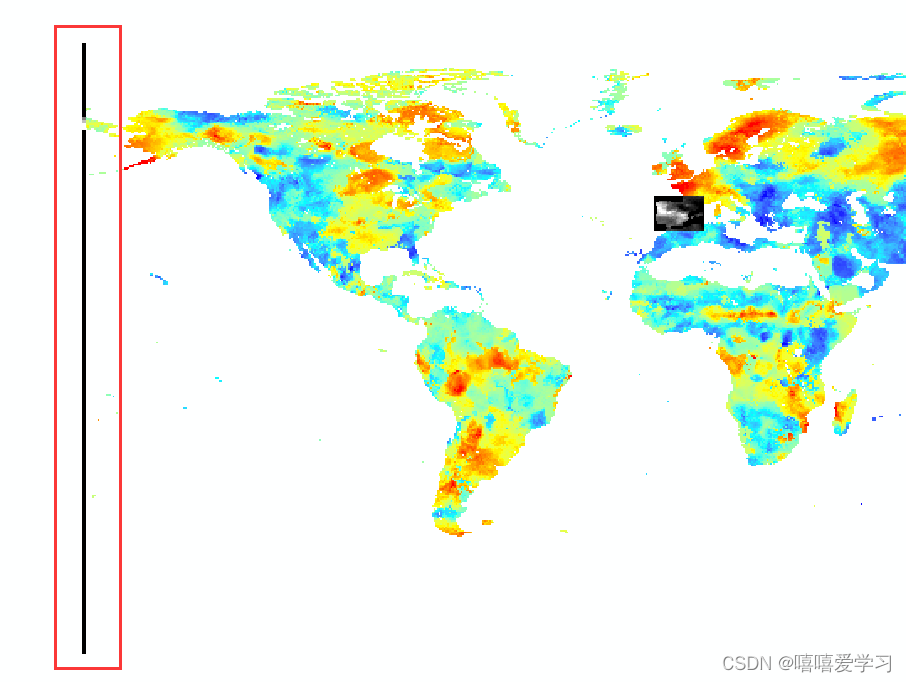
原始导出结果:
(2)修改:
// Define an area of interest
var geometry = ee.Geometry.Rectangle([0, -90, 180, 90]);
结果:
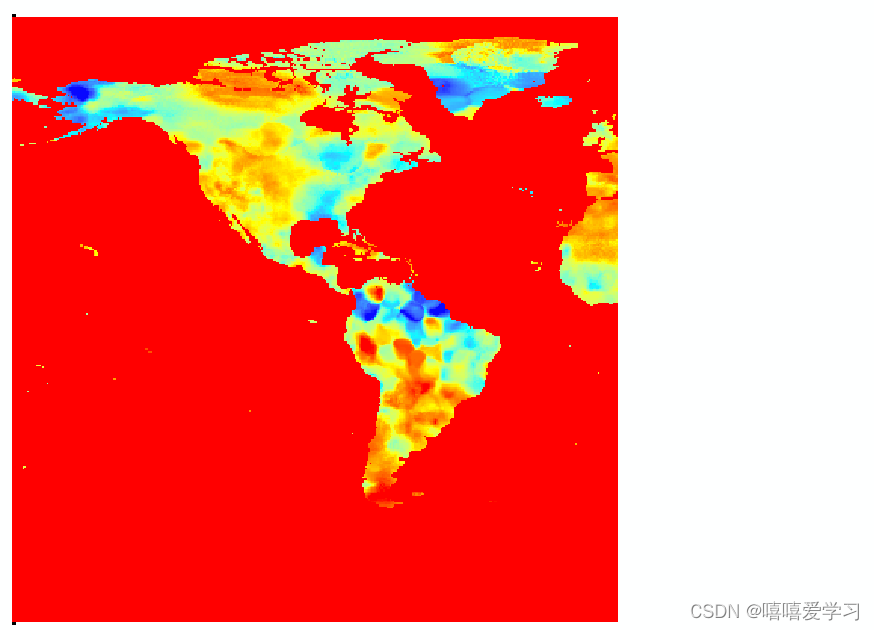
我把这个影像分成两半来下载就会好很多。


 285
285


 被折叠的 条评论
为什么被折叠?
被折叠的 条评论
为什么被折叠?
 到【灌水乐园】发言


