


概述
本文主要介绍bpftrace的使用及语法规则,主要内容来自于官网的文档,以及使用过程中遇到的一些问题;本文将不涉及ebpf概念、框架介绍等。
参见:官方使用文档
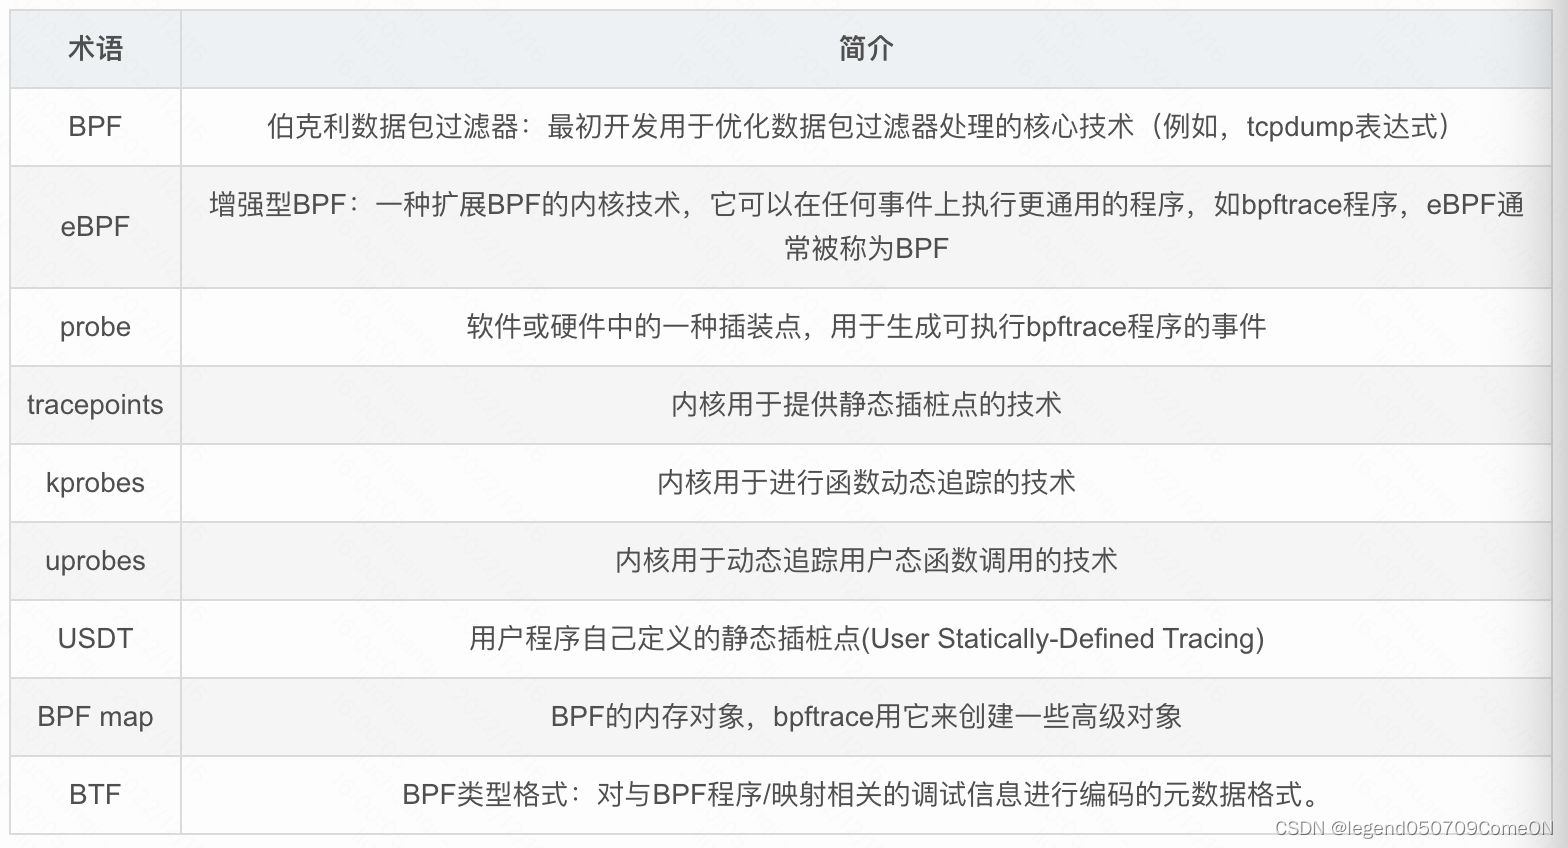
名称解释
bpftrace 的简单使用
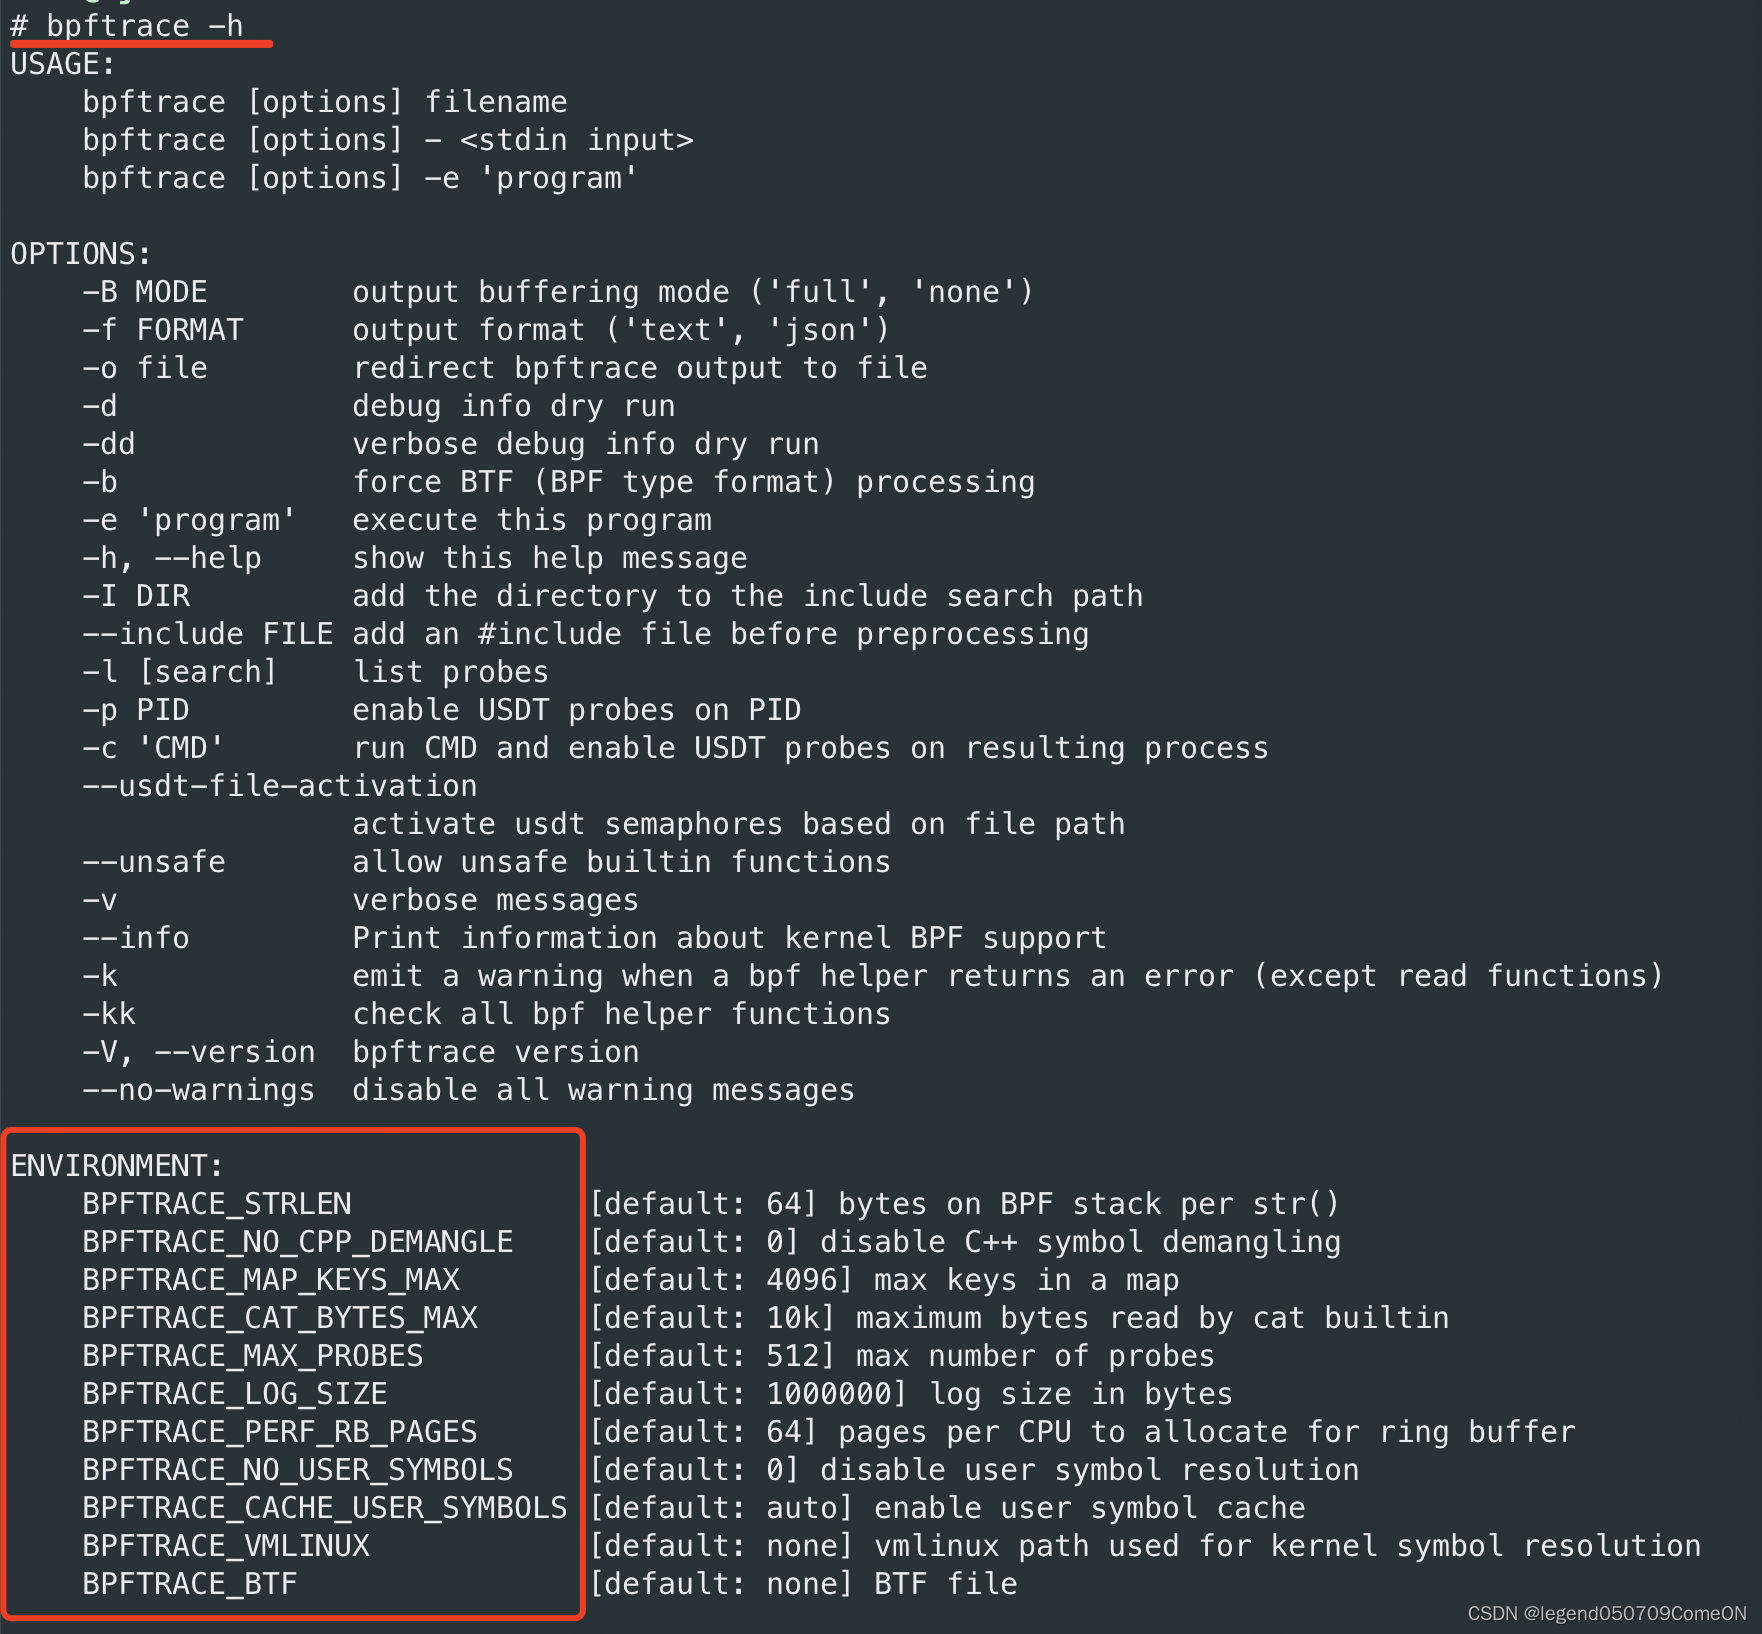
help
# bpftrace -h
USAGE:
    bpftrace [options] filename
    bpftrace [options] - <stdin input>
    bpftrace [options] -e 'program'

OPTIONS:
    -B MODE        output buffering mode ('full', 'none')
    -f FORMAT      output format ('text', 'json')
    -o file        redirect bpftrace output to file
    -d             debug info dry run
    -dd            verbose debug info dry run
    -b             force BTF (BPF type format) processing
    -e 'program'   execute this program
    -h, --help     show this help message
    -I DIR         add the directory to the include search path
    --include FILE add an #include file before preprocessing
    -l [search]    list probes
    -p PID         enable USDT probes on PID
    -c 'CMD'       run CMD and enable USDT probes on resulting process
    --usdt-file-activation
                   activate usdt semaphores based on file path
    --unsafe       allow unsafe builtin functions
    -v             verbose messages
    --info         Print information about kernel BPF support
    -k             emit a warning when a bpf helper returns an error (except read functions)
    -kk            check all bpf helper functions
    -V, --version  bpftrace version
    --no-warnings  disable all warning messages

ENVIRONMENT:
    BPFTRACE_STRLEN             [default: 64] bytes on BPF stack per str()
    BPFTRACE_NO_CPP_DEMANGLE    [default: 0] disable C++ symbol demangling
    BPFTRACE_MAP_KEYS_MAX       [default: 4096] max keys in a map
    BPFTRACE_CAT_BYTES_MAX      [default: 10k] maximum bytes read by cat builtin
    BPFTRACE_MAX_PROBES         [default: 512] max number of probes
    BPFTRACE_LOG_SIZE           [default: 1000000] log size in bytes
    BPFTRACE_PERF_RB_PAGES      [default: 64] pages per CPU to allocate for ring buffer
    BPFTRACE_NO_USER_SYMBOLS    [default: 0] disable user symbol resolution
    BPFTRACE_CACHE_USER_SYMBOLS [default: auto] enable user symbol cache
    BPFTRACE_VMLINUX            [default: none] vmlinux path used for kernel symbol resolution
    BPFTRACE_BTF                [default: none] BTF file

EXAMPLES:
bpftrace -l '*sleep*'
    list probes containing "sleep"
bpftrace -e 'kprobe:do_nanosleep { printf("PID %d sleeping...\n", pid); }'
    trace processes calling sleep
bpftrace -e 'tracepoint:raw_syscalls:sys_enter { @[comm] = count(); }'
    count syscalls by process name
hello world
# bpftrace -e 'BEGIN { printf("hello world!\n"); }'
Attaching 1 probe...
hello world!
^C

注:BEGIN 是 bpftrace的特殊的probe。
    crtl + C 结束 bpftrace;
One-Liners程序
使用-e选项指定一个程序,用于构造单行程序,类似awk语法,下例打印了进入睡眠状态的进程:
# bpftrace -e 'tracepoint:syscalls:sys_enter_nanosleep { printf("%s is sleeping.\n", comm); }'
Attaching 1 probe...
iscsid is sleeping.
irqbalance is sleeping.
iscsid is sleeping.
iscsid is sleeping.
[...]
列出可跟踪点
使用-l选项列出当前可用追踪点:
# bpftrace -l | more
software:alignment-faults:
software:bpf-output:
software:context-switches:
[...]

# bpftrace -l | wc -l
50193
可使用通配符进行查询:
# bpftrace -l '*sys_enter*' | more
tracepoint:syscalls:sys_enter_socket
tracepoint:syscalls:sys_enter_socketpair
tracepoint:syscalls:sys_enter_bind
tracepoint:syscalls:sys_enter_listen
使用-v选项可以列出tracepoint类型跟踪点的参数:
# bpftrace -lv tracepoint:syscalls:sys_enter_shmctl
tracepoint:syscalls:sys_enter_shmctl
    int __syscall_nr;
    int shmid;
    int cmd;
    struct shmid_ds * buf;
如果BTF可用(内核选项CONFIG_DEBUG_INFO_BTF=y,查看有无/sys/kernel/btf/vmlinux验证),也可以查看结构体struct/union/enum的定义,如:
# bpftrace -lv "struct path"
struct path {
        struct vfsmount *mnt;
        struct dentry *dentry;
};
调试输出-d
可以使用-d选项调试bpftrace程序,此时程序不会运行,常被用来检测bpftrace自身的问题。也可以使用```-dd``获得更多调试信息:
#  bpftrace -d -e 'tracepoint:syscalls:sys_enter_nanosleep { printf("%s enter sleeping\n", comm); }'

AST
-------------------
#include <linux/types.h>

Program
 tracepoint:syscalls:sys_enter_nanosleep
  call: printf
   string: %s enter sleeping\n
   builtin: comm


AST after semantic analysis
-------------------
Program
 tracepoint:syscalls:sys_enter_nanosleep
  call: printf :: type[none, ctx: 0]
   string: %s enter sleeping\n :: type[string[64], ctx: 0]
   builtin: comm :: type[string[16], ctx: 0]

; ModuleID = 'bpftrace'
source_filename = "bpftrace"
target datalayout = "e-m:e-p:64:64-i64:64-n32:64-S128"
target triple = "bpf-pc-linux"

%printf_t = type { i64, [16 x i8] }

; Function Attrs: nounwind
declare i64 @llvm.bpf.pseudo(i64, i64) #0

define i64 @"tracepoint:syscalls:sys_enter_nanosleep"(i8*) local_unnamed_addr section "s_tracepoint:syscalls:sys_enter_nanosleep_1" {
entry:
  %comm = alloca [16 x i8], align 1
  %printf_args = alloca %printf_t, align 8
  %1 = bitcast %printf_t* %printf_args to i8*
  call void @llvm.lifetime.start.p0i8(i64 -1, i8* nonnull %1)
  %2 = getelementptr inbounds [16 x i8], [16 x i8]* %comm, i64 0, i64 0
  %3 = bitcast %printf_t* %printf_args to i8*
  call void @llvm.memset.p0i8.i64(i8* nonnull align 8 %3, i8 0, i64 24, i1 false)
  call void @llvm.lifetime.start.p0i8(i64 -1, i8* nonnull %2)
  call void @llvm.memset.p0i8.i64(i8* nonnull align 1 %2, i8 0, i64 16, i1 false)
  %get_comm = call i64 inttoptr (i64 16 to i64 ([16 x i8]*, i64)*)([16 x i8]* nonnull %comm, i64 16)
  %4 = getelementptr inbounds %printf_t, %printf_t* %printf_args, i64 0, i32 1, i64 0
  call void @llvm.memcpy.p0i8.p0i8.i64(i8* nonnull align 8 %4, i8* nonnull align 1 %2, i64 16, i1 false)
  call void @llvm.lifetime.end.p0i8(i64 -1, i8* nonnull %2)
  %pseudo = call i64 @llvm.bpf.pseudo(i64 1, i64 1)
  %get_cpu_id = call i64 inttoptr (i64 8 to i64 ()*)()
  %perf_event_output = call i64 inttoptr (i64 25 to i64 (i8*, i64, i64, %printf_t*, i64)*)(i8* %0, i64 %pseudo, i64 %get_cpu_id, %printf_t* nonnull %printf_args, i64 24)
  call void @llvm.lifetime.end.p0i8(i64 -1, i8* nonnull %1)
  ret i64 0
}

; Function Attrs: argmemonly nounwind
declare void @llvm.lifetime.start.p0i8(i64, i8* nocapture) #1

; Function Attrs: argmemonly nounwind
declare void @llvm.memset.p0i8.i64(i8* nocapture writeonly, i8, i64, i1) #1

; Function Attrs: argmemonly nounwind
declare void @llvm.memcpy.p0i8.p0i8.i64(i8* nocapture writeonly, i8* nocapture readonly, i64, i1) #1

; Function Attrs: argmemonly nounwind
declare void @llvm.lifetime.end.p0i8(i64, i8* nocapture) #1

attributes #0 = { nounwind }
attributes #1 = { argmemonly nounwind }
输出详情
使用-v选项获得更多程序运行时的信息:
# bpftrace -v -e 'tracepoint:syscalls:sys_enter_nanosleep { printf("%s enter sleeping\n", comm); }'
Attaching 1 probe...

Program ID: 18

Bytecode:
0: (bf) r6 = r1
1: (b7) r1 = 0
2: (7b) *(u64 *)(r10 -24) = r1
3: (7b) *(u64 *)(r10 -32) = r1
4: (7b) *(u64 *)(r10 -40) = r1
5: (7b) *(u64 *)(r10 -8) = r1
6: (7b) *(u64 *)(r10 -16) = r1
7: (bf) r1 = r10
8: (07) r1 += -16
9: (b7) r2 = 16
10: (85) call bpf_get_current_comm#16
11: (79) r1 = *(u64 *)(r10 -16)
12: (7b) *(u64 *)(r10 -32) = r1
13: (79) r1 = *(u64 *)(r10 -8)
14: (7b) *(u64 *)(r10 -24) = r1
15: (18) r7 = 0xffff99f0c7186c00
17: (85) call bpf_get_smp_processor_id#8
18: (bf) r4 = r10
19: (07) r4 += -40
20: (bf) r1 = r6
21: (bf) r2 = r7
22: (bf) r3 = r0
23: (b7) r5 = 24
24: (85) call bpf_perf_event_output#25
25: (b7) r0 = 0
26: (95) exit
processed 26 insns (limit 131072), stack depth 40

Attaching tracepoint:syscalls:sys_enter_nanosleep
Running...
falcon-agent enter sleeping
falcon-agent enter sleeping
falcon-agent enter sleeping
falcon-agent enter sleeping
预处理选项
使用 -I选项帮助bpftrace程序寻找头文件位置(与gcc相似),使用–include选项包含头文件,可多次使用:
# cat program.bt
#include <foo.h>

BEGIN { @ = FOO }

# bpftrace program.bt
definitions.h:1:10: fatal error: 'foo.h' file not found

# /tmp/include
foo.h

# bpftrace -I /tmp/include program.bt
Attaching 1 probe...
# bpftrace --include linux/path.h --include linux/dcache.h \
    -e 'kprobe:vfs_open { printf("open path: %s\n", str(((struct path *)arg0)->dentry->d_name.name)); }'
Attaching 1 probe...
open path: .com.google.Chrome.ASsbu2
open path: .com.google.Chrome.gimc10
open path: .com.google.Chrome.R1234s
环境变量
# BPFTRACE_MAP_KEYS_MAX=1024 bpftrace -e 'tracepoint:syscalls:sys_enter_execve { printf("%s", comm); join(args->argv); }'
Attaching 1 probe...
- BPFTRACE_STRLEN
默认值64,使用str()获取BPF stack分配的字符串时返回的长度,当前可以设置的最大值为200,支持更大字符长度的问题仍在讨论中。 - BPFTRACE_NO_CPP_DEMANGLE
默认为0,默认启用了用户空间堆栈跟踪中的C++符号还原功能,将此环境变量设置为1,可以关闭此功能。 - BPFTRACE_MAP_KEYS_MAX
单个map中存储的最大key数量,默认4096。 - BPFTRACE_MAX_PROBES
bpftrace程序支持attach的钩子数量,默认512。 - BPFTRACE_CACHE_USER_SYMBOLS
默认情况下bpftrace缓存符号的解析结果,如果ASLR没有开启(Address Space Layout Randomization),仅仅跟踪一个程序的时候,开启此选项可以获得性能上的提升。 - BPFTRACE_BTF
BTF文件的路径,默认为None - BPFTRACE_MAX_BPF_PROGS
bpftrace可构造的最大BPF程序数量,默认值为512.
其它选项
- 使用-f选项指定输出信息格式,比如json
# bpftrace -f json -e 'tracepoint:syscalls:sys_enter_nanosleep { printf("%s enter sleeping\n", comm); }'
{"type": "attached_probes", "data": {"probes": 1}}
{"type": "printf", "data": "GoImcore enter sleeping\n"}
{"type": "printf", "data": "GoImcore enter sleeping\n"}
- 使用-o输出到文本
# bpftrace -f json -o ./sleep.json -e 'tracepoint:syscalls:sys_enter_nanosleep { printf("%s enter sleeping\n", comm); }'
^C
# cat sleep.json
{"type": "attached_probes", "data": {"probes": 1}}
{"type": "printf", "data": "GoImcore enter sleeping\n"}
{"type": "printf", "data": "GoImcore enter sleeping\n"}
bpftrace的语法
程序结构{…}
格式:probe[, probe, …] /filter/ { action }
即: 探针 /过滤器/ 动作
一个bpftrace程序可以有多个动作块,可使用过滤器。
# bpftrace -e 'kprobe:do_sys_open { printf("opening: %s\n", str(arg1)); }'
Attaching 1 probe...
opening: /proc/1804/cmdline
...
过滤/…/
格式: /filter/
在探针之后添加过滤器,探针仍然会触发,在满足过滤条件之后才会执行动作。
# bpftrace -e 'kprobe:vfs_read /comm == "bash"/ { printf("read %d bytes\n", arg2); }'
Attaching 1 probe...
read 256 bytes
read 728 bytes
注释//, /**/
// single-line comment
/*
 * multi-line comment
 */
常量
支持整数、字符和字符串常量:
# bpftrace -e 'BEGIN { printf("%lu %lu %lu", 1000000, 1e6, 1_000_000)}'
Attaching 1 probe...
1000000 1000000 1000000
c结构体访问:->
# bpftrace -e 'tracepoint:syscalls:sys_enter_openat { printf("%s %s\n", comm, str(args->filename)); }'
Attaching 1 probe...
Xorg /proc/1996/cmdline
tracepoint类型的跟踪点可使用args参数中访问filename成员,通过args->格式;
如果是kprobe类型跟踪点,则访问示例如下:
# cat path.bt
#!/usr/bin/bpftrace
#include <linux/path.h>
#include <linux/dcache.h>

/*
extern int vfs_open(const struct path *, struct file *, const struct cred *);
*/

kprobe:vfs_open
{
	printf("open path: %s\n", str(((struct path *)arg0)->dentry->d_name.name));
}

# bpftrace path.bt
Attaching 1 probe...
open path: dev
open path: if_inet6
open path: retrans_time_ms
使用了动态跟踪点对内核函数vfs_open进行了追踪,为了访问path和dentry结构,需要包含一些内核头文件。
结构体定义: struct
// from fs/namei.c:
struct nameidata {
        struct path     path;
        struct qstr     last;
        // [...]
};
一些情况下,内核的头文件包中没有包含需要的结构体,你可以在bpftrace工具中手动定义结构体。
三元操作符 ?::
语法同C语言,如下:
# bpftrace -e 'tracepoint:syscalls:sys_exit_read { @error[args->ret < 0 ? - args->ret : 0] = count(); }'
Attaching 1 probe...
^C

@error[11]: 51
@error[0]: 1744
条件语句 if () {…} else {…}
bpftrace条件语句中目前仅支持if/else,暂不支持else if:
# bpftrace -e 'tracepoint:syscalls:sys_enter_read { @read = count(); if (args->count > 1024) { @large = count(); } }'
Attaching 1 probe...
^C

@large: 240

@read: 1206
循环语句unroll
使用unroll()对语句进行循环执行
# bpftrace -e 'kprobe:do_nanosleep { $i = 1; unroll(5) { printf("i:%d\n", $i); $i = $i + 1; } }'
Attaching 1 probe...
i:1
i:2
i:3
i:4
i:5
自增、自减++、–
++和–可以用于maps或者变量的自增/自减,需要注意的是maps没有定义的话值会被隐式的初始化为0。变量需要初始化之后才能使用这些操作符。
- Example - variable:
bpftrace -e 'BEGIN { $x = 0; $x++; $x++; printf("x: %d\n", $x); }'
Attaching 1 probe...
x: 2
^C
- Example - map with key:
# bpftrace -e 'k:vfs_read { @[probe]++ }'
Attaching 1 probe...
^C

@[kprobe:vfs_read]: 13369
数组访问[ ]
可以使用数组操作符[]访问一维常量数组;
整形强转
整形内部为uint64,可以强制修改为以下内置类型:
(u)int8,(u)int16,(u)int32,(u)int64:
# bpftrace -e 'BEGIN { $x = 1<<16; printf("%d %d\n", (uint16)$x, $x); }'
Attaching 1 probe...
0 65536
while循环
内核版本>=5.3,bpftrace支持while循环,循环可以使用continue和break来操作:
# bpftrace -e 'i:ms:100 { $i = 0; while ($i <= 100) { printf("%d ", $i); $i++} exit(); }'
提前结束:return
return关键字用于提前结束probe,而exit()则用于退出bpftrace(包含一个或多个probe)。
元组( ,)
使用.+index来访问元组,元组一经定义就不可以改变,同样也需要高版本内核支持:
# bpftrace -e 'BEGIN { $t = (1, 2, "string"); printf("%d %s\n", $t.1, $t.2); }'
Attaching 1 probe...
2 string
^C
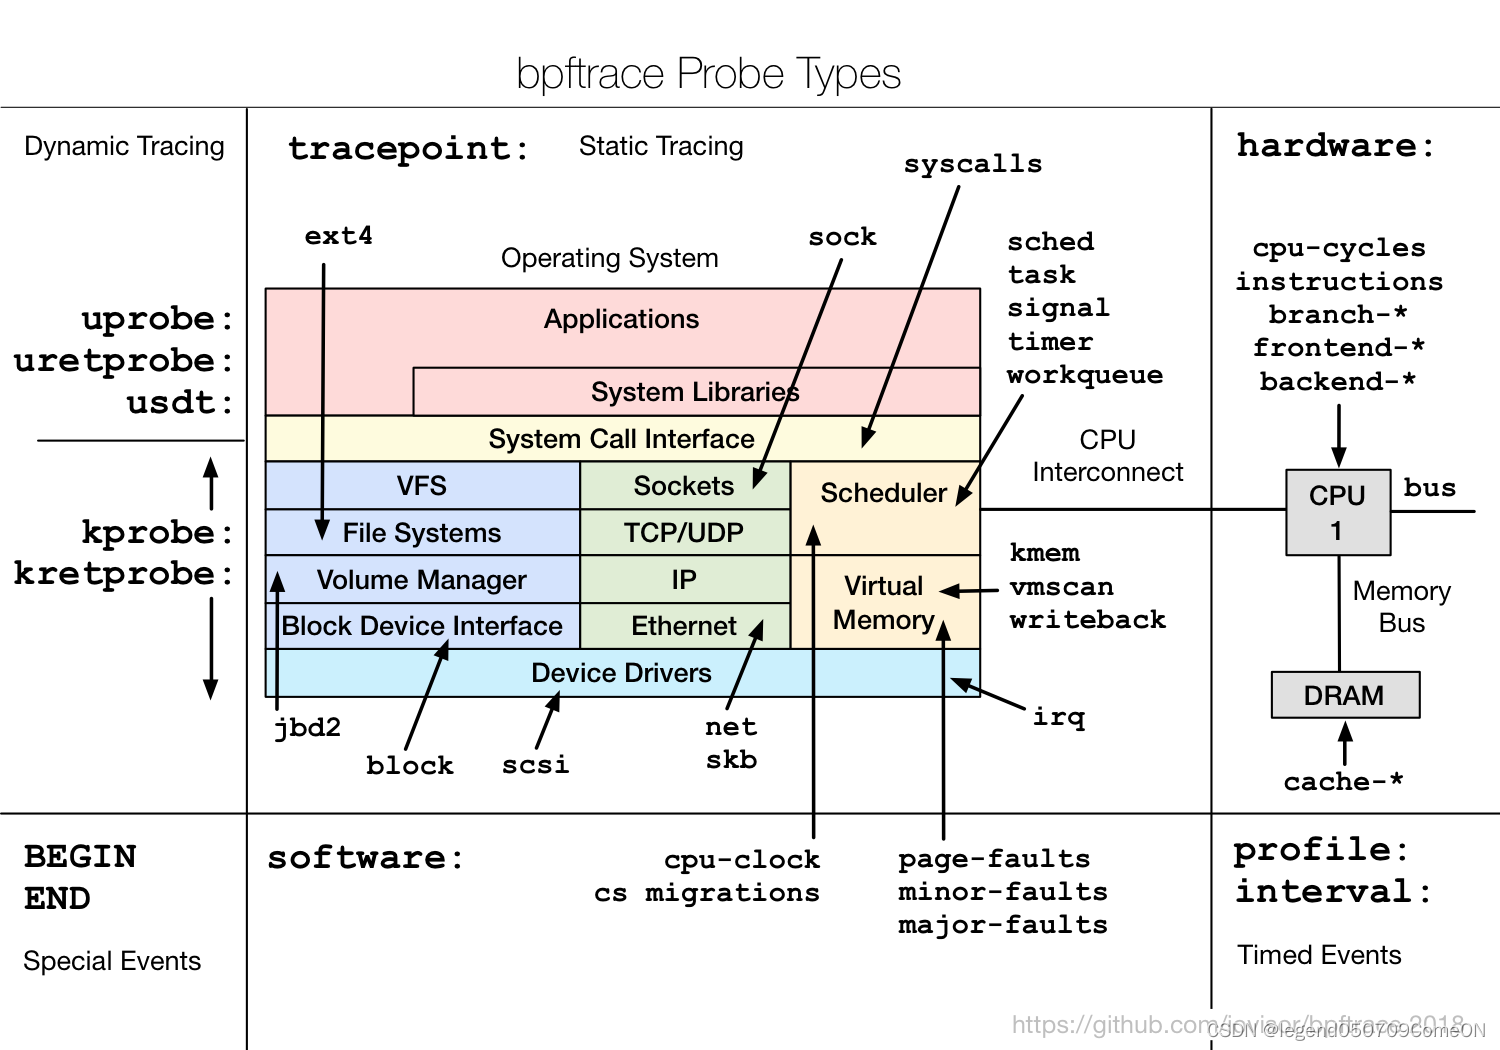
bpftrace的探针类型
kprobe - kernel function start
kretprobe - kernel function return
uprobe - user-level function start
uretprobe - user-level function return
tracepoint - kernel static tracepoints
usdt - user-level static tracepoints
profile - timed sampling
interval - timed output
software - kernel software events
hardware - processor-level events
kprobe/kretprobe
语法:
kprobe:function_name[ + offset]
kretprobe:function_name
使用了内核的kprobe能力(https://www.kernel.org/doc/Documentation/kprobes.txt),在进入函数时触发kprobe,函数退出时触发kretprobe。
对于probe类型探针,可以使用argN(从0开始)的方式来访问探测点参数,对于retprobe则使用retval来获取返回值。
kprobe: arg0, arg1, ..., argN
kretprobe: retval

arg0 is the first argument and can only be accessed with a kprobe.

retval is the return value for the instrumented function, and can only be accessed on kretprobe.
示例:
# bpftrace -e 'kprobe:do_nanosleep { printf("%s enter sleep\n", comm); }'
Attaching 1 probe...
dockerd enter sleep

# bpftrace -e 'kprobe:do_sys_open { printf("open flags: %d\n", arg2); }'
Attaching 1 probe...
open flags: 557056
open flags: 32768
[...]
# bpftrace -e 'kretprobe:do_sys_open { printf("returned: %d\n", retval); }'
Attaching 1 probe...
returned: 8
[...]
# bpftrace -e 'kprobe:do_sys_open { printf("opening: %s\n", str(arg1)); }'
Attaching 1 probe...
opening: /proc/cpuinfo
opening: /proc/stat
opening: /proc/diskstats
opening: /proc/stat
opening: /proc/vmstat
[...]

# bpftrace -e 'kprobe:do_sys_open { printf("open flags: %d\n", arg2); }'
Attaching 1 probe...
open flags: 557056
open flags: 32768
open flags: 32768
open flags: 32768
[...]


# bpftrace -e 'kretprobe:do_sys_open { printf("returned: %d\n", retval); }'
Attaching 1 probe...
returned: 8
returned: 21
returned: -2
returned: 21
[...]
也可以在probe函数内部使用偏移量:
# gdb -q /usr/lib/debug/boot/vmlinux-`uname -r` --ex 'disassemble do_sys_open'
Reading symbols from /usr/lib/debug/boot/vmlinux-5.0.0-32-generic...done.
Dump of assembler code for function do_sys_open:
   0xffffffff812b2ed0 <+0>:     callq  0xffffffff81c01820 <__fentry__>
   0xffffffff812b2ed5 <+5>:     push   %rbp
   0xffffffff812b2ed6 <+6>:     mov    %rsp,%rbp
   0xffffffff812b2ed9 <+9>:     push   %r15
...


# bpftrace -e 'kprobe:do_sys_open+9 { printf("in here\n"); }'
Attaching 1 probe...
in here
...
如果地址与指令边界和函数内的地址一致,则使用vmlinux(带调试符号)检查地址;如果bpftrace编译的时候使用了ALLOW_UNSAFE_PROBE选项,可以使用–unsafe选项来跳过此检查。
对于结构体的访问如下:
# cat path.bt
#!/usr/bin/bpftrace

#include <linux/path.h>
#include <linux/dcache.h>

kprobe:vfs_open
{
	printf("open path: %s\n", str(((struct path *)arg0)->dentry->d_name.name));
}
当内核支持BTF时,甚至不需要包含结构体的头文件。
uprobe/uretprobe
语法:
uprobe:library_name:function_name[+offset]
uprobe:library_name:address
uretprobe:library_name:function_name
- 使用了内核的uprobe特性,可以用objdump或者bpftrace -l来获取探测点。
# objdump -tT /bin/bash | grep readline
0000000000139220 g    DO .bss	0000000000000008  Base        rl_readline_state
00000000000c0b20 g    DF .text	0000000000000352  Base        readline_internal_char
00000000000bfe90 g    DF .text	000000000000019c  Base        readline_internal_setup
000000000008bf40 g    DF .text	000000000000009a  Base        posix_readline_initialize
#  bpftrace -l 'u:/bin/bash' | grep readline
uprobe:/bin/bash:initialize_readline
uprobe:/bin/bash:pcomp_set_readline_variables
uprobe:/bin/bash:posix_readline_initialize
uprobe:/bin/bash:readline
- uprobe也可以使用虚拟地址作为探测点:
# objdump -tT /bin/bash | grep main
000000000002fe90 g    DF .text	000000000000199e  Base        main
# bpftrace -e 'uprobe:/bin/bash:0x2fe90 { printf("main called!\n"); }'
Attaching 1 probe...
main called!
main called!
main called!
main called!
main called!
main called!
- 也可以使用探测点加上偏移的方式:
# objdump -d /bin/bash
...
000000000002ec00 <main@@Base>:
   2ec00:       f3 0f 1e fa             endbr64
   2ec04:       41 57                   push   %r15
   2ec06:       41 56                   push   %r14
   2ec08:       41 55                   push   %r13
   ...
# bpftrace -e 'uprobe:/bin/bash:main+4 { printf("in here\n"); }'
Attaching 1 probe...
...
地址的对齐会通过指令边界进行检查,如果不对齐,将会probe将会添加失败,如果bpftrace编译时使用了ALLOW_UNSAFE_PROBE选项,也可以使用–unsafe选项来跳过此检查。
# bpftrace -e 'uprobe:/bin/bash:main+1 { printf("in here\n"); }'
Attaching 1 probe...
Could not add uprobe into middle of instruction: /bin/bash:main+1
# bpftrace -e 'uprobe:/bin/bash:main+1 { printf("in here\n"); } --unsafe'
Attaching 1 probe...
Unsafe uprobe in the middle of the instruction: /bin/bash:main+1
使用–unsafe选项,还可以在任意地址上放置uprobes。当二进制文件被strip时,这可能会派上用场。
$ echo 'int main(){return 0;}' | gcc -xc -o bin -
$ nm bin | grep main
...
0000000000001119 T main
...
$ strip bin
# bpftrace --unsafe -e 'uprobe:bin:0x1119 { printf("main called\n"); }'
Attaching 1 probe...
WARNING: could not determine instruction boundary for uprobe:bin:4377 (binary appears stripped). Misaligned probes can lead to tracee crashes!
- bfptrace 查看库函数.
库的名称不需要指定全路径,因为 /etc/ld.so.cache 会启动解决全路径的问题。
# bpftrace -e 'uprobe:libc:malloc { printf("Allocated %d bytes\n", arg0); }'
Allocated 4 bytes
...
- uprobe/ureprobe的参数
语法:
uprobe: arg0, arg1, ..., argN
uretprobe: retval

arg0 is the first argument, and can only be accessed with a uprobe.

retval is the return value for the instrumented function, and can only be accessed on uretprobe.
范例:
# bpftrace -e 'uprobe:/bin/bash:readline { printf("arg0: %d\n", arg0); }'
Attaching 1 probe...
arg0: 19755784
arg0: 19755016
arg0: 19755784
^C

# bpftrace -e 'uprobe:/lib/x86_64-linux-gnu/libc-2.23.so:fopen { printf("fopen: %s\n", str(arg0)); }'
Attaching 1 probe...
fopen: /proc/filesystems
fopen: /usr/share/locale/locale.alias
fopen: /proc/self/mountinfo
^C

# bpftrace -e 'uretprobe:/bin/bash:readline { printf("readline: \"%s\"\n", str(retval)); }'
Attaching 1 probe...
readline: "echo hi"
readline: "ls -l"
readline: "date"
readline: "uname -r"
^C
- 如果被追踪的二进制文件含有 DWARF 变量,是可以使用 通过名称直接访问 uprobe的 追踪对象的。
语法:
uprobe: args->NAME

比如:
# bpftrace -lv 'uprobe:/bin/bash:rl_set_prompt'
uprobe:/bin/bash:rl_set_prompt
    const char* prompt


# bpftrace -e 'uprobe:/bin/bash:rl_set_prompt { printf("prompt: %s\n", str(args->prompt)); }'
Attaching 1 probe...
prompt: [user@localhost ~]$
^C
tracepoint
使用了内核的静态探测点,对于参数的访问方式为args->
# bpftrace -e 'tracepoint:syscalls:sys_enter_openat { printf("%s %s\n", comm, str(args->filename)); }'
Attaching 1 probe...
vmware-vmx /proc/meminfo
每个跟踪点可用的成员可以在/sys目录下进行查看 或者 通过 bpftrace -vl tracepoint:xxxxx 来查看:
# cat /sys/kernel/debug/tracing/events/syscalls/sys_enter_openat/format
name: sys_enter_openat
ID: 622
format:
        field:unsigned short common_type;       offset:0;       size:2; signed:0;
        field:unsigned char common_flags;       offset:2;       size:1; signed:0;
        field:unsigned char common_preempt_count;       offset:3;       size:1; signed:0;
        field:int common_pid;   offset:4;       size:4; signed:1;

        field:int __syscall_nr; offset:8;       size:4; signed:1;
        field:int dfd;  offset:16;      size:8; signed:0;
        field:const char * filename;    offset:24;      size:8; signed:0;
        field:int flags;        offset:32;      size:8; signed:0;
        field:umode_t mode;     offset:40;      size:8; signed:0;

print fmt: "dfd: 0x%08lx, filename: 0x%08lx, flags: 0x%08lx, mode: 0x%08lx", ((unsigned long)(REC->dfd)), ((unsigned long)(REC->filename)), ((unsigned long)(REC->flags)), ((unsigned long)(REC->mode))
usdt
USDT(user-level statically defined tracing),提供了用户空间版的跟踪点机制,linux对USDT的支持,最早来自于SytemTap项目的跟踪器;给用户程序添加USDT探针,有两种可选方式:
1)使用systemtap-sdt-dev包提供的头文件和工具
2)使用Facebook的Folly C++库
为应用程序添加USDT后,可使用bpftrace对跟踪点进行探测,语法:
usdt:binary_path:probe_name
usdt:binary_path:[probe_namespace]:probe_name
usdt:library_path:probe_name
usdt:library_path:[probe_namespace]:probe_name
如果探测名称是唯一的,也可以省略探测命名空间。
参数使用argN进行访问:
# bpftrace -e 'usdt:/root/tick:loop { printf("%s: %d\n", str(arg0), arg1); }'
my string: 1
my string: 2
my string: 3
my string: 4
my string: 5
^C

# bpftrace -e 'usdt:/root/tick:loop /arg1 > 2/ { printf("%s: %d\n", str(arg0), arg1); }'
my string: 3
my string: 4
my string: 5
my string: 6
^C
profile
使用profile进行事件采样:
profile:hz:rate
profile:s:rate
profile:ms:rate
profile:us:rate
profile使用了perf_events能力,如:
# bpftrace -e 'profile:hz:99 { @[tid] = count(); }'
Attaching 1 probe...
^C

@[1280]: 1
@[866]: 1
@[58278]: 1
interval
语法:
interval:ms:rate
interval:s:rate
interval:us:rate
interval:hz:rate
这只在一个CPU上启动,并可用于生成每间隔的输出,如每秒输出系统调用的数量:
# bpftrace -e 'tracepoint:raw_syscalls:sys_enter { @syscalls = count(); } interval:s:1 { print(@syscalls); clear(@syscalls); }'
Attaching 2 probes...
@syscalls: 18141

@syscalls: 34272

@syscalls: 48646
software
语法:
software:event_name:count
software:event_name:
这些是Linux内核提供的预定义软件事件,通常通过perf实用程序进行跟踪。它们类似于跟踪点,但只有十几个,记录在perf_event_open(2)手册页中。事件名称如下:
- cpu-clock或cpu:报告CPU时钟,per-cpu的高分辨率定时器
- task-clock:指定正在运行的任务的时钟计数
- page-faults or faults:报告触发缺页异常的次数
- context-switches or cs:上下文切换,被报告为在内核发生的用户空间事件
- cpu-migrations:报告进程迁移CPU的次数
- minor-faults:报告小缺页中断(触发pagefault时,vma对应的地址空间存在disk中)的次数,不会上报磁盘I/O的情况
- major-faults:报告大缺页中断(触发pagefault时,vma对应的地址空间已经被内核加载到了Page Cache中)的次数
- alignment-faults:报告对齐异常的数量,某些架构支持,当发生未对齐的内存访问时触发
- emulation-faults:统计方针异常的数量,内核有时会捕获未实现的指令,并在用户空间模拟它们
- dummy:一个不重要的占位事件,允许在不需要计数事件的情况下收集此类记录
- bpf-output
下例对每一百个缺页异常的进程名称进行采样:
# bpftrace -e 'software:faults:100 { @[comm] = count(); }'
Attaching 1 probe...
^C

@[QThread]: 1
@[ping]: 1
hardware
语法:
hardware:event_name:count
hardware:event_name:
Linux内核提供的预定义硬件事件,通常由perf实用程序跟踪。它们是使用性能监视计数器(PMC)实现的:处理器上的硬件资源。记录在perf_event_open(2)手册页(https://man7.org/linux/man-pages/man2/perf_event_open.2.html)中,事件名称如下:
- cpu-cycles or cycles
- instructions
- cache-references
- cache-misses
- branch-instructions or branches
- branch-misses
- bus-cycles
- frontend-stalls
- backend-stalls
- ref-cycles
# bpftrace -e 'hardware:cache-misses:1000000 { @[pid] = count(); }'
Attaching 1 probe...
^C

@[7679]: 1
@[2662]: 1
@[400842]: 1
BEGIN/END:内置事件
语法:
BEGIN
END
These are special built-in events provided by the bpftrace runtime. BEGIN is triggered before all other probes are attached. END is triggered after all other probes are detached.
# cat vfscount.bt

#!/usr/bin/env bpftrace

BEGIN
{
	printf("Tracing VFS calls... Hit Ctrl-C to end.\n");

}

kprobe:vfs_*
{
	@[func] = count();
}
watchpoint/asyncwatchpoint
语法:
watchpoint:absolute_address:length:mode
watchpoint:function+argN:length:mode

mode:
    r: read
    w: write:
    x: execute
内存观测点:当前是实验性质的,接口可能会发生更改。
These are memory watchpoints provided by the kernel. Whenever a memory address is written to (w), read from ®, or executed (x), the kernel can generate an event.
Note that on most architectures you may not monitor for execution while monitoring read or write.
In the first form, an absolute address is monitored. If a pid (-p) or a command (-c) is provided, bpftrace takes the address as a userspace address and monitors the appropriate process. If not, bpftrace takes the address as a kernel space address.
范例:
bpftrace -e 'watchpoint:0x10000000:8:rw { printf("hit!\n"); exit(); }' -c ./testprogs/watchpoint
In the second form, the address present in argN (see uprobe arguments) when function is entered is monitored. A pid or command must be provided for this form. If synchronous (watchpoint), a SIGSTOP is sent to the tracee upon function entry. The tracee will be SIGCONTd after the watchpoint is attached. This is to ensure events are not missed. If you want to avoid the SIGSTOP + SIGCONT use asyncwatchpoint.
# bpftrace -e "watchpoint:0x$(awk '$3 == "jiffies" {print $1}' /proc/kallsyms):8:w {@[kstack] = count();}"
Attaching 1 probe...
^C
......
@[
    do_timer+12
    tick_do_update_jiffies64.part.22+89
    tick_sched_do_timer+103
    tick_sched_timer+39
    __hrtimer_run_queues+256
    hrtimer_interrupt+256
    smp_apic_timer_interrupt+106
    apic_timer_interrupt+15
    cpuidle_enter_state+188
    cpuidle_enter+41
    do_idle+536
    cpu_startup_entry+25
    start_secondary+355
    secondary_startup_64+164
]: 319
# cat wpfunc.c
#include <stdio.h>
#include <stdlib.h>
#include <unistd.h>

__attribute__((noinline))
void increment(__attribute__((unused)) int _, int *i)
{
  (*i)++;
}

int main()
{
  int *i = malloc(sizeof(int));
  while (1)
  {
    increment(0, i);
    (*i)++;
    usleep(1000);
  }
}

# bpftrace -e 'watchpoint:increment+arg1:4:w { printf("hit!\n"); exit() }' -c ./wpfunc
kfunc/kretfunc
语法:
kfunc[:module]:function
kretfunc[:module]:function

参数:
kfunc[:module]:function      args->NAME  ...
kretfunc[:module]:function   args->NAME ... retval
If no kernel module is given, all loaded modules are searched for the given function.
# bpftrace -l
...
kfunc:vmlinux:ksys_ioperm
kfunc:vmlinux:ksys_unshare
kfunc:vmlinux:ksys_setsid
kfunc:vmlinux:ksys_sync_helper
kfunc:vmlinux:ksys_fadvise64_64
kfunc:vmlinux:ksys_readahead
kfunc:vmlinux:ksys_mmap_pgoff
...

# bpftrace -lv
...
kfunc:fget
    unsigned int fd;
    struct file * retval;
...
范例:
# bpftrace -e 'kfunc:x86_pmu_stop { printf("pmu %s stop\n", str(args->event->pmu->name)); }'
# bpftrace -e 'kretfunc:fget { printf("fd %d name %s\n", args->fd, str(retval->f_path.dentry->d_name.name));  }'
# bpftrace -e 'kfunc:kvm:x86_emulate_insn { @ = count(); }'

# bpftrace -e 'kfunc:fget { printf("fd %d\n", args->fd);  }'
Attaching 1 probe...
fd 3
fd 3
...

# bpftrace -e 'kretfunc:fget { printf("fd %d name %s\n", args->fd, str(retval->f_path.dentry->d_name.name));  }'
Attaching 1 probe...
fd 3 name ld.so.cache
fd 3 name libselinux.so.1
fd 3 name libselinux.so.1
...
bpftrace的变量
内置变量
pid - 进程号(kernel tgid)
tid - 线程号 (kernel pid)
uid - 用户ID
gid - 组ID
nsecs - 纳秒时间戳
elapsed - 自bpftrace初始化流逝的纳秒数
cpu - 处理器编号
comm - 进程名称
kstack - 内核栈回溯
ustack - 用户栈回溯
arg0, arg1, …, argN. - 跟踪函数的参数
sarg0, sarg1, …, sargN. - 跟踪函数的参数 (for programs that store arguments on the stack); assumed to be 64 bits wide
retval - 被跟踪函数的返回值
func - 被跟踪函数的名称
probe - 跟踪点全名
curtask - 当前的task_struct(u64)
rand - 随机数(u32)
cgroup - 当前进程的cgroup ID
cpid - Child pid(u32),仅-c command使用时有效
$1, $2, …, $N, $#. bpftrace程序的入参变量
基本变量: @、$
@全局变量
@线程局部变量[tid]
$临时变量
- 全局变量
Syntax: @name
For example, @start:

# bpftrace -e 'BEGIN { @start = nsecs; }
    kprobe:do_nanosleep /@start != 0/ { printf("at %d ms: sleep\n", (nsecs - @start) / 1000000); }'
Attaching 2 probes...
at 42 ms: sleep
at 43 ms: sleep
at 314 ms: sleep
^C

@start: 601563424957305
- 线程局部变量 ((via BPF maps))
These can be implemented as an associative array keyed on the thread ID. For example, @start[tid]:
# bpftrace -e 'kprobe:do_nanosleep { @start[tid] = nsecs; }
    kretprobe:do_nanosleep /@start[tid] != 0/ {
        printf("slept for %d ms\n", (nsecs - @start[tid]) / 1000000); delete(@start[tid]); }'
Attaching 2 probes...
slept for 1000 ms
slept for 1000 ms
slept for 1000 ms
slept for 1009 ms
slept for 2002 ms
[...]
- 临时变量
Syntax: $name
For example, $delta:


# bpftrace -e 'kprobe:do_nanosleep { @start[tid] = nsecs; }
    kretprobe:do_nanosleep /@start[tid] != 0/ { $delta = nsecs - @start[tid];
        printf("slept for %d ms\n", $delta / 1000000); delete(@start[tid]); }'
Attaching 2 probes...
slept for 1000 ms
slept for 1000 ms
slept for 1000 ms
关联数组@[ ]
语法:
@关联数组名[key_name] = value
@关联数组名[key_name, key_name2, ...] = value
都是使用bpf map实现的,如@start[tid]。
# bpftrace -e 'kprobe:do_nanosleep { @start[tid] = nsecs; }
    kretprobe:do_nanosleep /@start[tid] != 0/ {
        printf("slept for %d ms\n", (nsecs - @start[tid]) / 1000000); delete(@start[tid]); }'
Attaching 2 probes...
slept for 1000 ms
slept for 1000 ms
slept for 1000 ms
[...]

# bpftrace -e 'BEGIN { @[1,2] = 3; printf("%d\n", @[1,2]); clear(@); }'
Attaching 1 probe...
3
^C
时间戳nsecs
Syntax: nsecs
These are implemented using bpf_ktime_get_ns().
# bpftrace -e 'BEGIN { @start = nsecs; }
    kprobe:do_nanosleep /@start != 0/ { printf("at %d ms: sleep\n", (nsecs - @start) / 1000000); }'
Attaching 2 probes...
at 437 ms: sleep
at 647 ms: sleep
at 1098 ms: sleep
at 1438 ms: sleep
^C
kstack
Syntax: kstack
This builtin is an alias to kstack().
# bpftrace -e 'kprobe:ip_output { @[kstack] = count(); }'
Attaching 1 probe...
[...]
@[
    ip_output+1
    tcp_transmit_skb+1308
    tcp_write_xmit+482
    tcp_release_cb+225
    release_sock+64
    tcp_sendmsg+49
    sock_sendmsg+48
    sock_write_iter+135
    __vfs_write+247
    vfs_write+179
    sys_write+82
    entry_SYSCALL_64_fastpath+30
]: 1708
@[
    ip_output+1
    tcp_transmit_skb+1308
    tcp_write_xmit+482
    __tcp_push_pending_frames+45
    tcp_sendmsg_locked+2637
    tcp_sendmsg+39
    sock_sendmsg+48
    sock_write_iter+135
    __vfs_write+247
    vfs_write+179
    sys_write+82
    entry_SYSCALL_64_fastpath+30
]: 9048
@[
    ip_output+1
    tcp_transmit_skb+1308
    tcp_write_xmit+482
    tcp_tasklet_func+348
    tasklet_action+241
    __do_softirq+239
    irq_exit+174
    do_IRQ+74
    ret_from_intr+0
    cpuidle_enter_state+159
    do_idle+389
    cpu_startup_entry+111
    start_secondary+398
    secondary_startup_64+165
]: 11430
ustack
Syntax: ustack
This builtin is an alias to ustack().
# bpftrace -e 'kprobe:do_sys_open /comm == "bash"/ { @[ustack] = count(); }'
Attaching 1 probe...
^C

@[
    __open_nocancel+65
    command_word_completion_function+3604
    rl_completion_matches+370
    bash_default_completion+540
    attempt_shell_completion+2092
    gen_completion_matches+82
    rl_complete_internal+288
    rl_complete+145
    _rl_dispatch_subseq+647
    _rl_dispatch+44
    readline_internal_char+479
    readline_internal_charloop+22
    readline_internal+23
    readline+91
    yy_readline_get+152
    yy_readline_get+429
    yy_getc+13
    shell_getc+469
    read_token+251
    yylex+192
    yyparse+777
    parse_command+126
    read_command+207
    reader_loop+391
    main+2409
    __libc_start_main+231
    0x61ce258d4c544155
]: 9
@[
    __open_nocancel+65
    command_word_completion_function+3604
    rl_completion_matches+370
    bash_default_completion+540
    attempt_shell_completion+2092
    gen_completion_matches+82
    rl_complete_internal+288
    rl_complete+89
    _rl_dispatch_subseq+647
    _rl_dispatch+44
    readline_internal_char+479
    readline_internal_charloop+22
    readline_internal+23
    readline+91
    yy_readline_get+152
    yy_readline_get+429
    yy_getc+13
    shell_getc+469
    read_token+251
    yylex+192
    yyparse+777
    parse_command+126
    read_command+207
    reader_loop+391
    main+2409
    __libc_start_main+231
    0x61ce258d4c544155
]: 18
位置参数
格式: $1, 2 , . . . , 2,..., 2,...,N,$#
- bpftrace程序的位置参数,也称为命令行参数。如果参数(完全)是数字,则可以将其用作数字。否则必须在str()调用中用作字符串。如果使用了未提供的参数,则数字上下文默认为零,字符串上下文默认为“”。位置参数也可以在探测参数中使用,并将被视为字符串参数。
- 如果在str()中使用位置参数,它将被解释为指向实际给定字符串文字的指针,从而允许对其执行指针算术。只允许添加一个小于或等于所提供字符串长度的常数
- 这允许编写使用基本参数来更改其行为的脚本。如果开发的脚本需要更复杂的参数处理,那么它可能更适合bcc,bcc支持Python的argparse和完全自定义的参数处理。
在一行程序中使用位置参数:
#!/usr/local/bin/bpftrace

BEGIN
{
	printf("Tracing block I/O sizes > %d bytes\n", $1);
}

tracepoint:block:block_rq_issue
/args->bytes > $1/
{
	@ = hist(args->bytes);
}
bpftrace的 函数
内置函数
printf(char *fmt, …) - 格式化打印
time(char *fmt) - 格式化打印时间
join(char *arr[] [, char *delim]) - 打印字符串数组
str(char *s [, int length]) - 返回指向s的字符串指针
ksym(void *p) - 解析内核地址
usym(void *p)- 解析用户空间地址
kaddr(char *name) - 解析内核符号  //kernel addresss
uaddr(char *name) - 解析用户空间符号  //user address
reg(char *name) - 返回存储在指定寄存器上的值
system(char *fmt) - 执行系统命令
exit() - 退出bpftrace
cgroupid(char *path) - 解析cgroupID
kstack([StackMode mode, ][int level]) - 内核栈回溯
ustack([StackMode mode, ][int level]) - 用户栈回溯
ntop([int af, ]int|char[4|16] addr) - 将ip地址转换为文本
cat(char *filename) - 打印文件内容
signal(char[] signal | u32 signal) - 给当前进程发送信号
strncmp(char *s1, char *s2, int length) - 比较两个字符串的前n个字节
override(u64 rc) - 重写返回值
buf(void *d [, int length]) - 返回d指向的16进制内容
sizeof(…) - 返回一个类型或语句的尺寸Return size of a type or expression
print(…) - 使用默认格式打印一个非map的值
strftime(char *format, int nsecs) - 返回格式化的时间戳
path(struct path *path) - 返回完整路径
uptr(void *p) - 注释为用户空间指针
kptr(void *p) - 注释为内核空间指针
macaddr(char[6] addr) - 转换mac地址
printf():格式化打印
Syntax: printf(fmt, args)
类似于C风格的打印函数:
# bpftrace -e 'tracepoint:syscalls:sys_enter_execve { printf("%s called %s\n", comm, str(args->filename)); }'
Attaching 1 probe...
bash called /bin/ls
bash called /usr/bin/man
man called /apps/nflx-bash-utils/bin/preconv
man called /usr/local/sbin/preconv
man called /usr/local/bin/preconv
man called /usr/sbin/preconv
man called /usr/bin/preconv
man called /apps/nflx-bash-utils/bin/tbl
[...]
time():打印时间
使用指定格式打印时间;
# bpftrace -e 'kprobe:do_nanosleep { time("%H:%M:%S\n"); }'
07:11:03
07:11:09
^C
join():打印字符串数组
语法:
join(char *arr[] [, char *delim])
join()会将字符串数组与一个空格字符连接起来,并将其打印出来,以分隔符分隔。默认的分隔符(如果没有提供)是空格字符。当前版本不返回字符串,因此不能在printf()中用作参数。
# bpftrace -e 'tracepoint:syscalls:sys_enter_execve { join(args->argv); }'
Attaching 1 probe...
ls --color=auto
man ls
preconv -e UTF-8
preconv -e UTF-8
preconv -e UTF-8
preconv -e UTF-8
preconv -e UTF-8
tbl
[...]


# bpftrace -e 'tracepoint:syscalls:sys_enter_execve { join(args->argv, ","); }'
Attaching 1 probe...
ls,--color=auto
man,ls
preconv,-e,UTF-8
preconv,-e,UTF-8
preconv,-e,UTF-8
preconv,-e,UTF-8
preconv,-e,UTF-8
tbl
[...]
str():打印字符串
语法:
str(char *s, [int length])
返回字符串指针,length参数可选,用于限制s的长度;字符串默认长度为64,可使用BPFTRACE_STRLEN环境变量进行更改;
# bpftrace -e 'tracepoint:syscalls:sys_enter_execve { printf("%s called %s\n", comm, str(args->filename)); }'
Attaching 1 probe...
bash called /bin/ls
bash called /usr/bin/man
man called /apps/nflx-bash-utils/bin/preconv
man called /usr/local/sbin/preconv
man called /usr/local/bin/preconv
man called /usr/sbin/preconv
man called /usr/bin/preconv
man called /apps/nflx-bash-utils/bin/tbl
[...]
ksym()
kernel Symbol 语法:
ksym(addr)
# bpftrace -e 'kprobe:do_nanosleep { printf("%s\n", ksym(reg("ip"))); }'
Attaching 1 probe...
do_nanosleep
do_nanosleep
usym()
user Symbol 语法:
usym(addr)
# bpftrace -e 'uprobe:/bin/bash:readline { printf("%s\n", usym(reg("ip"))); }'
Attaching 1 probe...
readline
readline
readline
^C
uaddr()
uaddr函数返回指定符号的地址,在程序编译期间查找符号,不能动态使用。
格式:
u64 *uaddr(symbol) (default)
u64 *uaddr(symbol)
u32 *uaddr(symbol)
u16 *uaddr(symbol)
u8 *uaddr(symbol)
支持的探针类型:u(ret)probe、USDT。
This is printing the ps1_prompt string from /bin/bash, whenever a readline() function is executed.
# bpftrace -e 'uprobe:/bin/bash:readline { printf("PS1: %s\n", str(*uaddr("ps1_prompt"))); }'
Attaching 1 probe...
PS1: \[\e[34;1m\]\u@\h:\w>\[\e[0m\]
PS1: \[\e[34;1m\]\u@\h:\w>\[\e[0m\]
^C
reg()
格式:
reg(char *name)
# bpftrace -e 'kprobe:tcp_sendmsg { @[ksym(reg("ip"))] = count(); }'
Attaching 1 probe...
^C

@[tcp_sendmsg]: 7
system()
格式:
system(fmt)
让bpftrace执行一个系统命令,此行为不安全,因此使用时需要指定–unsafe选项:
# bpftrace --unsafe -e 'kprobe:do_nanosleep { system("ps -p %d\n", pid); }'
Attaching 1 probe...
  PID TTY          TIME CMD
 1339 ?        00:00:15 iscsid
  PID TTY          TIME CMD
 1339 ?        00:00:15 iscsid
  PID TTY          TIME CMD
 1518 ?        00:01:07 irqbalance
  PID TTY          TIME CMD
 1339 ?        00:00:15 iscsid
^C
exit()
退出bpftrace,可以与interval间隔探针相结合,以记录特定持续时间内的统计信息:
# bpftrace -e 'kprobe:do_sys_open { @opens = count(); } interval:s:1 { exit(); }'
Attaching 2 probes...
@opens: 119
ntop()
格式:
ntop([int af, ]int|char[4|16] addr)
返回字符串格式的ipv4/ipv6地址。
bpftrace -e 'tracepoint:tcp:tcp_set_state { printf("%s\n", ntop(args->daddr_v6)) }'
Attaching 1 probe...
::ffff:216.58.194.164
::ffff:216.58.194.164
::ffff:216.58.194.164
::ffff:216.58.194.164
::ffff:216.58.194.164


bpftrace -e '#include <linux/socket.h>
BEGIN { printf("%s\n", ntop(AF_INET, 0x0100007f));}'
127.0.0.1
^C
pton()
格式:
pton(const string *addr)
将ipv4/ipv6字符串格式的地址转化为字节数组(byte array)。
# bpftrace -e 'tracepoint:tcp:tcp_retransmit_skb {
  if (args->daddr_v6[0] == pton("::1")[0]) {
    printf("first octet matched\n");
  }
}'
Attaching 1 probe...
first octet matched
^C

# bpftrace -e 'tracepoint:tcp:tcp_retransmit_skb {
  if (args->daddr[0] == pton("127.0.0.1")[0]) {
    printf("first octet matched\n");
  }
}'
Attaching 1 probe...
first octet matched
^C
kstack()
格式:
kstack([StackMode mode, ][int limit])
# bpftrace -e 'kprobe:ip_output { @[kstack()] = count(); }'
Attaching 1 probe...
[...]
@[
    ip_output+1
    tcp_transmit_skb+1308
    tcp_write_xmit+482
    tcp_release_cb+225
    release_sock+64
    tcp_sendmsg+49
    sock_sendmsg+48
    sock_write_iter+135
    __vfs_write+247
    vfs_write+179
    sys_write+82
    entry_SYSCALL_64_fastpath+30
]: 1708
@[
    ip_output+1
    tcp_transmit_skb+1308
    tcp_write_xmit+482
    __tcp_push_pending_frames+45
    tcp_sendmsg_locked+2637
    tcp_sendmsg+39
    sock_sendmsg+48
    sock_write_iter+135
    __vfs_write+247
    vfs_write+179
    sys_write+82
    entry_SYSCALL_64_fastpath+30
]: 9048
@[
    ip_output+1
    tcp_transmit_skb+1308
    tcp_write_xmit+482
    tcp_tasklet_func+348
    tasklet_action+241
    __do_softirq+239
    irq_exit+174
    do_IRQ+74
    ret_from_intr+0
    cpuidle_enter_state+159
    do_idle+389
    cpu_startup_entry+111
    start_secondary+398
    secondary_startup_64+165
]: 11430
- Sampling only three frames from the stack (limit = 3):
# bpftrace -e 'kprobe:ip_output { @[kstack(3)] = count(); }'
Attaching 1 probe...
[...]
@[
    ip_output+1
    tcp_transmit_skb+1308
    tcp_write_xmit+482
]: 22186
- Available formats are bpftrace and perf
# bpftrace -e 'kprobe:do_mmap { @[kstack(perf)] = count(); }'
Attaching 1 probe...
[...]
@[
	ffffffffb4019501 do_mmap+1
	ffffffffb401700a sys_mmap_pgoff+266
	ffffffffb3e334eb sys_mmap+27
	ffffffffb3e03ae3 do_syscall_64+115
	ffffffffb4800081 entry_SYSCALL_64_after_hwframe+61

]: 22186

# bpftrace -e 'kprobe:do_mmap { @[kstack(perf, 3)] = count(); }'
Attaching 1 probe...
[...]
@[
	ffffffffb4019501 do_mmap+1
	ffffffffb401700a sys_mmap_pgoff+266
	ffffffffb3e334eb sys_mmap+27

]: 22186
ustack()
格式:
ustack([StackMode mode, ][int limit])
# bpftrace -e 'kprobe:do_sys_open /comm == "bash"/ { @[ustack()] = count(); }'
Attaching 1 probe...
^C

@[
    __open_nocancel+65
    command_word_completion_function+3604
    rl_completion_matches+370
    bash_default_completion+540
    attempt_shell_completion+2092
    gen_completion_matches+82
    rl_complete_internal+288
    rl_complete+145
    _rl_dispatch_subseq+647
    _rl_dispatch+44
    readline_internal_char+479
    readline_internal_charloop+22
    readline_internal+23
    readline+91
    yy_readline_get+152
    yy_readline_get+429
    yy_getc+13
    shell_getc+469
    read_token+251
    yylex+192
    yyparse+777
    parse_command+126
    read_command+207
    reader_loop+391
    main+2409
    __libc_start_main+231
    0x61ce258d4c544155
]: 9
@[
    __open_nocancel+65
    command_word_completion_function+3604
    rl_completion_matches+370
    bash_default_completion+540
    attempt_shell_completion+2092
    gen_completion_matches+82
    rl_complete_internal+288
    rl_complete+89
    _rl_dispatch_subseq+647
    _rl_dispatch+44
    readline_internal_char+479
    readline_internal_charloop+22
    readline_internal+23
    readline+91
    yy_readline_get+152
    yy_readline_get+429
    yy_getc+13
    shell_getc+469
    read_token+251
    yylex+192
    yyparse+777
    parse_command+126
    read_command+207
    reader_loop+391
    main+2409
    __libc_start_main+231
    0x61ce258d4c544155
]: 18
signal():向当前进程发送一个信号
语法:
Syntax:
signal(u32 signal)
signal("SIG")
- 内核版本>=5.3
- 支持的探针类型:k(ret)probes,u(ret)probes,USDT,profile
# bpftrace  -e 'kprobe:__x64_sys_execve /comm == "bash"/ { signal(5); }' --unsafe
$ ls
Trace/breakpoint trap (core dumped)
strncmp():字符串比较
格式:
strncmp(char *s1, char *s2, int length)
同C语法格式,如果两个字符串的前n个字节相同,则返回0,否则返回非0:
pftrace -e 't:syscalls:sys_enter_* /strncmp("mpv", comm, 3) == 0/ { @[comm, probe] = count() }'
Attaching 320 probes...
[...]
@[mpv/vo, tracepoint:syscalls:sys_enter_rt_sigaction]: 238
@[mpv:gdrv0, tracepoint:syscalls:sys_enter_futex]: 680
@[mpv/ao, tracepoint:syscalls:sys_enter_write]: 1022
@[mpv, tracepoint:syscalls:sys_enter_ioctl]: 2677
@[mpv:cs0, tracepoint:syscalls:sys_enter_ioctl]: 2889
@[mpv/vo, tracepoint:syscalls:sys_enter_read]: 2993
@[mpv/demux, tracepoint:syscalls:sys_enter_futex]: 4745
@[mpv, tracepoint:syscalls:sys_enter_write]: 6936
@[mpv/vo, tracepoint:syscalls:sys_enter_futex]: 7662
@[mpv:cs0, tracepoint:syscalls:sys_enter_futex]: 8127
@[mpv/lua script , tracepoint:syscalls:sys_enter_futex]: 10150
@[mpv/vo, tracepoint:syscalls:sys_enter_poll]: 10241
@[mpv/vo, tracepoint:syscalls:sys_enter_recvmsg]: 15018
@[mpv, tracepoint:syscalls:sys_enter_getpid]: 31178
@[mpv, tracepoint:syscalls:sys_enter_futex]: 403868
override():重写返回值
格式:
override(u64 rc)
- 内核版本>=4.16
- 探针类型: kprobes
该特性需要内核配置了CONFIG_BPF_KPROBE_OVERRIDE选项,并且目标函数使用ALLOW_ERROR_INJECTION标签,bpftrace不测试被探测函数是否允许错误注入,而是测试是否无法将程序加载到内核。
sizeof()
语法:
sizeof(TYPE)
sizeof(EXPRESSION)
# bpftrace -e 'struct Foo { int x; char c; } BEGIN { printf("%d\n", sizeof(struct Foo)); }'
Attaching 1 probe...
8

# bpftrace -e 'struct Foo { int x; char c; } BEGIN { printf("%d\n", sizeof(((struct Foo*)0)->c)); }'
Attaching 1 probe...
1

# bpftrace -e 'BEGIN { printf("%d\n", sizeof(1 == 1)); }'
Attaching 1 probe...
8

# bpftrace -e 'BEGIN { printf("%d\n", sizeof(struct task_struct)); }'
Attaching 1 probe...
13120

# bpftrace -e 'BEGIN { $x = 3; printf("%d\n", sizeof($x)); }'
Attaching 1 probe...
8
print()
使用print打印一个非map变量,如大多数的内置变量和局部变量:
# bpftrace -e 'BEGIN { $t = (1, "string"); print(123); print($t); print(comm) }'
Attaching 1 probe...
123
(1, string)
bpftrace
^C
strftime()
语法:
strftime(const char *format, int nsecs)
返回一个可使用printf打印的格式化时间戳,此时间戳的格式必须被strftime所支持(并不是在内核bpf程序中返回,而是用户空间的时间)。nsecs参数为自启动以来的纳秒数。

# bpftrace -e 'i:s:1 { printf("%s\n", strftime("%H:%M:%S", nsecs)); }'
Attaching 1 probe...
13:11:22
13:11:23
13:11:24
13:11:25
13:11:26
^C

# bpftrace -e 'i:s:1 { printf("%s\n", strftime("%H:%M:%S:%f", nsecs)); }'
Attaching 1 probe...
15:22:24:104033
^C
skb_output()
打印skb的内容到指定文件中。
Write sk_buff skb 's data section to a PCAP file in the path, starting from offset to offset + length.
The PCAP file is encapsulated in RAW IP, so no ethernet header is included. The data section in the struct skb may contain ethernet header in some kernel contexts, you may set offset to 14 bytes to exclude ethernet header.
Each packet’s timestamp is determined by adding nsecs and boot time, the accuracy varies on different kernels, see nsecs.
Environment variable BPFTRACE_PERF_RB_PAGES should be increased in order to capture large packets, or else these packets will be dropped.
格式:
uint32 skboutput(const string path, struct sk_buff *skb, uint64 length, const uint64 offset)
# cat dump.bt
kfunc:napi_gro_receive {
$ret = skboutput("receive.pcap", args->skb, args->skb->len, 0);
}

kfunc:dev_queue_xmit {
// setting offset to 14, to exclude ethernet header
$ret = skboutput("output.pcap", args->skb, args->skb->len, 14);
printf("skboutput returns %d\n", $ret);
}

# export BPFTRACE_PERF_RB_PAGES=1024
# bpftrace dump.bt
...

# tcpdump -n -r ./receive.pcap  | head -3
reading from file ./receive.pcap, link-type RAW (Raw IP)
dropped privs to tcpdump
10:23:44.674087 IP 22.128.74.231.63175 > 192.168.0.23.22: Flags [.], ack 3513221061, win 14009, options [nop,nop,TS val 721277750 ecr 3115333619], length 0
10:23:45.823194 IP 100.101.2.146.53 > 192.168.0.23.46619: 17273 0/1/0 (130)
10:23:45.823229 IP 100.101.2.146.53 > 192.168.0.23.46158: 45799 1/0/0 A 100.100.45.106 (60)
bpftrace的映射表操作函数
内置函数
count() - 统计函数调用次数
sum(int n) - 求和
avg(int n) - 求平均值
min(int n) - 记录变量出现的最小值
max(int n) - 记录变量出现的最大值
stats(int n) - 返回变量出现的次数,平均值,总和
hist(int n) -将值保存为直方图
lhist(int n, int min, int max, int step) -将值保存为线性直方图
delete(@x[key]) - 从映射表中删除一个键值对
print(@x[, top [, div]]) - 打印映射表,可选top(只打印最高的top个)和div(将数值整除后再输出)参数
print(value) - 打印一个变量
clear(@x) - 删除映射表中全部键值对
zero(@x) - 将全部值置为0
count()
格式:
@counter_name[optional_keys] = count()
# bpftrace -e 'kprobe:vfs_read { @reads = count();  }'
Attaching 1 probe...
^C

@reads: 119


# bpftrace -e 'kprobe:vfs_read { @reads[comm] = count(); }'
Attaching 1 probe...
^C

@reads[sleep]: 4
@reads[bash]: 5
@reads[ls]: 7
@reads[snmp-pass]: 8
@reads[snmpd]: 14
@reads[sshd]: 14
sum()
格式:
@counter_name[optional_keys] = sum(value)
# bpftrace -e 'kprobe:vfs_read { @bytes[comm] = sum(arg2); }'
Attaching 1 probe...
^C

@bytes[bash]: 7
@bytes[sleep]: 4160
@bytes[ls]: 6208
@bytes[snmpd]: 20480
@bytes[snmp-pass]: 65536
@bytes[sshd]: 262144


# bpftrace -e 'kretprobe:vfs_read /retval > 0/ { @bytes[comm] = sum(retval); }'
Attaching 1 probe...
^C

@bytes[bash]: 5
@bytes[sshd]: 1135
@bytes[systemd-journal]: 1699
@bytes[sleep]: 2496
@bytes[ls]: 4583
@bytes[snmpd]: 35549
@bytes[snmp-pass]: 55681
参考
https://blog.csdn.net/qq_40711766/article/details/123382244
https://github.com/iovisor/bpftrace/blob/master/docs/reference_guide.md


 893
893

 被折叠的 条评论
为什么被折叠?
被折叠的 条评论
为什么被折叠?
 到【灌水乐园】发言


