


背景介绍
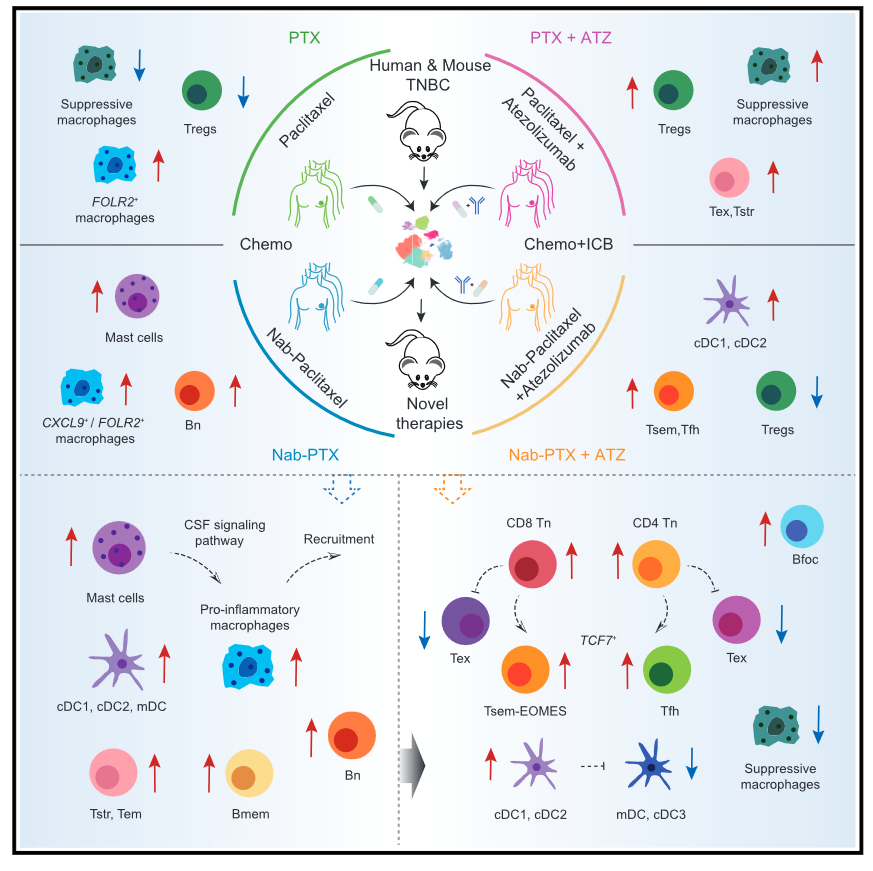
之前对院士组的文章进行了一个大致的浏览 张泽民院士合作的Cancer Cell——三阴性乳腺癌免疫治疗新发现:不同化疗方案如何塑造肿瘤免疫微环境,其中Figure 6中提及了树突状细胞(DC)亚群的转换潜能(Transitional Potential)。本笔记基于对 Zhang et al., 2021(《Single-cell analyses reveal key immune cell subsets associated with response to PD-L1 blockade in triple-negative breast cancer》)的学习,重点学习复现文献中Figure 6 相关的计算方法。
Transitional Potential 分析与 Figure 6A、B 解析
1. 介绍 Figure 6A、B 及其关系
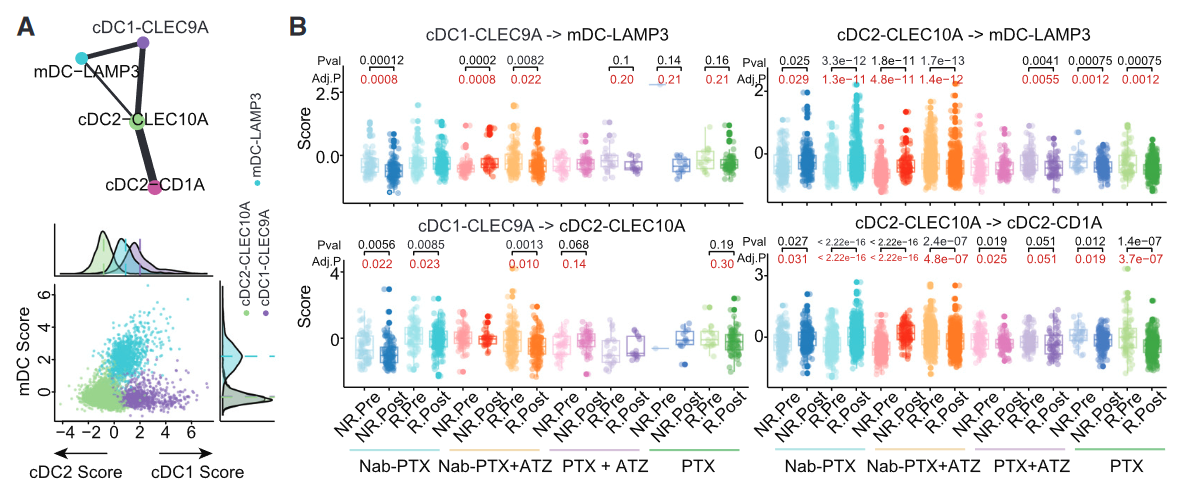
在《Distinct cellular mechanisms underlie chemotherapies and PD-L1 blockade combinations in triple-negative breast cancer》一文中,Figure 6A 和 Figure 6B 共同分析了 树突状细胞(DC)亚群的转换潜能(Transitional Potential),揭示了不同 DC 亚群之间的动态转换关系,并探讨了不同治疗方案对这些转换的影响。
- Figure 6A 主要展示 DC 亚群之间的转变路径,基于 RNA velocity 和 PAGA 轨迹分析 计算 cDC1_CLEC9A、cDC2_CLEC10A、mDC_LAMP3 之间的转换潜力。
- Figure 6B 进一步 统计不同治疗组(Nab-PTX、PTX+ATZ、PTX)对 DC 亚群转换的影响,展示 不同治疗方案如何促进或抑制 DC 亚群的转换。
两幅图的关系如下:
- Figure 6A 提供了 DC 亚群之间的转换架构,通过 RNA velocity 推测可能的 DC 转变路径。
- Figure 6B 统计了不同治疗组如何影响这些 DC 亚群的转换趋势,结合治疗前后数据分析 不同 DC 细胞群的转换潜能是否发生变化。
主要发现:
- cDC1_CLEC9A 可能向 mDC_LAMP3 转变,且该转变在 免疫治疗组(PTX+ATZ)NR 组显著增强。
- cDC2_CLEC10A 可能向 mDC_LAMP3 和 cDC2_CD1A 转变,其中 cDC2_CLEC10A → mDC_LAMP3 转换在非响应者(NR)中更显著。
2. 什么是 Transitional Potential?
Transitional Potential(转换潜能) 指的是 细胞亚群在不同条件下向另一种细胞类型转变的趋势,在单细胞研究中,它被用于:
- 评估细胞状态的可塑性:哪些细胞更可能向另一种状态转变?
- 探索疾病和治疗对细胞状态的影响:治疗是否促进或抑制某些细胞亚群的转换?
- 揭示关键分子调控网络:哪些转录因子或信号通路在转换过程中起关键作用?
在该研究中,Transitional Potential 被用于 研究 DC 亚群如何在不同治疗条件下转变,尤其关注 免疫抑制型 DC(mDC_LAMP3)是否由 cDC1/cDC2 产生。
3. Transitional Potential 计算方法
该文献的方法部分提到:
“We calculated the scores of target subsets within the original subset based on their transcriptomic features.”
即:
- 定义目标 DC 亚群的 marker genes(如 cDC1_CLEC9A、cDC2_CLEC10A、mDC_LAMP3)。
- 在原始 DC 细胞中计算这些 marker genes 的加权表达值,得到 不同 DC 细胞向目标 DC 亚群转换的可能性 Score。
- 在不同治疗组(Pre vs. Post)中比较这些 Scores,观察治疗是否影响转换潜能。
数学计算公式如下:
S c o r e D C = ∑ i = 1 N ( E x p r e s s i o n i × W e i g h t i ) Score_{DC} = \sum_{i=1}^{N} (Expression_{i} \times Weight_{i}) ScoreDC=i=1∑N(Expressioni×Weighti)
其中:
- E x p r e s s i o n i Expression_{i} Expressioni = 目标 DC 亚群 marker gene 在该细胞中的表达量。
- W e i g h t i Weight_{i} Weighti = 该基因在目标 DC 亚群中的贡献权重(可基于 log2FC 或 PCA 负荷)。
- N N N = 目标 DC 亚群的 marker genes 数量。
4. Python & R 计算实现
Python 计算 Transitional Potential
import numpy as np
import pandas as pd
import scanpy as sc

# 定义不同 DC 亚群的 marker genes 及其权重
dc_markers = {
    "cDC1_CLEC9A": {"CLEC9A": 0.8, "BATF3": 0.7, "XCR1": 0.6},
    "cDC2_CLEC10A": {"CLEC10A": 0.9, "CD1C": 0.8, "FCER1A": 0.7},
    "mDC_LAMP3": {"LAMP3": 0.9, "CCR7": 0.8, "CD83": 0.7}
}

# 提取表达数据
expr_matrix = adata.to_df()

def compute_dc_scores(expr_matrix, dc_markers):
    scores = pd.DataFrame(index=expr_matrix.index)

    for dc_type, marker_weights in dc_markers.items():
        genes = list(marker_weights.keys())
        weights = np.array(list(marker_weights.values()))
        valid_genes = [g for g in genes if g in expr_matrix.columns]
        valid_weights = weights[:len(valid_genes)]
        if len(valid_genes) == 0:
            continue
        valid_weights = valid_weights / np.sum(valid_weights)
        scores[dc_type] = expr_matrix[valid_genes].dot(valid_weights)

    return scores

dc_scores_df = compute_dc_scores(expr_matrix, dc_markers)
adata.obs = adata.obs.join(dc_scores_df)
R 计算 Transitional Potential
dc_markers <- list(
  "cDC1_CLEC9A"  = c("CLEC9A" = 0.8, "BATF3" = 0.7, "XCR1" = 0.6),
  "cDC2_CLEC10A" = c("CLEC10A" = 0.9, "CD1C" = 0.8, "FCER1A" = 0.7),
  "mDC_LAMP3"    = c("LAMP3" = 0.9, "CCR7" = 0.8, "CD83" = 0.7)
)

compute_dc_scores <- function(expression_data, dc_markers) {
  scores <- list()
  for (dc_type in names(dc_markers)) {
    marker_genes <- names(dc_markers[[dc_type]])
    weights <- unname(dc_markers[[dc_type]])
    weights <- weights / sum(weights)
    scores[[dc_type]] <- rowSums(expression_data[, marker_genes] * weights)
  }
  return(as.data.frame(scores))
}

dc_scores_df <- compute_dc_scores(expression_data, dc_markers)
Python 计算 Transitional Potential
如果有 adata 对象(Scanpy)如何计算?
# 提取表达数据
expr_matrix = adata.to_df()
dc_scores_df = compute_dc_scores(expr_matrix, dc_markers)
adata.obs = adata.obs.join(dc_scores_df)

# 可视化不同 DC Score 在 UMAP 上的分布
import scanpy as sc
sc.pl.umap(adata, color=['cDC1_CLEC9A', 'cDC2_CLEC10A', 'mDC_LAMP3'], cmap='coolwarm')
import numpy as np
import pandas as pd
import scanpy as sc

# 定义不同 DC 亚群的 marker genes 及其权重
dc_markers = {
    "cDC1_CLEC9A": {"CLEC9A": 0.8, "BATF3": 0.7, "XCR1": 0.6},
    "cDC2_CLEC10A": {"CLEC10A": 0.9, "CD1C": 0.8, "FCER1A": 0.7},
    "mDC_LAMP3": {"LAMP3": 0.9, "CCR7": 0.8, "CD83": 0.7}
}

# 提取表达数据
expr_matrix = adata.to_df()

def compute_dc_scores(expr_matrix, dc_markers):
    scores = pd.DataFrame(index=expr_matrix.index)

    for dc_type, marker_weights in dc_markers.items():
        genes = list(marker_weights.keys())
        weights = np.array(list(marker_weights.values()))
        valid_genes = [g for g in genes if g in expr_matrix.columns]
        valid_weights = weights[:len(valid_genes)]
        if len(valid_genes) == 0:
            continue
        valid_weights = valid_weights / np.sum(valid_weights)
        scores[dc_type] = expr_matrix[valid_genes].dot(valid_weights)

    return scores

dc_scores_df = compute_dc_scores(expr_matrix, dc_markers)
adata.obs = adata.obs.join(dc_scores_df)
R 计算 Transitional Potential
如果有 Seurat 对象如何计算?
# 提取表达矩阵
expression_data <- as.data.frame(GetAssayData(seurat_object, slot = "data"))

# 计算 DC Score
dc_scores_df <- compute_dc_scores(expression_data, dc_markers)

# 将计算结果添加到 Seurat 元数据
seurat_object <- AddMetaData(seurat_object, metadata = dc_scores_df)

# 可视化不同 DC Score 在 UMAP 上的分布
FeaturePlot(seurat_object, features = c("cDC1_CLEC9A", "cDC2_CLEC10A", "mDC_LAMP3"))
dc_markers <- list(
  "cDC1_CLEC9A"  = c("CLEC9A" = 0.8, "BATF3" = 0.7, "XCR1" = 0.6),
  "cDC2_CLEC10A" = c("CLEC10A" = 0.9, "CD1C" = 0.8, "FCER1A" = 0.7),
  "mDC_LAMP3"    = c("LAMP3" = 0.9, "CCR7" = 0.8, "CD83" = 0.7)
)

compute_dc_scores <- function(expression_data, dc_markers) {
  scores <- list()
  for (dc_type in names(dc_markers)) {
    marker_genes <- names(dc_markers[[dc_type]])
    weights <- unname(dc_markers[[dc_type]])
    weights <- weights / sum(weights)
    scores[[dc_type]] <- rowSums(expression_data[, marker_genes] * weights)
  }
  return(as.data.frame(scores))
}

dc_scores_df <- compute_dc_scores(expression_data, dc_markers)
总结
- Figure 6A 构建了 DC 亚群的转换网络,Figure 6B 统计了不同治疗对 DC 转换的影响。
- Transitional Potential 量化了 DC 细胞向不同亚群转换的潜力。
- 计算方法基于 marker gene 加权表达,并可在 Python & R 实现。
✅ 本方法可用于分析 DC 亚群在不同条件下的状态转变,揭示治疗对 DC 免疫调控的影响。


 1万+
1万+

 被折叠的 条评论
为什么被折叠?
被折叠的 条评论
为什么被折叠?
 到【灌水乐园】发言


