


总体需求:把vis画的图展示在页面布局的中,不是单独一个页面只显示vis
1.搭建好vue后,可以使用npm run vis-network 下载 vis插件
2.下载好之后,可以在package.json中看见依赖更新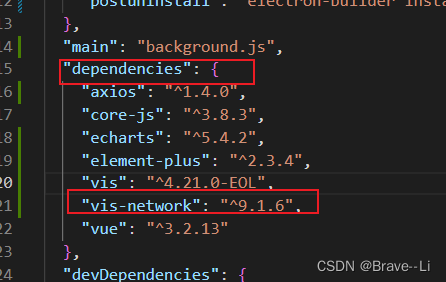
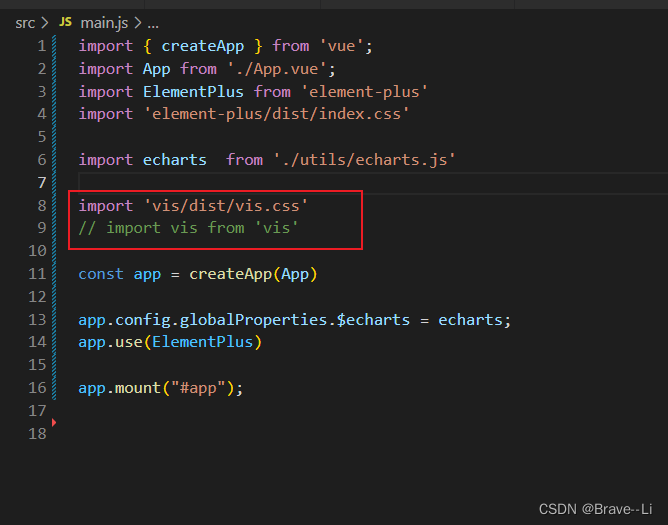
3.我们需要在main.js中进行导入vis
4.把vis单独当成一个组件,可以引入到各个页面
(1)为vis创建一个单独的.vue文件,vue文件名命名必须是驼峰命名法,要不然会报错
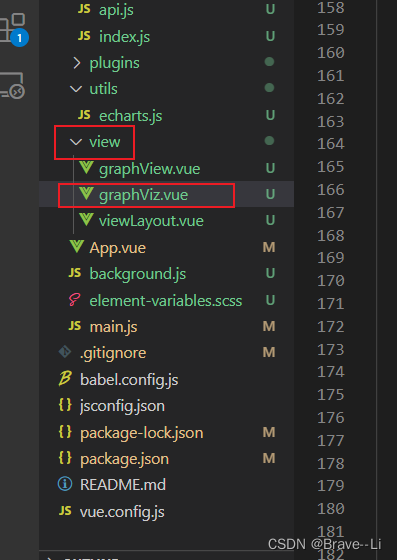
(2)graphViz.vue文件具体代码如下,我的节点比较多,可以自己删一下
<template>
    <!-- vis关系图基础展示 -->
    <div>
      <!--width,height 画布的宽度,高度。 可以是百分比或像素,一般在dom元素上设置 -->
      <div id="network_id" class="network" style="width:100%; height:800px;border:1px solid #ccc;"></div>
    </div>
  </template>
  <script>
  //   一定别忘了引入,在script的第一行
  import Vis from "vis";
  export default {
    data() {
      return {
        dialogVisible: false,
        nodes: [],
        edges: [],
        // network:null,
        container: null,
        //   节点数组
        nodesArray: [
          {
            id: 0,
            name: "16910423",
            group: "people",
          },
          {
            id: 1,
            name: "7810690",
            group: "people",
          },
          {
            id: 2,
            name: "16927121",
            group: "people",
          },
          {
            id: 3,
            name: "23923286",
            group: "animal",
          },
          {
            id: 4,
            name: "590475",
            group: "animal",
          },
          {
            id: 5,
            name: "7321034",
            group: "animal",
          },
          {
            id: 6,
            name: "2716323",
            group: "animal",
          },
          {
            id: 7,
            name: "contig5",
            group: "animal",
          },
          {
            id: 8,
            name: "contig5",
            group: "animal",
          },
          {
            id: 9,
            name: "contig5",
            group: "animal",
          },
          {
            id: 10,
            name: "contig5",
            group: "animal",
          },
          {
            id: 11,
            name: "contig5",
            group: "animal",
          },
          {
            id: 12,
            name: "contig5",
            group: "animal",
          },
          {
            id: 13,
            name: "contig5",
            group: "animal",
          },
          {
            id: 14,
            name: "contig5",
            group: "animal",
          },
          {
            id: 15,
            name: "contig5",
            group: "animal",
          },
          {
            id: 16,
            name: "contig5",
            group: "animal",
          },
          {
            id: 17,
            name: "contig5",
            group: "animal",
          },
          {
            id: 18,
            name: "contig5",
            group: "animal",
          },
          {
            id: 19,
            name: "contig5",
            group: "animal",
          },
          {
            id: 20,
            name: "contig5",
            group: "animal",
          },
          {
            id: 21,
            name: "contig5",
            group: "animal",
          },
          {
            id: 22,
            name: "contig5",
            group: "animal",
          },

          {
            id: 23,
            name: "20866956",
            group: "animal",
          },
          {
            id: 24,
            name: "contig5",
            group: "animal",
          },
          {
            id: 25,
            name: "contig5",
            group: "animal",
          },
        ],
        //   关系线数组
        edgesArray: [
          { id: "e1", from: 0, to: 1, label: "链接" },
          { id: "e2", from: 1, to: 2, label: "前后" },
          { id: "e3", from: 2, to: 3, label: "前后" },
          { id: "e4", from: 3, to: 4, label: "前后" },
          { id: "e5", from: 4, to: 5, label: "链接" },
          { id: "e6", from: 5, to: 0, label: "前后" },
          { id: "e7", from: 6, to: 7, label: "前后" },
          { id: "e9", from: 8, to: 9, label: "前后" },
          { id: "e10", from: 10, to: 13, label: "链接" },
          { id: "e11", from: 1, to: 13, label: "前后" },
          { id: "e12", from: 2, to: 14, label: "前后" },
          { id: "e13", from: 13, to: 15, label: "前后" },
          { id: "e14", from: 5, to: 0, label: "前后" },
          { id: "e15", from: 14, to: 18, label: "前后" },
          { id: "e16", from: 14, to: 19, label: "前后" },
          { id: "e17", from: 19, to: 20, label: "链接" },
          { id: "e18", from: 20, to: 21, label: "前后" },
          { id: "e19", from: 20, to: 22, label: "前后" },
          { id: "e20", from: 22, to: 23, label: "前后" },
          { id: "e21", from: 20, to: 23, label: "前后" },
          { id: "e22", from: 20, to: 24, label: "前后" },
          { id: "e23", from: 23, to: 22, label: "前后" },
          { id: "e18", from: 22, to: 21, label: "前后" },
          { id: "e19", from: 20, to: 20, label: "前后" },
          { id: "e20", from: 22, to: 25, label: "前后" },
        ],
        options: {},
        data: {},
      };
    },
    mounted() {
      this.init();
      this.network.moveTo({ scale: 0.8 });
      var param = { nodes: this.nodesArray, edges: this.edgesArray };
      this.addNetworkParams(param);
    },
    methods: {
      // 初始化network
      init() {
        //1.创建一个nodes对象
        this.nodes = new Vis.DataSet([]);
        //2.创建一个edges对象
        this.edges = new Vis.DataSet([]);
        // 3.创建一个网络拓扑图
        this.container = document.getElementById("network_id");
        // 4.创建data对象
        this.data = {
          nodes: this.nodes,
          edges: this.edges,
        };
        // 5.全局配置
        this.options = {
          autoResize: true, //网络将自动检测其容器的大小调整,并相应地重绘自身
          locale: "cn", //语言设置:工具栏显示中文
          //设置语言
          locales: {
            cn: {
              //工具栏中文翻译
              edit: "编辑",
              del: "删除当前节点或关系",
              back: "返回",
              addNode: "添加节点",
              addEdge: "添加连线",
              editNode: "编辑节点",
              editEdge: "编辑连线",
              addDescription: "点击空白处可添加节点",
              edgeDescription: "点击某个节点拖拽连线可连接另一个节点",
              editEdgeDescription: "可拖拽连线改变关系",
              createEdgeError: "无法将边连接到集群",
              deleteClusterError: "无法删除集群.",
              editClusterError: "无法编辑群集'",
            },
          },
          //该配置项主要用来生成一个可视化的配置器
          configure: {
            enabled: false,
            filter: "nodes,edges",
            container: this.container,
            showButton: true,
          },
          // 组模块
          groups: {
            useDefaultGroups: true,
            myGroupId: {},
            people: {
              shape: "circle",
              color: { background: "#fd91b7" },
              font: { color: "white" },
            },
            animal: {
              shape: "dot",
              color: { background: "#7ed6df" },
            },
          },

          // 设置节点样式
          nodes: {
            shape: "ellipse", //节点的外观。为circle时label显示在节点内,为dot时label显示在节点下方
            size: 30, //节点的大小,
            shadow: false, //如果为true,则节点使用默认设置投射阴影。
            font: {
              //字体配置
              size: 20,
              color: "rgb(117, 218, 167)",
              align: "center",
            },
            color: {
              border: "transparent", //节点边框颜色
              background: "#fd91b7", //节点背景颜色
              highlight: {
                //节点选中时状态颜色
                border: "rgb(117, 218, 167)",
                background: "rgb(117, 218, 167)",
              },
              hover: {
                //节点鼠标滑过时状态颜色
                border: "#dff9fb",
                background: "#88dab1",
              },
            },
            margin: 5, //当形状设置为box、circle、database、icon、text;label的边距
            widthConstraint: 100, //设置数字,将节点的最小和最大宽度设为该值,当值设为很小的时候,label会换行,节点会保持一个最小值,里边的内容会换行
            borderWidth: 1, //节点边框宽度,单位为px
            borderWidthSelected: 3, //节点被选中时边框的宽度,单位为px
            labelHighlightBold: false, //确定选择节点时标签是否变为粗体
          },
          // 边线配置
          edges: {
            width: 1,
            length: 200,
            color: {
              color: "#848499",
              highlight: "rgb(117, 218, 167)",
              hover: "#88dab1",
              inherit: "from",
              opacity: 1.0,
            },
            font: {
              color: "#343434",
              size: 18, // px
              face: "arial",
              background: "none",
              strokeWidth: 2, // px
              strokeColor: "#ffffff",
              align: "horizontal",
              multi: false,
              vadjust: 0,
              bold: {
                color: "#343434",
                size: 14, // px
                face: "arial",
                vadjust: 0,
                mod: "bold",
              },
              ital: {
                color: "#343434",
                size: 14, // px
                face: "arial",
                vadjust: 0,
                mod: "italic",
              },
              boldital: {
                color: "#343434",
                size: 14, // px
                face: "arial",
                vadjust: 0,
                mod: "bold italic",
              },
              mono: {
                color: "#343434",
                size: 15, // px
                face: "courier new",
                vadjust: 2,
                mod: "",
              },
            },
            shadow: false,
            smooth: {
              //设置两个节点之前的连线的状态
              enabled: true, //默认是true,设置为false之后,两个节点之前的连线始终为直线,不会出现贝塞尔曲线
            },
            arrows: { to: true }, //箭头指向to
          },
          // 布局
          layout: {
            randomSeed: 1, //配置每次生成的节点位置都一样,参数为数字1、2等
            // hierarchical: {
            // direction: "LR", //UD:上下 DU:下上 LR:左右 RL:右左
            // sortMethod: "directed",
            // }, //层级结构显示}
          },
          //物理引擎-计算节点之前斥力,进行自动排列的属性
          physics: {
            enabled: true, //默认是true,设置为false后,节点将不会自动改变,拖动谁谁动。不影响其他的节点
            barnesHut: {
              gravitationalConstant: -4000,
              centralGravity: 0.3,
              springLength: 120,
              springConstant: 0.04,
              damping: 0.09,
              avoidOverlap: 0,
            },
          },
          //用于所有用户与网络的交互。处理鼠标和触摸事件以及导航按钮和弹出窗口
          interaction: {
            hover: true,
            dragNodes: true, //是否能拖动节点
            dragView: true, //是否能拖动画布
            // hover: true, //鼠标移过后加粗该节点和连接线
            multiselect: true, //按 ctrl 多选
            selectable: true, //是否可以点击选择
            selectConnectedEdges: true, //选择节点后是否显示连接线
            hoverConnectedEdges: true, //鼠标滑动节点后是否显示连接线
            hideEdgesOnDrag: true, //拖动视图时不会绘制边
            zoomView: true, //是否能缩放画布
          },
          //操作模块:包括 添加、删除、获取选中点、设置选中点、拖拽系列、点击等等
          manipulation: {
            enabled: true, //该属性表示可以编辑,出现编辑操作按钮
            addNode: true,
            addEdge: true,
            // editNode: undefined,
            editEdge: true,
            deleteNode: true,
            deleteEdge: true,
          },
        };
        // 6.初始化网络拓扑图
        this.network = new Vis.Network(this.container, this.data, this.options);
      },
      //扩展节点 增加nodes和edges集合参数
      addNetworkParams(param) {
        //添加节点
        for (var i = 0; i < param.nodes.length; i++) {
          var node = param.nodes[i];
          console.log("node=", node);
          this.nodes.add({
            label: node.name,
            ...node,
          });
          console.log("nodes=", this.nodes);
        }
        //添加关系
        for (var j = 0; j < param.edges.length; j++) {
          var edge = param.edges[j];
          this.edges.add({
            ...edge,
          });
        }
      },
    },
  };
  </script>
  <style lang="less">
  </style>
以上就是单独创建vis组建的代码
5.下面在我们需要引入组件的地方,进行引入vis组件
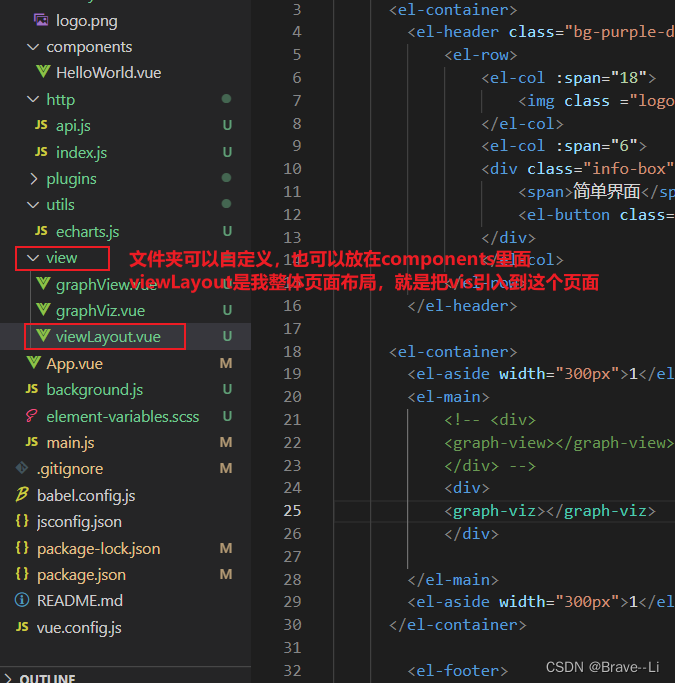
首页的整体布局代码如下
<template>
    <div class="layout">
      <el-container>
        <el-header class="bg-purple-dark">
            <el-row>
                <el-col :span="18">
                    <img class ="logo" scr="../assets/logo.png" alt="" />
                </el-col>
                <el-col :span="6">
                <div class="info-box">
                    <span>简单界面</span>
                    <el-button class="out-btn" type="text">展示</el-button>
                </div>
                </el-col>
            </el-row>
        </el-header>

      <el-container>
        <el-aside width="300px">1</el-aside>
        <el-main>
           <!-- //在要展示vis画图的地方引入组件即可,使用div包装一下 -->
            <div>
            <graph-viz></graph-viz>
            </div>

        </el-main>
        <el-aside width="300px">1</el-aside>
      </el-container>

        <el-footer>
        </el-footer>
      </el-container>
    </div>
  </template>
<script>
// 这个地方一定要导入组件位置,就是vue文件所在的位置
import graphViz from '@/view/graphViz.vue';
// 对vis(即graphviz组件,我自己命名的)这个组件进行声明
export default{
    components:{

        graphViz
    },
};

</script>


<style>


.bg-purple-light{
    background: #e5e9f2;
}

.bg-purple-dark{
background: #d3dce6;
}

.el-header,
  .el-footer {
    background-color: #b3c0d1;
    color: var(--el-text-color-primary);
    text-align: center;
    line-height: 10px;
  }

  .el-main {
    background-color: #e9eef3;
    color: var(--el-text-color-primary);
    text-align: center;
    line-height: 800px;
  }


</style>
以上就完成啦。
7.在终端运行 npm run serve
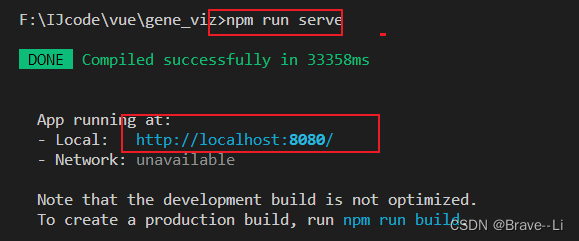
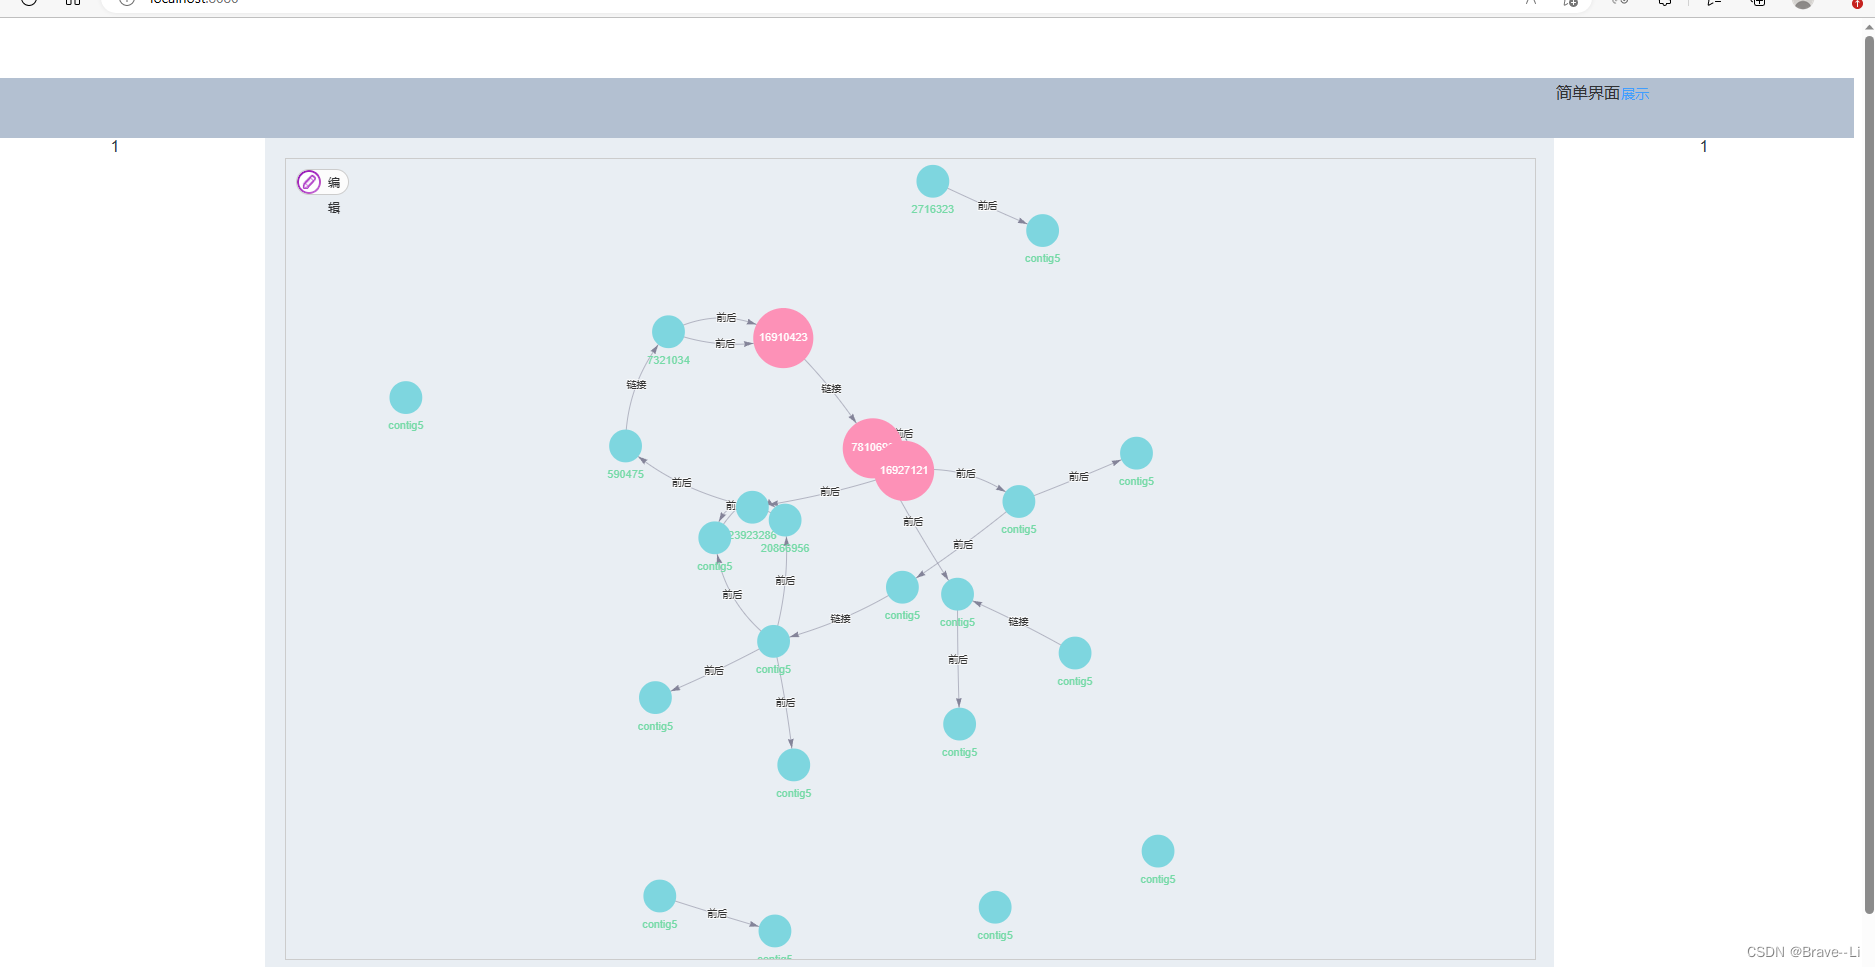
上图就是展示的结果,在想要的位置进行展示
图中的节点和线都是可以拖动的哦,在graphViz.vue的代码里面,有很多参数可以改动,可以自己改动试试看。


 252
252


 被折叠的 条评论
为什么被折叠?
被折叠的 条评论
为什么被折叠?
 到【灌水乐园】发言


