


ZheXianView.h
@interface ZheXianView : UIView
@property(nonatomic,strong)NSArray *monthArr;
@property(nonatomic,strong)NSArray *dataArr;
@property(nonatomic,assign)CGFloat monthDistance;
@property(nonatomic,assign)CGFloat dataHeight;
@property(nonatomic,assign)CGFloat xGap;
@property(nonatomic,assign)CGFloat yGap;
@property(nonatomic,assign)CGFloat maxY;
@property(nonatomic,assign)CGFloat minY;
@end
ZheXianView.m
- (instancetype)initWithCoder:(NSCoder *)coder
{
self = [super initWithCoder:coder];
if (self) {
[self setDefaultValues];
}
return self;
}
- (id)initWithFrame:(CGRect)frame {
self = [super initWithFrame:frame];
if (self) {
[self setDefaultValues];
}
return self;
}
-(void)setMonthArr:(NSArray *)monthArr{
_monthArr = monthArr;
self.xGap = 30;
self.yGap = 50;
self.dataHeight = 300;
self.monthDistance = (self.frame.size.width - 2 * self.xGap ) / self.monthArr.count;
for (int i = 0; i < self.monthArr.count; i++) {
UILabel *lab = [[UILabel alloc]initWithFrame:CGRectMake(self.xGap + i * self.monthDistance, self.yGap + self.dataHeight , self.monthDistance, 30)];
lab.textAlignment = NSTextAlignmentCenter;
lab.text = self.monthArr[i];
lab.textColor = [UIColor blackColor];
[self addSubview:lab];
}
NSInteger da = 0;
for (int i = 0; i < 5; i++) {
UILabel *lab = [[UILabel alloc]initWithFrame:CGRectMake(self.xGap - 30 , self.yGap + self.dataHeight - i * self.monthDistance -20, 30, 30)];
lab.font = [UIFont systemFontOfSize:12];
lab.textAlignment = NSTextAlignmentCenter;
lab.text = [NSString stringWithFormat:@"%ld",da];
lab.textColor = [UIColor blackColor];
[self addSubview:lab];
da += 30;
}
}
-(void)setDataArr:(NSArray *)dataArr{
_dataArr = dataArr;
}
-(void)setDefaultValues{
self.backgroundColor = [UIColor whiteColor];
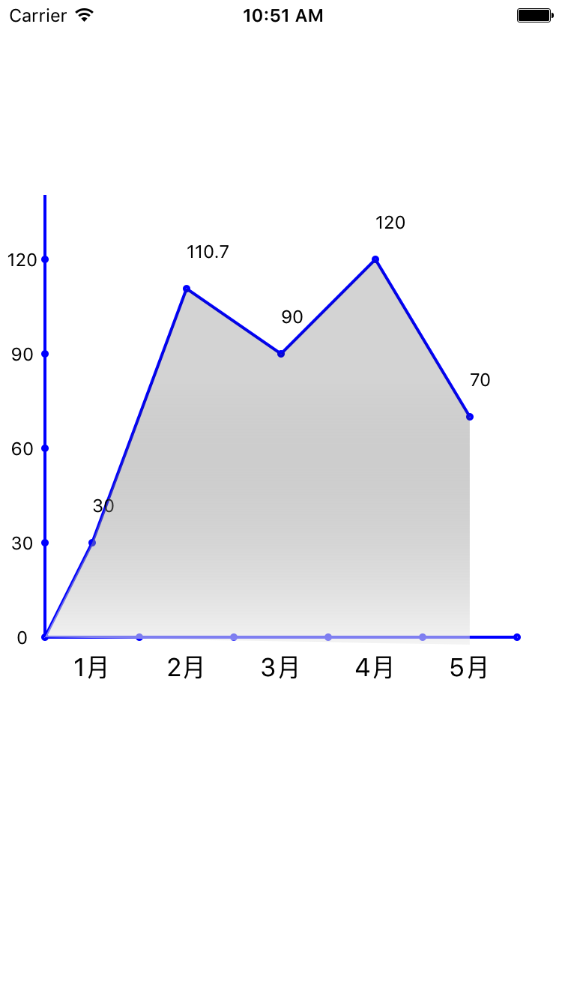
self.dataArr = @[@"30",@"110.7",@"90",@"120",@"70"];
self.monthArr = @[@"1月",@"2月",@"3月",@"4月",@"5月"];
self.xGap = 30;
self.yGap = 50;
self.dataHeight = 300;
// self.monthDistance = (self.frame.size.width - 2 * self.xGap ) / self.monthArr.count;
}
// Only override drawRect: if you perform custom drawing.
// An empty implementation adversely affects performance during animation.
- (void)drawRect:(CGRect)rect {
[super drawRect:rect];
CGContextRef ctx = UIGraphicsGetCurrentContext();//获取画图工具
UIGraphicsPushContext(ctx);
CGContextSetStrokeColorWithColor(ctx, [[UIColor blueColor] CGColor]);//填充颜色
CGContextSetLineWidth(ctx, 2);
//画坐标轴
//x轴
CGPoint pointx = CGPointMake(self.xGap, self.yGap + self.dataHeight - 5);
CGPoint pointx2 = CGPointMake(self.xGap + self.monthArr.count *self.monthDistance , self.yGap + self.dataHeight - 5);
CGContextMoveToPoint(ctx, pointx.x, pointx.y);
CGContextAddLineToPoint(ctx, pointx2.x, pointx2.y);
CGContextStrokePath(ctx);
//画x轴上的分割点
for (int i = 0; i < self.monthArr.count + 1; i++) {
CGContextAddArc(ctx,self.xGap + i* self.monthDistance ,self.yGap + self.dataHeight - 5 , 1.5, 0, M_PI * 2, 0);
CGContextSetRGBFillColor(ctx, 0, 0, 1, 0.5);
CGContextDrawPath(ctx, kCGPathEOFillStroke);
}
//画y轴
CGPoint pointy = CGPointMake(self.xGap, self.yGap + self.dataHeight - 5);
CGPoint pointy2 = CGPointMake(self.xGap, self.yGap);
CGContextMoveToPoint(ctx, pointy.x, pointy.y);
CGContextAddLineToPoint(ctx, pointy2.x, pointy2.y);
CGContextStrokePath(ctx);
//画y轴分割点
for (int i = 1; i < self.monthArr.count; i++) {
CGContextAddArc(ctx,self.xGap ,self.yGap + self.dataHeight - 5 - i * self.monthDistance , 1.5, 0, M_PI * 2, 0);
CGContextSetRGBFillColor(ctx, 0, 0, 1, 0.5);
CGContextDrawPath(ctx, kCGPathEOFillStroke);
}
self.minY = self.yGap + self.dataHeight - 5;
self.maxY = self.yGap + self.dataHeight - 4 * self.monthDistance - 5;
[self setStackZheXian];
}
-(void)setStackZheXian{
CGContextRef ctx = UIGraphicsGetCurrentContext();//获取画图工具
UIGraphicsPushContext(ctx);
CGContextSetStrokeColorWithColor(ctx, [[UIColor blueColor] CGColor]);//填充颜色
CGContextSetLineWidth(ctx, 2);//设置线宽
CGPoint nextPoint = CGPointMake(self.xGap ,self.yGap + self.dataHeight - 5 );
for (int i = 0; i < _dataArr.count; i++) {
CGFloat yValue = [_dataArr[i] floatValue];
CGFloat innerGrade = self.minY - (self.minY - self.maxY) * (yValue / 120);
CGContextAddArc(ctx,self.xGap + self.monthDistance / 2 + i * self.monthDistance ,innerGrade , 1.5, 0, M_PI * 2, 0);
CGContextSetRGBFillColor(ctx, 0, 0, 1, 0.5);
CGContextDrawPath(ctx, kCGPathEOFillStroke);
//连接点
CGPoint pointx = nextPoint;
CGPoint pointx2 = CGPointMake(self.xGap + self.monthDistance / 2 + i * self.monthDistance, innerGrade);
CGContextMoveToPoint(ctx, pointx.x, pointx.y);
CGContextAddLineToPoint(ctx, pointx2.x, pointx2.y);
CGContextStrokePath(ctx);
nextPoint = CGPointMake(self.xGap + self.monthDistance / 2 + i * self.monthDistance, innerGrade);
//显示坐标内点的数值
UILabel *lab = [[UILabel alloc]initWithFrame:CGRectMake(self.xGap + self.monthDistance / 2 + i * self.monthDistance, innerGrade - 40, 40, 30)];
lab.font = [UIFont systemFontOfSize:12];
lab.text = _dataArr[i];
lab.textColor = [UIColor blackColor];
[self addSubview:lab];
}
//此处为构建阴影部分的形状(与CAShapeLayer配套使用)
UIBezierPath *pointPath1 = [UIBezierPath bezierPath];
[pointPath1 setLineWidth:2.0];
[pointPath1 moveToPoint:CGPointMake(self.xGap,self.yGap + self.dataHeight - 5 )];
for (int i = 0; i < self.dataArr.count; i++) {
CGFloat yValue = [_dataArr[i] floatValue];
CGFloat innerGrade = self.minY - (self.minY - self.maxY) * (yValue / 120);
CGPoint pointx2 = CGPointMake(self.xGap + self.monthDistance / 2 + i * self.monthDistance, innerGrade);
[pointPath1 addLineToPoint:pointx2];
}
[pointPath1 addLineToPoint:CGPointMake(self.xGap + self.monthDistance / 2 + 4 * self.monthDistance,self.yGap + self.dataHeight )];
CAShapeLayer *cha = [CAShapeLayer layer];
cha.strokeColor = [[UIColor clearColor] CGColor];
cha.fillColor = [[UIColor whiteColor] CGColor];
cha.path = pointPath1.CGPath;
//[self insertColorGradient];
UIColor *colorOne = [UIColor colorWithRed:(255/255.0) green:(255/255.0) blue:(255/255.0) alpha:0.6];
UIColor *colorTwo = [UIColor colorWithRed:(33/255.0) green:(33/255.0) blue:(33/255.0) alpha:0.2];
NSArray *colors = [NSArray arrayWithObjects:(id)colorTwo.CGColor, colorOne.CGColor, nil];
NSNumber *stopOne = [NSNumber numberWithFloat:1.1];
NSNumber *stopTwo = [NSNumber numberWithFloat:0.0];
NSArray *locations = [NSArray arrayWithObjects:stopTwo,stopOne ,nil];
//此处为画阴影部分
CAGradientLayer *headerLayer = [CAGradientLayer layer];
headerLayer.colors = colors;
headerLayer.locations = locations;
// headerLayer.locations=@[@0.0,@0.2,@1.0];
headerLayer.startPoint = CGPointMake(0.5,0.5);
headerLayer.endPoint = CGPointMake(0.5,1);
headerLayer.frame = CGRectMake(0, 0, self.frame.size.width - 2 * self.xGap, 350);
[headerLayer setMask:cha];
[headerLayer setMasksToBounds:YES];
[self.layer insertSublayer:headerLayer above:0];
[pointPath1 closePath];
}运行展示:


 1749
1749

 被折叠的 条评论
为什么被折叠?
被折叠的 条评论
为什么被折叠?
 到【灌水乐园】发言


