


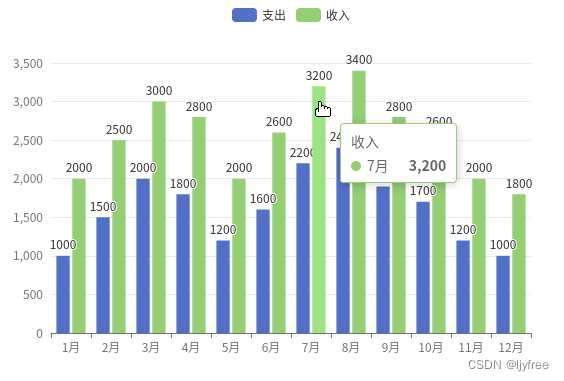
 该文章展示了一个使用PythonFlask框架和ECharts库创建的Web应用,该应用生成并显示了12个月的收入和支出的柱状图,便于用户直观地了解每月的财务状况。ECharts库用于数据可视化,通过JavaScript在前端渲染图表。
目的
给定十二个月的收入和支出,通过柱状图分月进行展示
目录结构
admin@ubuntu18-mypc:~/flask$ tree
.
├── run.py
└── templates
    └── index.html

1 directory, 2 files
admin@ubuntu18-mypc:~/flask$
具体内容
admin@ubuntu18-mypc:~/flask$ cat run.py
from flask import Flask, render_template, request
import json

app = Flask(__name__,static_folder='static')

@app.route('/')
def index():
    expenses = [1000, 1500, 2000, 1800, 1200, 1600, 2200, 2400, 1900, 1700, 1200, 1000]
    incomes = [2000, 2500, 3000, 2800, 2000, 2600, 3200, 3400, 2800, 2600, 2000, 1800]
    return render_template('index.html', expenses=expenses, incomes=incomes)

if __name__ == '__main__':
    app.run(host='0.0.0.0',debug=True)
admin@ubuntu18-mypc:~/flask$


admin@ubuntu18-mypc:~/flask$ cat templates/index.html
<!DOCTYPE html>
<html>
<head>
    <meta charset="utf-8">
    <title>Flask + ECharts绘制每月支出和收入柱形图</title>
    <!-- 引入echarts.min.js文件 -->
    <script src="https://cdn.jsdelivr.net/npm/echarts/dist/echarts.min.js"></script>
</head>
<body>
    <div id="chart" style="width: 600px; height: 400px;"></div>

    <script type="text/javascript">
        var expenses = {{ expenses|tojson }};
        var incomes = {{ incomes|tojson }};

        // 基于准备好的dom,初始化echarts实例
        var myChart = echarts.init(document.getElementById('chart'));

        // 配置图表参数
        var option = {
            tooltip: {},
            legend: {
                data: ['支出', '收入']
            },
           xAxis: {
                type: 'category',
                data: ['1月', '2月', '3月', '4月', '5月', '6月', '7月', '8月', '9月', '10月', '11月', '12月']
            },
            yAxis: {},
            series: [
                {
                    name: '支出',
                    type: 'bar',
                    data: expenses,
                    label: {
                        show: true,
                        position: 'top'
                    }
                },
                {
                    name: '收入',
                    type: 'bar',
                    data: incomes,
                    label: {
                        show: true,
                        position: 'top'
                    }
                }
            ]
        };

        // 使用刚指定的配置项和数据显示图表。
        myChart.setOption(option);
    </script>
</body>
</html>
admin@ubuntu18-mypc:~/flask$
效果
- 运行run.py
admin@ubuntu18-mypc:~/flask$ python run.py
 * Serving Flask app "run" (lazy loading)
 * Environment: production
   WARNING: This is a development server. Do not use it in a production deployment.
   Use a production WSGI server instead.
 * Debug mode: on
 * Running on http://0.0.0.0:5000/ (Press CTRL+C to quit)
 * Restarting with stat
 * Debugger is active!
 * Debugger PIN: 288-698-524
- 浏览器访问 http://[server_ip]:5000 ,得到如下展示


 805
805

 被折叠的 条评论
为什么被折叠?
被折叠的 条评论
为什么被折叠?
 到【灌水乐园】发言


