


Python计算机视觉——Harris角点检测
写在前面
在传统目标识别中,特征提取是最终目标识别效果好坏的一个重要决定因素,因此,在这项工作里,有很多研究者把主要精力都放在特征提取方向。在传统目标识别中,主要使用的特征主要有如下几类:
- 边缘特征(Canny算子)
- 纹理特征(小波Gabor算子)
- 角点特征(
Harris算子)
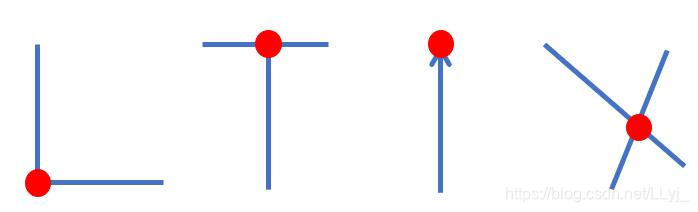
那何为角点?
- 局部窗口沿各方向移动,均产生明显变化的点
- 图像局部曲率突变的点
1 Harris角点检测基本思想
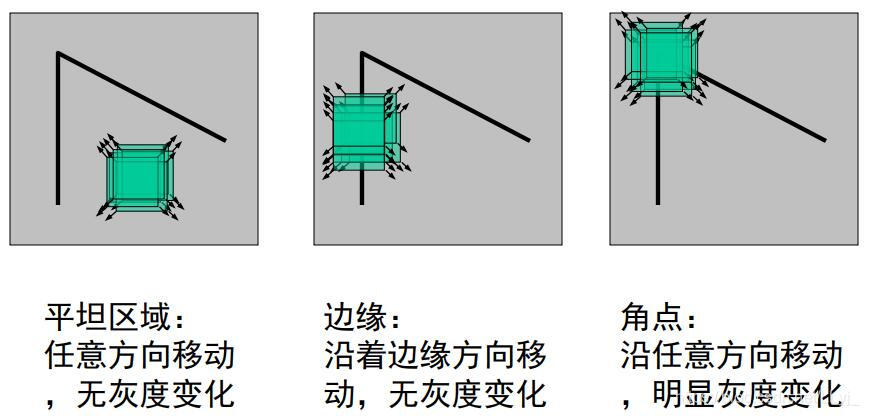
角点检测的算法思想是:选取一个固定的窗口在图像上以任意方向的滑动,如果灰度都有较大的变化,那么久认为这个窗口内部存在角点。人眼对角点的识别通常是在一个局部的小区域或小窗口完成的。如果在各个方向上移动这个特征的小窗口,窗口内区域的灰度发生了较大的变化,那么就认为在窗口内遇到了角点。如果这个特定的窗口在图像各个方向上移动时,窗口内图像的灰度没有发生变化,那么窗口内就不存在角点;如果窗口在某一个方向移动时,窗口内图像的灰度发生了较大的变化,而在另一些方向上没有发生变化,那么,窗口内的图像可能就是一条直线的线段。
2 Harris角点检测公式推导
将窗口平移[u, v]产生的灰度变化E(u, v),根据上述的基本思想可知,若E(u, v)越大,则是角点的概率就越大。公式如下:
E
(
u
,
v
)
=
∑
x
,
y
w
(
x
,
y
)
[
I
(
x
+
u
,
y
+
v
)
−
I
(
x
,
y
)
]
2
E(u, v)=\sum_{x, y} w(x, y)[I(x+u, y+v)-I(x, y)]^{2}
E(u,v)=x,y∑w(x,y)[I(x+u,y+v)−I(x,y)]2
w(x, y)是窗口函数,以点(x,y)为中心的窗口。I(x+u, y+v)是平移后的图像灰度,I(x, y)是平移前的灰度。
f
(
x
+
u
,
y
+
v
)
=
f
(
x
,
y
)
+
u
f
x
(
x
,
y
)
+
v
f
y
(
x
,
y
)
+
F
i
r
s
t
−
p
a
r
t
i
a
l
−
d
e
r
i
v
a
t
i
v
e
s
1
2
!
[
u
2
f
x
x
(
x
,
y
)
+
u
v
f
x
y
x
,
y
+
v
2
f
y
y
(
x
,
y
)
]
+
S
e
c
o
n
d
−
p
a
r
t
i
a
l
−
d
e
r
i
v
a
t
i
v
e
s
…
…
f(x+u, y+v)=f(x, y)+u f_{x}(x, y)+v f_{y}(x, y)+\\First-partial- derivatives\\\frac{1}{2 !}\left[u^{2} f_{x x}(x, y)+u v f_{x y} x, y+v^{2} f_{y y}(x, y)\right]+\\Second-partial-derivatives\\……
f(x+u,y+v)=f(x,y)+ufx(x,y)+vfy(x,y)+First−partial−derivatives2!1[u2fxx(x,y)+uvfxyx,y+v2fyy(x,y)]+Second−partial−derivatives……
所以,可以约等于
f
(
x
+
u
,
y
+
v
)
≈
f
(
x
,
y
)
+
u
f
x
(
x
,
y
)
+
v
f
y
(
x
,
y
)
即
等
于
:
I
(
x
+
u
,
y
+
v
)
≈
I
(
x
,
y
)
+
u
I
x
(
x
,
y
)
+
v
I
y
(
x
,
y
)
f(x+u, y+v) \approx f(x, y)+u f_{x}(x, y)+v f_{y}(x, y)\\即等于:\\I(x+u, y+v) \approx I(x, y)+u I_{x}(x, y)+v I_{y}(x, y)
f(x+u,y+v)≈f(x,y)+ufx(x,y)+vfy(x,y)即等于:I(x+u,y+v)≈I(x,y)+uIx(x,y)+vIy(x,y)
因此得到如下推导:

于是对于局部微小的移动量 [u, v],可以近似得到下面的表达式:
E
(
u
,
v
)
≅
[
u
,
v
]
M
[
u
v
]
E(u, v) \cong[u, v] M\left[\begin{array}{l} u \\ v \end{array}\right]
E(u,v)≅[u,v]M[uv]
其中M是 2×2 矩阵,可由图像的导数求得:
M
=
∑
x
,
y
w
(
x
,
y
)
[
I
x
2
I
x
I
y
I
x
I
y
I
y
2
]
M=\sum_{x, y} w(x, y)\left[\begin{array}{cc} I_{x}^{2} & I_{x} I_{y} \\ I_{x} I_{y} & I_{y}^{2} \end{array}\right]
M=x,y∑w(x,y)[Ix2IxIyIxIyIy2]
窗口移动导致的图像变化量:实对称矩阵M的 特征值分析:
E
(
u
,
v
)
≅
[
u
,
v
]
M
[
u
v
]
记
M
的特征值为
λ
1
,
λ
2
\begin{array}{l} E(u, v) \cong[u, v] M\left[\begin{array}{l} u \\ v \end{array}\right]\\ \text { 记 } M \text { 的特征值为 } \lambda_{1}, \lambda_{2} \end{array}
E(u,v)≅[u,v]M[uv] 记 M 的特征值为 λ1,λ2
则根据两个特征值得到结论
- 如果矩阵对应的两个特征值都较大,那么窗口内含有角点
- 如果特征值一个大一个小,那么窗口内含有线性边缘
- 如果两个特征值都很小,那么窗口内为平坦区域
所以上述兜兜转转,把角点的检测转化为数学模型,就是求解窗口内矩阵的特征值并且判断特征值的大小。
再多定义个式子:角点响应函数R
R
=
det
M
−
k
(
trace
M
)
2
其
中
:
det
M
=
λ
1
λ
2
trace
M
=
λ
1
+
λ
2
(
k
−
empirical constant,
k
=
0.04
∼
0.06
)
\begin{array}{c} R=\operatorname{det} M-k(\operatorname{trace} M)^{2} \\其中:\\ \operatorname{det} M=\lambda_{1} \lambda_{2} \\ \text { trace } M=\lambda_{1}+\lambda_{2} \\ (k-\text { empirical constant, } k=0.04 \sim 0.06) \end{array}
R=detM−k(traceM)2其中:detM=λ1λ2 trace M=λ1+λ2(k− empirical constant, k=0.04∼0.06)
同理可得:
- 角点:R 为大数值正数
- 边缘:R为大数值负数
- 平坦区:R为小数值
3 实验分析
捋一下整个Harris角点检测步骤:
- 读取图片,将图片转化成灰度图
- 计算响应函数
- 基于响应值选择角点
- 在原图中画出检测的角点
源码如下:
新建文件Harris_Detector.py
from pylab import *
from numpy import *
from scipy.ndimage import filters


def compute_harris_response(im,sigma=3):
    """ Compute the Harris corner detector response function
        for each pixel in a graylevel image. """

    # derivatives
    imx = zeros(im.shape)
    filters.gaussian_filter(im, (sigma,sigma), (0,1), imx)
    imy = zeros(im.shape)
    filters.gaussian_filter(im, (sigma,sigma), (1,0), imy)

    # compute components of the Harris matrix
    Wxx = filters.gaussian_filter(imx*imx,sigma)
    Wxy = filters.gaussian_filter(imx*imy,sigma)
    Wyy = filters.gaussian_filter(imy*imy,sigma)

    # determinant and trace
    Wdet = Wxx*Wyy - Wxy**2
    Wtr = Wxx + Wyy

    return Wdet / Wtr


def get_harris_points(harrisim,min_dist=10,threshold=0.1):
    """ Return corners from a Harris response image
        min_dist is the minimum number of pixels separating
        corners and image boundary. """

    # find top corner candidates above a threshold
    corner_threshold = harrisim.max() * threshold
    harrisim_t = (harrisim > corner_threshold) * 1

    # get coordinates of candidates
    coords = array(harrisim_t.nonzero()).T

    # ...and their values
    candidate_values = [harrisim[c[0],c[1]] for c in coords]

    # sort candidates (reverse to get descending order)
    index = argsort(candidate_values)[::-1]

    # store allowed point locations in array
    allowed_locations = zeros(harrisim.shape)
    allowed_locations[min_dist:-min_dist,min_dist:-min_dist] = 1

    # select the best points taking min_distance into account
    filtered_coords = []
    for i in index:
        if allowed_locations[coords[i,0],coords[i,1]] == 1:
            filtered_coords.append(coords[i])
            allowed_locations[(coords[i,0]-min_dist):(coords[i,0]+min_dist),
                        (coords[i,1]-min_dist):(coords[i,1]+min_dist)] = 0

    return filtered_coords


def plot_harris_points(image,filtered_coords):
    """ Plots corners found in image. """

    figure()
    gray()
    imshow(image)
    plot([p[1] for p in filtered_coords],
                [p[0] for p in filtered_coords],'*')
    axis('off')
    show()
上述三个函数分别代表这步骤中的234。1步骤则新建test_harris.py
from PIL import Image
from numpy import *
# 这就是为啥上述要新建一个的原因,因为现在就可以import
import Harris_Detector
from pylab import *
from scipy.ndimage import filters

# filename
im = array(Image.open(r"  ").convert('L'))
harrisim=Harris_Detector.compute_harris_response(im)
filtered_coords=Harris_Detector.get_harris_points(harrisim)
Harris_Detector.plot_harris_points(im,filtered_coords)
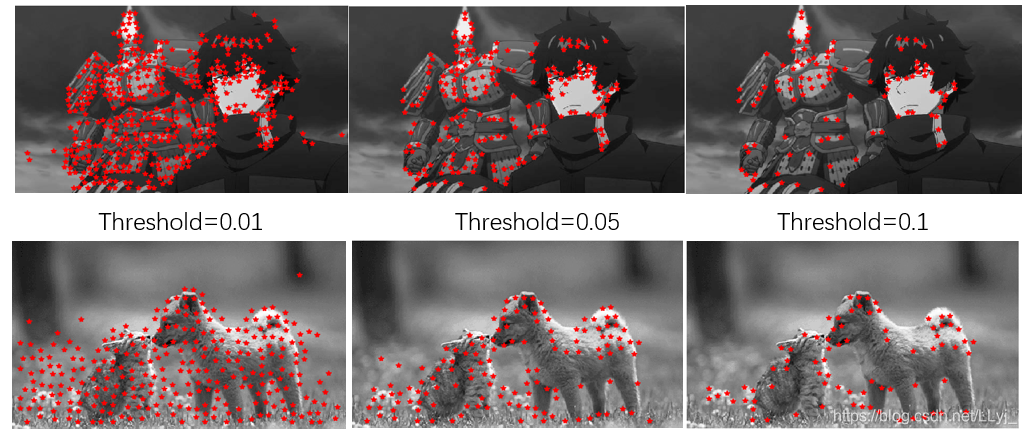
实验结果如下:由图可知不同的阈值,检测出的角点个数会不同。阈值越小,则检测出的角点会越多,意味着符合该条件的角点就会多,但同样意味着放低了条件,有些不确定不准确的角点也有可能被检测;增大阈值范围,则检测到的角点会变少,但相对来说每个角点的置信程度较高,所以说阈值的选择就是empirical constant。其实现在opencv也有自带的函数库 cv2.cornerHarris能够直接完成harris角点检测,可直接使用。
对于图像匹配,在Harris_Detector.py中加入如下5个函数。Harris 角点检测器仅仅能够检测出图像中的兴趣点,但是没有给出通过比较图像间的兴趣点来寻找匹配角点的方法。我们需要在每个点上加入描述子信息,并给出一个比较这些描述子的方法。兴趣点描述子是分配给兴趣点的一个向量,描述该点附近的图像的表观信息。描述子越好,寻找到的对应点越好。我们用对应点或者点的对应来描述相同物体和场景点在不同图像上形成的像素点。
def get_descriptors(image,filtered_coords,wid=5):
    """ For each point return pixel values around the point
        using a neighbourhood of width 2*wid+1. (Assume points are
        extracted with min_distance > wid). """

    desc = []
    for coords in filtered_coords:
        patch = image[coords[0]-wid:coords[0]+wid+1,
                            coords[1]-wid:coords[1]+wid+1].flatten()
        desc.append(patch)

    return desc


def match(desc1,desc2,threshold=0.5):
    """ For each corner point descriptor in the first image,
        select its match to second image using
        normalized cross correlation. """

    n = len(desc1[0])

    # pair-wise distances
    d = -ones((len(desc1),len(desc2)))
    for i in range(len(desc1)):
        for j in range(len(desc2)):
            d1 = (desc1[i] - mean(desc1[i])) / std(desc1[i])
            d2 = (desc2[j] - mean(desc2[j])) / std(desc2[j])
            ncc_value = sum(d1 * d2) / (n-1)
            if ncc_value > threshold:
                d[i,j] = ncc_value

    ndx = argsort(-d)
    matchscores = ndx[:,0]

    return matchscores


def match_twosided(desc1,desc2,threshold=0.5):
    """ Two-sided symmetric version of match(). """

    matches_12 = match(desc1,desc2,threshold)
    matches_21 = match(desc2,desc1,threshold)

    ndx_12 = where(matches_12 >= 0)[0]

    # remove matches that are not symmetric
    for n in ndx_12:
        if matches_21[matches_12[n]] != n:
            matches_12[n] = -1

    return matches_12


def appendimages(im1,im2):
    """ Return a new image that appends the two images side-by-side. """

    # select the image with the fewest rows and fill in enough empty rows
    rows1 = im1.shape[0]
    rows2 = im2.shape[0]

    if rows1 < rows2:
        im1 = concatenate((im1,zeros((rows2-rows1,im1.shape[1]))),axis=0)
    elif rows1 > rows2:
        im2 = concatenate((im2,zeros((rows1-rows2,im2.shape[1]))),axis=0)
    # if none of these cases they are equal, no filling needed.

    return concatenate((im1,im2), axis=1)


def plot_matches(im1,im2,locs1,locs2,matchscores,show_below=True):
    """ Show a figure with lines joining the accepted matches
        input: im1,im2 (images as arrays), locs1,locs2 (feature locations),
        matchscores (as output from 'match()'),
        show_below (if images should be shown below matches). """

    im3 = appendimages(im1,im2)
    if show_below:
        im3 = vstack((im3,im3))

    imshow(im3)

    cols1 = im1.shape[1]
    for i,m in enumerate(matchscores):
        if m>0:
            plot([locs1[i][1],locs2[m][1]+cols1],[locs1[i][0],locs2[m][0]],'c')
    axis('off')
然后新建match_harris.py调用
import Harris_Detector
from pylab import *
from PIL import Image


im1 = array(Image.open(r"  ").convert("L"))
im2 = array(Image.open(r"  ").convert("L"))

wid =5
harrisim = Harris_Detector.compute_harris_response(im1,5)
filtered_coords1 = Harris_Detector.get_harris_points(harrisim,wid+1)
d1 = Harris_Detector.get_descriptors(im1,filtered_coords1,wid)

harrisim = Harris_Detector.compute_harris_response(im2,5)
filtered_coords2 = Harris_Detector.get_harris_points(harrisim,wid+1)
d2 = Harris_Detector.get_descriptors(im2,filtered_coords2,wid)

print('starting mathching')
matches = Harris_Detector.match_twosided(d1,d2)

figure()
gray()
Harris_Detector.plot_matches(im1,im2,filtered_coords1,filtered_coords2,matches)
show()
效果如下:

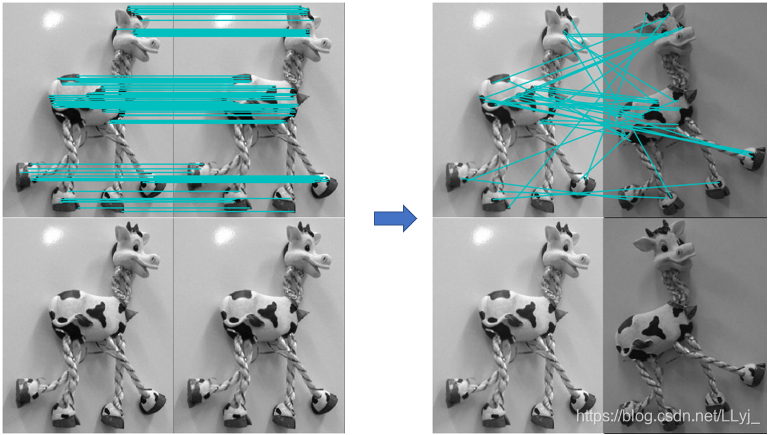
若匹配的图片完全一样,则可以发现,角点匹配完全正确。可是若照片中的目标发生了偏移,发现该算法存在一些不正确的匹配,是由于图像像素块的互相关矩阵具有较弱的描述性,在实际运用中,可以使用更加稳健的方法来处理这些对应匹配。


 5255
5255


 被折叠的 条评论
为什么被折叠?
被折叠的 条评论
为什么被折叠?
 到【灌水乐园】发言


