样式一(echarts)

<template>
	<div class="barContent">
		<div :id="props.chartclass" :style="{ width: '100%', height: '100%' }"></div>
	</div>
</template>
<script setup>
import {
markRaw,
onMounted,
ref,
watch,
onBeforeUnmount
} from "vue";
import * as echarts from "echarts";
const props = defineProps(["chartclass", "chartData"]);
let myChart = ref(null);
const resizeHandler = () => {
myChart.value.resize();
};
onMounted(() => {
let chartElement = document.getElementById(props.chartclass);
myChart.value = markRaw(echarts.init(chartElement));
initChart();
window.addEventListener("resize", resizeHandler);
});
onBeforeUnmount(() => {
window.removeEventListener("resize", resizeHandler);
myChart.value.dispose();
});
const initChart = () => {
switch (props.chartclass) {
case "wxfw":
initWxfw();
break;
}
};
const initWxfw = () => {
var data = {
myDate: ['12月', '1月', '2月', '3月', '4月'],
numA: [320, 388, 315, 368, 119],
numB: [320, 328, 357, 360, 113],
numC: [88, 86, 87, 91, 35],
};
var numD = [6, 6, 6, 6, 6];
var option = {
tooltip: {
trigger: 'axis',
backgroundColor: 'rgba(17,95,182,0.5)',
formatter(param) {
let html = ''
return html
},
textStyle: {
color: '#fff'
},
axisPointer: {
type: 'shadow',
textStyle: {
color: '#fff'
}
}
},
grid: {
borderWidth: 0,
top: '19%',
right: '5%',
bottom: '13%',
left: '10%',
textStyle: {
color: '#fff'
}
},
calculable: true,
legend: {
itemHeight: 6,
itemWidth: 12,
right: 14,
top: 6,
textStyle: {
color: '#fff'
}
},
xAxis: [{
type: 'category',
splitLine: {
show: false
},
axisTick: {
show: false
},
splitArea: {
show: false
},
axisLabel: {
interval: 0,
textStyle: {
color: 'rgba(255, 255, 255, 0.6)',
fontSize: '14px'
}
},
axisLine: {
show: false,
lineStyle: {
color: '#ffffff'
}
},
data: data.myDate
}],
yAxis: {
type: 'value',
name: '单位(吨)',
nameTextStyle: {
color: 'rgba(255, 255, 255, 0.6)',
fontSize: 14
},
axisLine: {
lineStyle: {
color: 'rgba(255, 255, 255, 0.4)',
width: 1,
type: 'solid'
},
show: true
},
splitLine: {
show: true,
lineStyle: {
color: 'rgba(255, 255, 255, 0.4)',
type: 'dashed'
}
},
axisLabel: {
textStyle: {
color: 'rgba(255, 255, 255, 0.6)',
fontSize: '13px'
}
},
axisTick: {
show: false
}
},
series: [{
name: '产出量',
type: 'bar',
stack: '1',
barMaxWidth: 24,
barGap: '10%',
itemStyle: {
normal: {
show: true,
color: new echarts.graphic.LinearGradient(
0,
0,
0,
1,
[{
offset: 0,
color: 'rgba(0, 133, 255, 0.53)'
},
{
offset: 1,
color: 'rgba(6, 124, 226, 0.21)'
}
],
false
),
barBorderRadius: 0
}
},
data: data.numA
},
{
name: '处置量',
type: 'bar',
stack: '2',
barMaxWidth: 24,
barGap: '10%',
itemStyle: {
normal: {
show: true,
color: new echarts.graphic.LinearGradient(
0,
0,
0,
1,
[{
offset: 0,
color: 'rgba(255, 199, 0, 0.53)'
},
{
offset: 1,
color: 'rgba(255, 199, 0, 0.21)'
}
],
false
),
barBorderRadius: 0
}
},
data: data.numB
},
{
name: '贮存量',
type: 'bar',
stack: '3',
barMaxWidth: 24,
barGap: '10%',
itemStyle: {
normal: {
show: true,
color: new echarts.graphic.LinearGradient(
0,
0,
0,
1,
[{
offset: 0,
color: 'rgba(18, 178, 82, 0.53)'
},
{
offset: 1,
color: 'rgba(18, 178, 82, 0.21)'
}
],
false
),
barBorderRadius: 0
}
},
data: data.numC
},
{
name: '',
type: 'bar',
stack: '1',
barMaxWidth: 24,
barGap: '10%',
itemStyle: {
normal: {
show: true,
color: new echarts.graphic.LinearGradient(
0,
0,
0,
1,
[{
offset: 0,
color: 'rgba(0, 133, 255, 1)'
},
{
offset: 1,
color: 'rgba(0, 133, 255, 1)'
}
],
false
),
barBorderRadius: 0
}
},
data: numD
},
{
name: '',
tooltip: {
show: false
},
type: 'bar',
stack: '2',
barMaxWidth: 24,
barGap: '10%',
symbolSize: ['20', '10'],
itemStyle: {
normal: {
show: true,
color: new echarts.graphic.LinearGradient(
0,
0,
0,
1,
[{
offset: 0,
color: 'rgba(255, 199, 0, 1)'
},
{
offset: 1,
color: 'rgba(255, 199, 0, 1)'
}
],
false
),
barBorderRadius: 0
}
},
data: numD
},
{
name: '',
type: 'bar',
stack: '3',
barMaxWidth: 24,
barGap: '10%',
itemStyle: {
normal: {
show: true,
color: new echarts.graphic.LinearGradient(
0,
0,
0,
1,
[{
offset: 0,
color: 'rgba(18, 178, 82, 1)'
},
{
offset: 1,
color: 'rgba(18, 178, 82, 1)'
}
],
false
),
barBorderRadius: 0
}
},
data: numD
},
{
type: 'pictorialBar',
tooltip: {
show: false
},
symbolRotate: '-45',
itemStyle: {
normal: {
color: new echarts.graphic.LinearGradient(0, 0, 1, 0, [{
offset: 0,
color: 'rgba(0, 133, 255, 0.31)'
},
{
offset: 1,
color: 'rgba(255, 255, 255, 0.31)'
}
])
}
},
symbolRepeat: 'fixed',
symbolMargin: -8,
symbol: 'rect',
symbolClip: true,
symbolSize: [2, 28],
symbolPosition: 'start',
symbolOffset: [-22, 10],
data: data.numA,
z: 66,
animationEasing: 'elasticOut'
},
{
type: 'pictorialBar',
tooltip: {
show: false
},
symbolRotate: '-45',
itemStyle: {
normal: {
color: new echarts.graphic.LinearGradient(0, 0, 1, 0, [{
offset: 0,
color: 'rgba(255, 199, 0, 0.31)'
},
{
offset: 1,
color: 'rgba(255, 255, 255, 0.31)'
}
])
}
},
symbolRepeat: 'fixed',
symbolMargin: -8,
symbol: 'rect',
symbolClip: true,
symbolSize: [2, 28],
symbolPosition: 'start',
symbolOffset: [0, 10],
data: data.numB,
z: 66,
animationEasing: 'elasticOut'
},
{
type: 'pictorialBar',
tooltip: {
show: false
},
symbolRotate: '-45',
itemStyle: {
normal: {
color: new echarts.graphic.LinearGradient(0, 0, 1, 0, [{
offset: 0,
color: 'rgba(18, 178, 82, 0.31)'
},
{
offset: 1,
color: 'rgba(18, 178, 82, 0.31)'
}
])
}
},
symbolRepeat: 'fixed',
symbolMargin: -8,
symbol: 'rect',
symbolClip: true,
symbolSize: [2, 28],
symbolPosition: 'start',
symbolOffset: [21, 10],
data: data.numC,
z: 66,
animationEasing: 'elasticOut'
}
]
}
myChart.value.setOption(option);
};
</script>
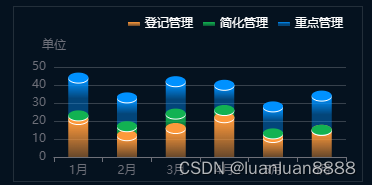
样式二(echarts)
<template>
	<div class="barContent">
		<div :id="props.chartclass" :style="{ width: '100%', height: '100%' }"></div>
	</div>
</template>
<script>
import * as echarts from "echarts";
import "echarts-gl";
export default {
name: "MyBarChart",
components: {},
props: ["chartclass", "chartData"],
data() {
return {
myChart: null
};
},
created() {
},
beforeCreate() {},
mounted() {
let _this = this;
let dom = _this.$refs.myChart;
_this.myChart = echarts.init(dom);
_this.$nextTick(() => {
_this.initChart();
setTimeout(() => {
}, 100);
});
},
methods: {
initChart() {
switch (this.chartclass) {
case "wryjg":
this.initWryjG();
break;
}
},
initWryjG() {
var colorList = ['#FE993B', '#12B252', '#0091FF'];
var colorList1 = [new echarts.graphic.LinearGradient(0, 0, 0, 1, [{
offset: 0,
color: '#FE993B'
},
{
offset: 0.5,
color: 'rgba(254,153,59,0.7)'
},
{
offset: 1,
color: 'rgba(254,153,59,0.4)'
}
]), new echarts.graphic.LinearGradient(0, 0, 0, 1, [{
offset: 0,
color: '#12B252'
},
{
offset: 0.5,
color: 'rgba(18,187,82,0.7)'
},
{
offset: 1,
color: 'rgba(18,187,82,0.4)'
}
]), new echarts.graphic.LinearGradient(0, 0, 0, 1, [{
offset: 0,
color: '#0091FF'
},
{
offset: 0.5,
color: 'rgba(0,145,255,0.4)'
},
{
offset: 1,
color: 'rgba(0,145,255,0.4)'
}
])]
var data = {
xAxisData: ['1月', '2月', '3月', '4月', '5月', '6月'],
unit: '单位',
data: [{
data: [120, 200, 150, 80, 70, 110],
name: '登记管理'
}, {
data: [10, 46, 64, 0, 0, 0],
name: '简化管理'
}, {
data: [15, 25, 70, 50, 20, 150],
name: '重点管理'
}, ]
};
let tempData = JSON.parse(JSON.stringify(data));
if (this.chartData && this.chartData.data.length) {
data = this.chartData;
tempData = JSON.parse(JSON.stringify(this.chartData));
}
var series = data.data.map((item, index) => {
return {
...item,
stack: 'a',
color: colorList[index],
barWidth: 20,
type: 'bar',
itemStyle: {
color: colorList1[index]
}
}
});
const stackInfo = {};
for (let i = 0; i < series[0].data.length; ++i) {
for (let j = 0; j < series.length; ++j) {
const stackName = series[j].stack;
if (!stackName) {
continue;
}
if (!stackInfo[stackName]) {
stackInfo[stackName] = {
stackStart: [],
stackEnd: []
};
}
const info = stackInfo[stackName];
const data1 = series[j].data[i];
if (data1 && data1 !== '-') {
if (info.stackStart[i] == null) {
info.stackStart[i] = j;
}
info.stackEnd[i] = j;
}
}
}
for (let i = 0; i < series.length; ++i) {
const data1 = series[i].data;
const info = stackInfo[series[i].stack];
for (let j = 0; j < series[i].data.length; ++j) {
const isEnd = info.stackEnd[j] === i;
const topBorder = isEnd ? 20 : 0;
const bottomBorder = 0;
data1[j] = {
value: data1[j],
itemStyle: {
}
};
}
}
let tempSeries = JSON.parse(JSON.stringify(series));
for (var i = 0; i < tempData.data.length; i++) {
series.push({
name: tempData.data[i].name,
symbolOffset: [0, -6],
tooltip: {
show: false
},
type: 'pictorialBar',
itemStyle: {
normal: {
color: '#fff'
}
},
symbol: 'circle',
symbolSize: ['20', '10'],
symbolPosition: 'end',
data: this.getDataArraySum(tempData.data, i),
z: 3
})
series.push({
name: tempData.data[i].name,
symbolOffset: [0, -7],
tooltip: {
show: false
},
type: 'pictorialBar',
itemStyle: {
normal: {
color: colorList[i]
}
},
symbol: 'circle',
symbolSize: ['20', '10'],
symbolPosition: 'end',
data: this.getDataArraySum(tempData.data, i),
z: 3
})
}
this.myChart.setOption({
grid: {
right: 16,
left: 40
},
xAxis: {
type: 'category',
data: data.xAxisData
},
legend: {
itemHeight: 4,
itemWidth: 12,
backgroundColor: colorList,
right: 14,
top: 6,
textStyle: {
color: "#fff",
}
},
yAxis: {
type: 'value',
name: data.unit,
splitLine: {
lineStyle: {
color: 'rgba(255,255,255,0.2)'
}
}
},
series: series
});
},
getDataArraySum(data, dataIndex) {
debugger
let res = data[0].data;
for (var i = 0; i < dataIndex; i++) {
res = res.map((value, index) => value + data[i + 1].data[index]);
}
return res
}
},
computed: {},
watch: {
chartData: {
handler: function(val, oldVal) {
this.initChart();
},
deep: true
}
}
};
</script>
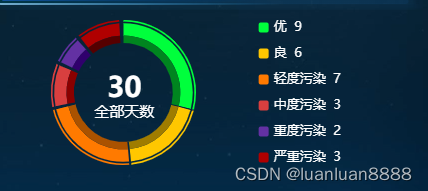
样式三(echarts)
<template>
	<div class="barContent">
		<div :id="props.chartclass" :style="{ width: '100%', height: '100%' }"></div>
	</div>
</template>
<script setup>
import {
markRaw,
onMounted,
ref,
watch,
onBeforeUnmount
} from "vue";
import * as echarts from "echarts";
const props = defineProps(["chartclass", "chartData"]);
let myChart = ref(null);
const resizeHandler = () => {
myChart.value.resize();
};
onMounted(() => {
let chartElement = document.getElementById(props.chartclass);
myChart.value = markRaw(echarts.init(chartElement));
initChart();
window.addEventListener("resize", resizeHandler);
});
onBeforeUnmount(() => {
window.removeEventListener("resize", resizeHandler);
myChart.value.dispose();
});
const initChart = () => {
switch (props.chartclass) {
case "kqzl":
initKqzl();
break;
}
};
const initKqzl = () => {
const colorList1 = ["#00FF3C", "", "#FFC700", "", "#FF7A00", "", "#D83F3F", "", "#6331A3", "", "#B00000", ""];
const colorList2 = ["#00FF3C", "", "#FFC700", "", "#FF7A00", "", "#D83F3F", "", "#6331A3", "", "#B00000", ""];
const colorList3 = ["#00851F ", "", "#9F7C00", "", "#AA5200", "", "#8A0000", "", "#30006D", "", "#550000", ""];
let legendData = [],
sum = 0,
data1 = [];
var dataArr = [{
value: 9,
name: "优"
},
{
value: 6,
name: "良"
},
{
value: 7,
name: "轻度污染"
},
{
value: 3,
name: "中度污染"
},
{
value: 2,
name: "重度污染"
},
{
value: 3,
name: "严重污染"
},
];
dataArr.forEach((item) => {
legendData.push(item.name);
sum += Number(item.value || 0);
const _item = { ...item
};
if (!_item.value) {
_item.value = sum / 100;
}
data1.push(_item, {
name: "",
value: sum / 100,
label: {
show: false
},
itemStyle: {
color: "transparent",
},
});
});
var option = {
tooltip: {
trigger: "item",
},
title: [
{
left:'center',
text:'30',
top: "36.5%",
left: "25%",
textStyle: {
color: "#fff",
fontSize: 28,
fontWeight: 600,
},
itemGap: 5,
},
{
left:'center',
text:' 全部天数',
top: "55%",
left: "21%",
textStyle: {
color: "#fff",
fontSize: 15,
fontWeight: 400,
},
}
],
legend: {
orient: "vertical",
right: "18%",
top: "middle",
itemWidth: 10,
itemHeight: 10,
textStyle: {
color: "#ffffff",
fontSize: 13,
lineHeight: 16,
rich: {
text: {
fontSize: 13,
},
number: {
fontSize: 13,
fontWeight: "normal",
},
unit: {
fontSize: 13,
color: "#00C2FF",
},
},
},
data: legendData,
formatter(name) {
const newData = dataArr;
let tarValue = 0;
let total = 0;
for (let i = 0; i < newData.length; i++) {
total += newData[i].value;
if (newData[i].name === name) {
tarValue = newData[i].value;
}
}
var percert = total == 0 ? 0 : ((tarValue / total) * 100).toFixed(2);
const arr = name + " " + tarValue;
return `{text|${name}} {number|${tarValue}}`;
},
},
series: [{
type: "pie",
radius: ["86%", "88%"],
center: ["30%", "50%"],
minAngle: 0,
labelLine: {
show: false,
},
label: {
show: false,
alignTo: "labelLine",
position: "outside",
rich: {
name: {
color: "#ffffff",
fontSize: 12,
fontWeight: 400,
padding: [0, 0, 0, 10],
},
zb: {
color: "#fff",
fontWeight: 400,
fontSize: 12,
align: "left",
padding: [14, 0, 0, 24],
},
dot: {
backgroundColor: "auto",
width: 14,
height: 14,
padding: [0, 0, 0, 0],
verticalAlign: "top",
},
},
formatter: (params) => {
const x = params.dataIndex;
return "{dot|}" + "{name|" + params.data.name + "}" + "\n" + "{zb|" + params.data.value + "}";
},
},
itemStyle: {
normal: {
color: function(params) {
return colorList1[params.dataIndex];
},
},
},
data: data1,
z: 666,
},
{
type: "pie",
radius: ["69%", "84%"],
center: ["30%", "50%"],
hoverAnimation: false,
minAngle: 0,
emphasis: {
scale: false
},
label: {
show: false,
},
itemStyle: {
normal: {
color: function(params) {
return colorList2[params.dataIndex];
},
},
},
data: data1,
z: 1,
},
{
type: "pie",
radius: ["60%", "69%"],
center: ["30%", "50%"],
hoverAnimation: false,
minAngle: 0,
emphasis: {
scale: false
},
label: {
show: false,
},
itemStyle: {
normal: {
color: function(params) {
return colorList3[params.dataIndex];
},
},
},
data: data1,
z: 1,
},
],
};
myChart.value.setOption(option);
};
</script>
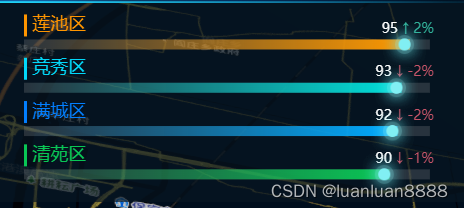
样式四(echarts)
<template>
  <div class="barContent">
    <div :id="props.chartclass" :style="{ width: '100%', height: '100%' }"></div>
  </div>
</template>
<script setup>
import { markRaw, onMounted, ref, watch, onBeforeUnmount } from "vue";
import * as echarts from "echarts";
const props = defineProps(["chartclass", "chartData"]);
let myChart = ref(null);
const resizeHandler = () => {
myChart.value.resize();
};
onMounted(() => {
let chartElement = document.getElementById(props.chartclass);
myChart.value = markRaw(echarts.init(chartElement));
initChart();
window.addEventListener("resize", resizeHandler);
});
onBeforeUnmount(() => {
window.removeEventListener("resize", resizeHandler);
myChart.value.dispose();
});
const initChart = () => {
switch (props.chartclass) {
case "kqzl":
initkqzl();
break;
case "jkzs":
initjkzs();
break;
case "kqrb":
initkqrb();
break;
}
};
const initkqzl = () => {
var data = [
{
name: "莲池区",
value: 95,
sum: 2,
},
{
name: "竞秀区",
value: 93,
sum: -2,
},
{
name: "满城区",
value: 92,
sum: -2,
},
{
name: "清苑区",
value: 90,
sum: -1,
},
];
var colorArr = [
new echarts.graphic.LinearGradient(1, 0, 0, 0, [
{
offset: 1,
color: "#FF990000",
},
{
offset: 0,
color: "#FF9900",
},
]),
new echarts.graphic.LinearGradient(1, 0, 0, 0, [
{
offset: 1,
color: "#00E0DB00",
},
{
offset: 0,
color: "#00E0DB",
},
]),
new echarts.graphic.LinearGradient(1, 0, 0, 0, [
{
offset: 1,
color: "#00AAFF00",
},
{
offset: 0,
color: "#00AAFF",
},
]),
new echarts.graphic.LinearGradient(1, 0, 0, 0, [
{
offset: 1,
color: "#09C75500",
},
{
offset: 0,
color: "#09C755",
},
]),
];
data = data.sort((a, b) => {
return b.value - a.value;
});
var option = {
grid: {
top: "10%",
bottom: -15,
right: 0,
left: 40,
containLabel: true,
},
xAxis: {
show: false,
},
yAxis: [
{
triggerEvent: true,
show: true,
inverse: true,
data: getArrByKey(data, "name"),
axisLine: {
show: false,
},
splitLine: {
show: false,
},
axisTick: {
show: false,
},
axisLabel: {
show: false,
},
},
{
triggerEvent: true,
show: true,
inverse: true,
data: getArrByKey(data, "name"),
axisLine: {
show: false,
},
splitLine: {
show: false,
},
axisTick: {
show: false,
},
axisLabel: {
show: true,
interval: 0,
shadowOffsetX: "-20px",
color: "#FF9023",
align: "right",
verticalAlign: "bottom",
lineHeight: 30,
fontSize: 13,
formatter: function (value, index) {
if (data[index].sum > 0) {
return ` {color1|${data[index].value}}{value1|${" ↑ " + data[index].sum + "%"}} `;
} else {
return ` {color1|${data[index].value}}{value2|${" ↓ " + data[index].sum + "%"}} `;
}
},
rich: {
lg1: {
backgroundColor: " #D6FBE61A",
align: "center",
width: 3,
height: 22,
},
color1: {
color: "#fff",
fontSize: 14,
},
value1: {
color: "#31B099",
fontSize: 14,
},
value2: {
color: "#C65468",
fontSize: 14,
},
},
},
},
],
series: [
{
name: "XXX",
type: "pictorialBar",
symbol:
"image://data:image/png;base64,iVBORw0KGgoAAAANSUhEUgAAADoAAAA6CAMAAADWZboaAAAAZlBMVEUAAABe3uVe3+Vf3uVf3+Zf3uVg3+Zg3+Zf3+Vi4OZh4OZg3+Z86/Bh3+Zi4Odj4Odi4OZ86/B76/B86/Bj4ed56+9x5+xn4umB7/N87PB36e+A7/N+7fF/7vJ/7vJ+7fGA7/OB7/PReX+lAAAAIXRSTlMABQkVDREmIhk3MR10LEFFPHh7cUprXE35h2XnqMLAp+mHAG9cAAAB5ElEQVRIx83WjU7CMBQFYIoiKMqU/XUboHv/l/Tce7t2XamDNSacETEmX86tlK2rx4py150o+MstMBLwWRfHKo6JCVxLnvmFGBjFQ58oF1//sUZhGy/ClSTWObgnL4O+bkeN4nY2okfNMbkRt9/vtxz8InoTsWplJSCzFxPmO8+GpSIByX3YQAuGDWtRKhKjCnxDXhF6Z4yxnZ20Wgko7BMRDmxtSGVaI4kdTIgb+zTYoJQlIMlDlmUFgrcDWWC201qSayqlTkiCddWWeV62VU0YlnpRi9VOKaSUsiyq/N0krwq2Ugt7lVpZl5BfHNiytjagMi+XYp0kCR45hMlivVQrE/uU5pXSrCB5bM6d1t2lOZItMqmliT3q5uVxqxzyW/ccfYLNKx7ZTeykMvNyac2yt2Fbc61MHLSC0rwoxbiNdlQ3GBm1NLHQsHUrtEXppR/ljNpW6DbSCoqlFiVoN6YdaFlgsSFVPs1BdT8OaB5QyQzVcaqWDows/zepxR8ObLglTrdtCRVuRNj4Rrxh+//0ke2f8KVL+Kon3GCSbmsJN9OUW3j6g0Ns+LgCij2u0h+Sghc8mlMPBMgdx5DFh59VmOVHrvmDnoNxCz3J7MFWsMuaLyR089xz/xhlfijvwutR8gv3zk6BLUUeCgAAAABJRU5ErkJggg==",
symbolSize: [50, 50],
symbolOffset: [20, 0],
z: 12,
itemStyle: {
normal: {
color: function (params) {
var num = colorArr.length;
return colorArr[params.dataIndex % num];
},
},
},
data: getSymbolData(data),
},
{
name: "条",
type: "bar",
showBackground: true,
barBorderRadius: 30,
yAxisIndex: 0,
data: data,
barWidth: 10,
itemStyle: {
normal: {
color: function (params) {
var num = colorArr.length;
return colorArr[params.dataIndex % num];
},
},
barBorderRadius: 4,
},
label: {
normal: {
color: "#fff",
show: true,
position: [0, "-25px"],
textStyle: {
fontSize: 18,
},
formatter: function (a, b) {
return `{lg` + (a.dataIndex + 1) + `|} {color` + (a.dataIndex + 1) + `|${a.name}}`;
},
rich: {
lg1: {
backgroundColor: "#ff9500",
align: "center",
width: 3,
height: 22,
},
color1: {
color: "#ff9500",
fontSize: 18,
},
value1: {
color: "#ff9500",
fontSize: 18,
align: "right",
},
lg2: {
backgroundColor: "#02d8f9",
align: "center",
width: 3,
height: 22,
},
color2: {
color: "#02d8f9",
fontSize: 18,
},
lg3: {
backgroundColor: "#027fff",
align: "center",
width: 3,
height: 22,
},
color3: {
color: "#027fff",
fontSize: 18,
},
lg4: {
backgroundColor: "#09C755",
align: "center",
width: 3,
height: 22,
},
color4: {
fontSize: 18,
color: "#09C755",
},
},
},
},
},
],
};
myChart.value.setOption(option);
};
const getArrByKey = (data, k) => {
let key = k || "value";
let res = [];
if (data) {
data.forEach(function (t) {
res.push(t[key]);
});
}
return res;
};
const getSymbolData = (data) => {
let arr = [];
for (var i = 0; i < data.length; i++) {
arr.push({
value: data[i].value,
symbolPosition: "end",
});
}
return arr;
};
watch(props.chartData, (val, oldVal) => {
initChart();
});
</script
<style>
.barContent {
height: 100%;
width: 100%;
}
</style>
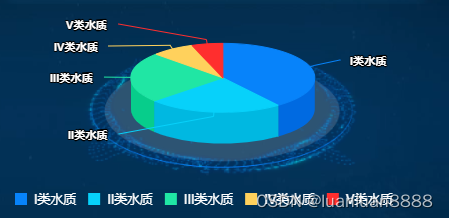
样式五(使用highCharts)
/* 使用highCharts*/
<template>
<div id="container" :style="{ width: '100%', height: '100%' }"></div>
<div class="bg"></div>
</template>
<script>
import {
reactive,
toRefs,
ref,
onMounted
} from 'vue'
import Highcharts from 'highcharts'
import Highcharts3D from 'highcharts/highcharts-3d'
import backgrounCharts from '../../assets/HomeView/backgrounCharts.png'
Highcharts3D(Highcharts)
export default {
setup() {
let pie = ref('')
let state = reactive({})
onMounted(() => {
let colors = ['#0783FA', '#07D1FA', '#20E6A4', '#FFD15C', '#FF2E2E']
Highcharts.setOptions({
colors: colors
})
Highcharts.chart(
'container', {
credits: {
enabled: false,
},
chart: {
spacing: [20, 0, 20, 0],
options3d: {
enabled: true,
alpha: 68
},
backgroundColor: "rgba(0, 0, 0, 0)",
style: {
marginBottom: 0,
},
},
legend: {
itemStyle: {
color: "#999",
fontSize: 10,
},
left: "center",
itemWidth: 10,
selectedMode: false,
data: ['I类水质', 'II类水质', 'III类水质', 'IV类水质', 'V类水质']
},
title: {
text: ''
},
tooltip: {
pointFormat: '{series.name}: <b>{point.percentage:.1f}%</b>'
},
plotOptions: {
pie: {
allowPointSelect: true,
cursor: 'pointer',
depth: 45,
dataLabels: {
enabled: true,
distance: 22,
format: '{point.name}'
}
}
},
legend: {
enabled: true,
itemHoverStyle: {
color: '#fff'
},
itemStyle: {
color: '#fff'
},
symbolRadius: 0,
itemDistance: 10,
align: 'left',
floating: true,
y: 20,
},
series: [{
size: '126%',
center: ["51%", "26%"],
type: 'pie',
name: '占比',
showInLegend: true,
data: [
['I类水质', 45.0],
['II类水质', 26.8],
['III类水质', 26.8],
['IV类水质', 8.5],
['V类水质', 6.2],
]
}]
},
)
})
return {
...toRefs(state),
pie
}
}
}
</script>
<style lang="scss" scoped>
:deep #container>div>svg>.highcharts-background {
fill: rgb(255, 0, 0, 0) !important;
}
.pie {
width: 100%;
height: 100%;
}
.bg {
z-index: -1;
width: 66%;
height: 70%;
margin-top: -42%;
margin-left: 18%;
position: relative;
background-image: url("../../assets/HomeView/backgrounCharts.png");
background-size: 100% 100%;
}
</style>
样式六(使用eCharts)

<template>
	<div class="barContent">
		<div :id="props.chartclass" :style="{ width: '100%', height: '100%' }"></div>
	</div>
</template>
<script setup>
import {
markRaw,
onMounted,
ref,
watch,
onBeforeUnmount
} from "vue";
import * as echarts from "echarts";
const props = defineProps(["chartclass", "chartData"]);
let myChart = ref(null);
const resizeHandler = () => {
myChart.value.resize();
};
onMounted(() => {
let chartElement = document.getElementById(props.chartclass);
myChart.value = markRaw(echarts.init(chartElement));
initChart();
window.addEventListener("resize", resizeHandler);
});
onBeforeUnmount(() => {
window.removeEventListener("resize", resizeHandler);
myChart.value.dispose();
});
const initChart = () => {
switch (props.chartclass) {
case "kqzl":
initKqzl();
break;
}
};
const initKqzl = () => {
var option = {
series: [{
type: 'gauge',
radius: 56,
progress: {
show: true,
width: 8
},
axisTick: {
show: false,
},
axisLine: {
lineStyle: {
width: 16
}
},
splitLine: {
show: false,
},
itemStyle: {
color: new echarts.graphic.LinearGradient(0, 0, 0, 1, [{
offset: 0,
color: '#f9ab05'
},
{
offset: 0.5,
color: '#90ce5b'
},
{
offset: 1,
color: '#05fdcd'
}
])
},
detail: {
valueAnimation: true,
width: '60%',
lineHeight: 40,
borderRadius: 8,
offsetCenter: [0, '-5%'],
fontSize: 20,
fontWeight: 'bolder',
formatter: 'PM2.5',
color: '#fff'
},
pointer: {
show: false,
},
title: {
offsetCenter: [0, '60%'],
textStyle: {
fontWeight: 'bolder',
fontSize: 14,
color: '#235C8A'
}
},
data: [{
value: 30,
name: '',
title: {
fontSize: 14,
color: '#fff',
}
}]
}]
}
myChart.value.setOption(option);
};
</script>
<style>
.barContent {
height: 100%;
width: 100%;
}
</style>
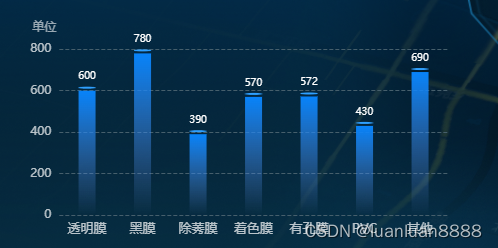
样式七(使用eCharts)
<template>
<div ref="myChart" :chartData="chartData" :id="id" :class="className" :style="{ height: height, width: width }" />
</template>
<script>
import * as echarts from "echarts";
export default {
props: {
className: {
type: String,
default: "chart",
},
id: {
type: String,
default: "chart",
},
width: {
type: String,
default: "10rem",
},
height: {
type: String,
default: "10rem",
},
chartData: {
type: Array,
default: null,
},
},
data() {
return {
chart: null,
};
},
created() {
this.$nextTick(() => {
setTimeout(() => {
this.getDataFun();
}, 300);
});
},
mounted() {
let _this = this;
this.chart = echarts.init(document.getElementById(this.id));
window.addEventListener("resize", function () {
if (this.chart) { }
setTimeout(() => {
console.log(_this.chart)
_this.chart.clear();
_this.chart.resize({});
_this.getDataFun();
}, 300);
});
},
beforeDestroy() {
if (!this.chart) {
return;
}
this.chart.dispose();
this.chart = null;
},
watch: {
chartData: {
handler: function (val) {
if (val) {
this.getDataFun();
}
},
deep: true,
}
},
methods: {
getDataFun() {
const resultData = [
{ value: 600, name: '透明膜' },
{ value: 780, name: '黑膜' },
{ value: 390, name: '除莠膜' },
{ value: 570, name: '着色膜' },
{ value: 572, name: '有孔膜' },
{ value: 430, name: 'PVC' },
{ value: 690, name: '其他' },
]
this.chart.setOption({
dataZoom: [
{
type: 'slider',
height: 0,
zoomLock: true,
realtime: true,
show: false,
startValue: 0,
endValue: 10,
},
],
tooltip: {
trigger: 'axis',
formatter(param) {
let html = ''
if (param.length > 0) {
const { value, marker } = param[0]
html += `${marker}${value.name}:${value.value}个`
}
return html
},
},
grid: {
top: '25%',
bottom: '0%',
left: '5%',
right: '5%',
containLabel: true,
},
dataset: [
{
source: resultData,
dimensions: ['name', 'value'],
},
],
xAxis: [
{
type: 'category',
axisLabel: {
interval: 0,
color: 'rgba(255, 255, 255, 0.72)',
fontSize: 13,
rotate: this.xRotate ? this.xRotate : 0,
formatter(val) {
const name = val.length > 6 ? `${val.substr(0, 5)}..` : val
return name
},
},
axisLine: {
show: false,
lineStyle: {
color: 'rgba(255, 255, 255, 0.4)',
},
},
axisTick: {
show: false,
},
axisPointer: {
type: 'shadow',
},
},
],
yAxis: [
{
name: '单位',
type: 'value',
nameTextStyle: {
color: 'rgba(255, 255, 255, 0.60)',
padding: [0, 0, 0, -30],
},
axisTick: {
show: false,
},
axisLine: {
show: false,
lineStyle: {
color: 'rgba(255, 255, 255, 0.4)',
},
},
axisLabel: {
interval: 0,
color: 'rgba(255, 255, 255, 0.72)',
},
splitLine: {
show: true,
lineStyle: {
type: 'dashed',
color: '#465F6C ',
},
},
},
],
series: [
{
name: '',
type: 'bar',
barWidth: 17,
barGap: '0%',
itemStyle: {
normal: {
color: {
x: 0,
y: 0,
x2: 0,
y2: 1,
type: 'linear',
global: false,
colorStops: [
{ offset: 1, color: '#6C95E600' },
{ offset: 0, color: '#0783FAff' },
],
},
},
},
encode: {
x: 'name',
y: 'value',
},
},
{
name: '',
type: 'pictorialBar',
symbolSize: [17, 2],
symbolOffset: [0, -4],
symbolPosition: 'end',
label: {
show: true,
position: 'top',
textStyle: {
fontSize: 10,
color: '#fff',
},
},
itemStyle: {
normal: {
color: '#2FA0FF',
},
},
encode: {
x: 'name',
y: 'value',
},
},
],
});
},
},
};
</script>


 4469
4469


 被折叠的 条评论
为什么被折叠?
被折叠的 条评论
为什么被折叠?
 到【灌水乐园】发言


