


公众号【深度学习视觉】
第一博客
前言:4点坐标排序+画图+旋转
cv2画图
import numpy as np
import cv2
import matplotlib.pyplot as plt
%matplotlib inline

color=(255, 0, 0)
thickness=1

box = [20,30,70,30,100,50,50,50]
x1, y1, x2, y2, x3, y3, x4, y4 = box[:8]
newBox = [[x1, y1], [x2, y2], [x3, y3], [x4, y4]]
# 如果坐标点需要排序则使用下面函数。
# newBox = sortCoordinate(box)
img = np.zeros([120, 120], dtype = np.uint8)
point = np.array(newBox).astype(int)
cv2.line(img, tuple(point[0]), tuple(point[1]), color, thickness)
cv2.line(img, tuple(point[1]), tuple(point[2]), color, thickness)
cv2.line(img, tuple(point[2]), tuple(point[3]), color, thickness)
cv2.line(img, tuple(point[3]), tuple(point[0]), color, thickness)

## 图片转三通道
image = np.expand_dims(img, axis=2)
image = np.concatenate((image, image, image), axis=-1)

# 图片显示方法二选一
matplotShow(image)
cv2Show(image)
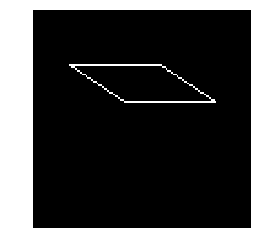
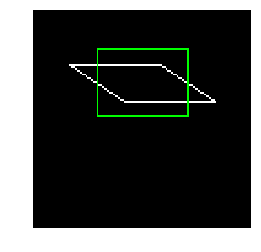
画出平行四边形所对应的矩形
def boxAngle(box):
    """
    得到旋转中心坐标,与旋转角度
    :return angle: 平行四边形转为矩形需要的角度
    :return cx, cy: 中心坐标
    """
    x1, y1, x2, y2, x3, y3, x4, y4 = box[:8]
    cx = (x1 + x3 + x2 + x4) / 4.0
    cy = (y1 + y3 + y4 + y2) / 4.0
    w = (np.sqrt((x2 - x1) ** 2 + (y2 - y1) ** 2) + np.sqrt((x3 - x4) ** 2 + (y3 - y4) ** 2)) / 2
    h = (np.sqrt((x2 - x3) ** 2 + (y2 - y3) ** 2) + np.sqrt((x1 - x4) ** 2 + (y1 - y4) ** 2)) / 2

    sinA = (h * (x1 - cx) - w * (y1 - cy)) * 1.0 / (h * h + w * w) * 2
    angle = np.arcsin(sinA)

    return angle, w, h, cx, cy

angle, w, h, cx, cy = boxAngle(box)
cv2.rectangle(image, (int(cx-w/2),int(cy-h/2)), (int(cx+w/2),int(cy+h/2)), (0,255,0), 1)
# 图片显示方法二选一
matplotShow(image)
cv2Show(image)
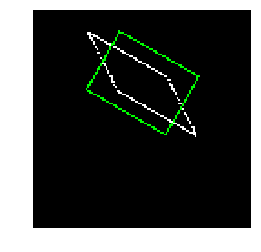
旋转平行四边形
from PIL import Image
def rotate(image,box,leftAdjustAlph=0.0,rightAdjustAlph=0.0):
    """
    需要用到boxAngle函数,得到旋转中心与旋转角度
    """

    angle, w, h, cx, cy = boxAngle(box)
    im = Image.fromarray(image)
    degree_ = angle*180.0/np.pi

    box = (max(1,cx-w/2-leftAdjustAlph*(w/2))##xmin
           ,cy-h/2,##ymin
           min(cx+w/2+rightAdjustAlph*(w/2),im.size[0]-1)##xmax
           ,cy+h/2)##ymax
    newW = box[2]-box[0]
    newH = box[3]-box[1]
    # 新box的信息
    box = {'cx':cx,'cy':cy,'w':newW,'h':newH,'degree':degree_,}

    im = im.rotate(degree_,center=(cx,cy))#.crop(box)

    return im

image = rotate(image,box)

# 图片显示方法二选一
matplotShow(image)
cv2Show(image)


 3141
3141


 被折叠的 条评论
为什么被折叠?
被折叠的 条评论
为什么被折叠?
 到【灌水乐园】发言


