


文氏图(英语:Venn diagram),或译Venn图、 [1] 温氏图、维恩图、范氏图,是在所谓的集合论(或者类的理论)数学分支中,在不太严格的意义下用以表示集合(或类)的一种草图。它们用于展示在不同的事物群组(集合)之间的数学或逻辑联系,尤其适合用来表示集合(或)类之间的“大致关系”,它也常常被用来帮助推导(或理解推导过程)关于集合运算(或类运算)的一些规律。
John Venn 是十九世纪英国的哲学家和数学家,他在 1881年发明了文氏图。在剑桥大学的 Caius 学院的彩色玻璃窗上有对他的这个发明的纪念。
例子
library(ggVennDiagram)
library(ggplot2)
genes <- paste0("gene",1:1000)
set.seed(20210701)
gene_list <- list(A = sample(genes,100),
B = sample(genes,200),
C = sample(genes,300),
D = sample(genes,200))
# construct a Venn object
venn = Venn(gene_list)
data = process_data(venn, shape_id == "402")
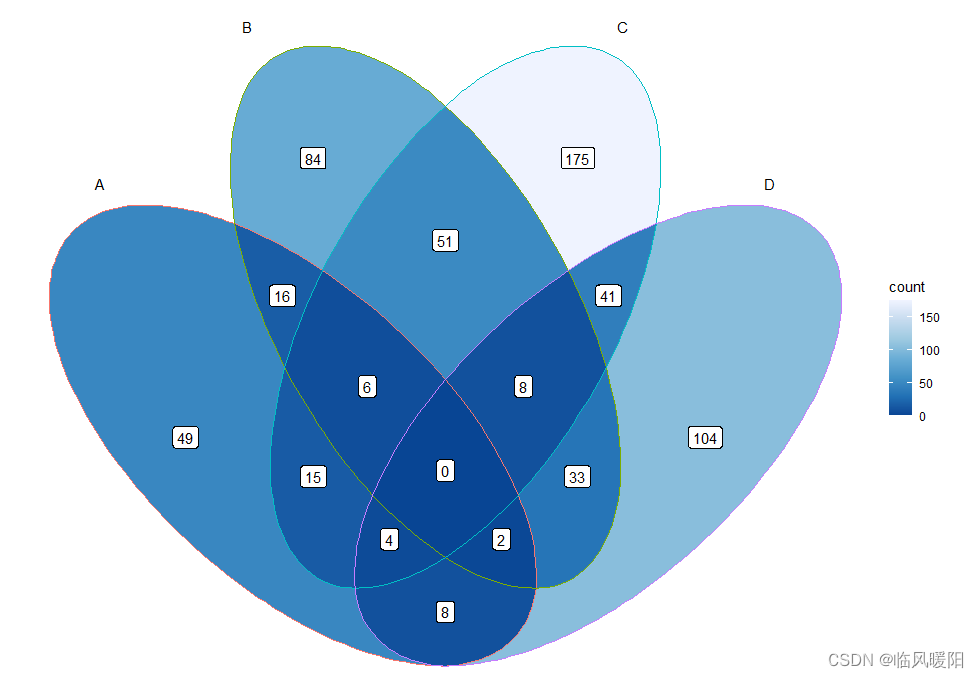
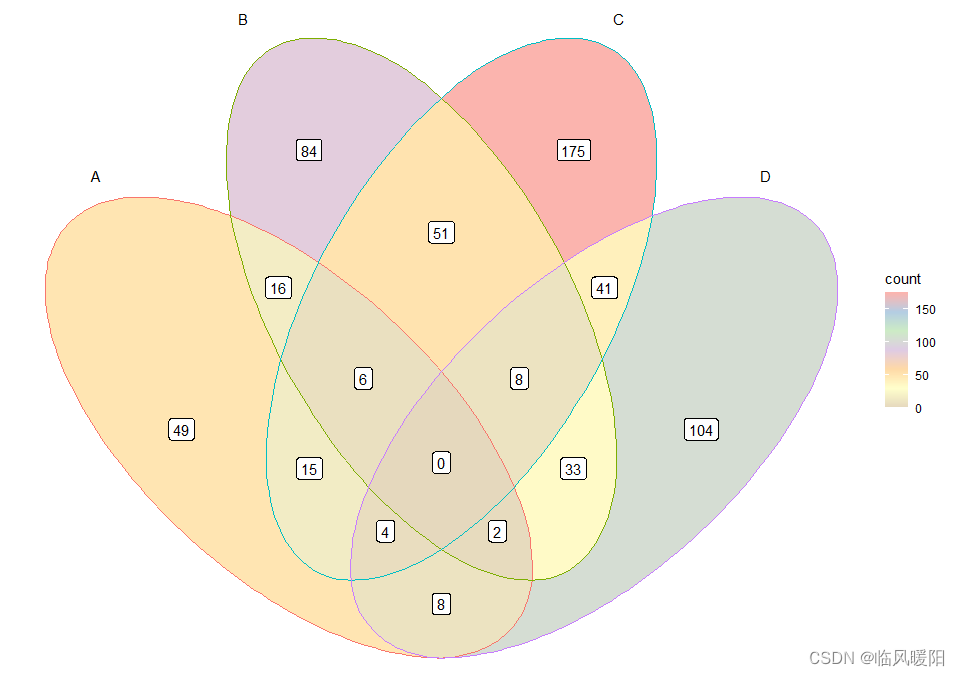
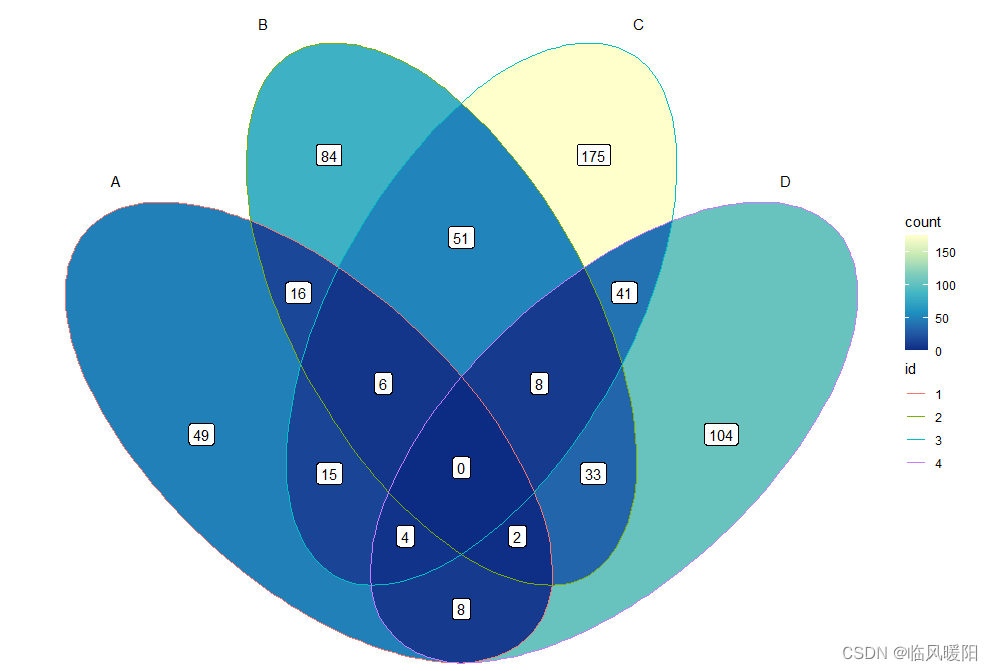
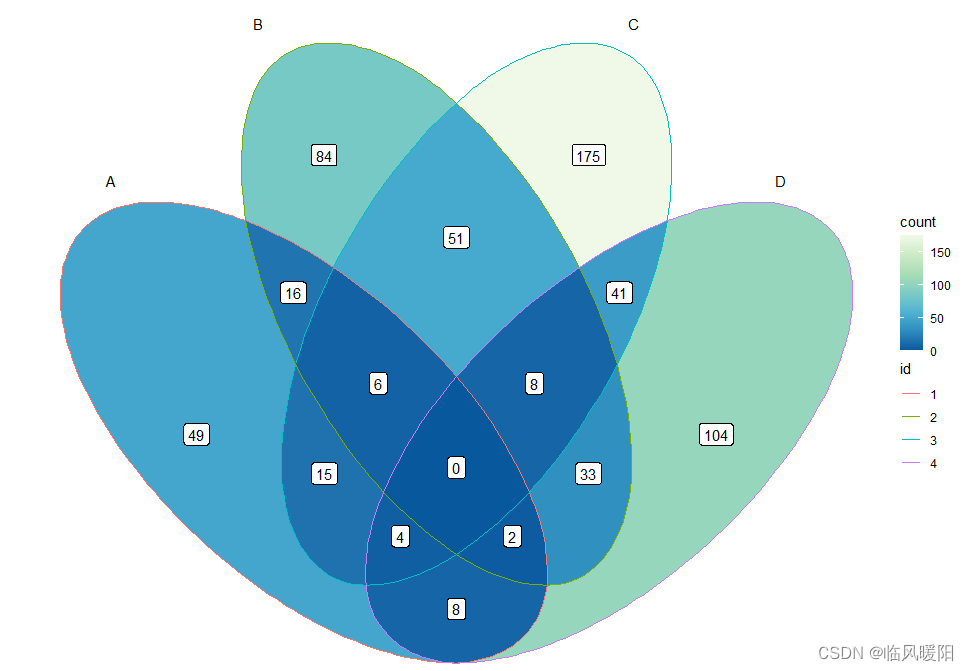
ggplot() +
geom_sf(aes(fill = count), data = venn_region(data)) +
geom_sf(aes(color = id), data = venn_setedge(data), show.legend = FALSE) +
geom_sf_text(aes(label = name), data = venn_setlabel(data)) +
geom_sf_label(aes(label = count), data = venn_region(data)) +
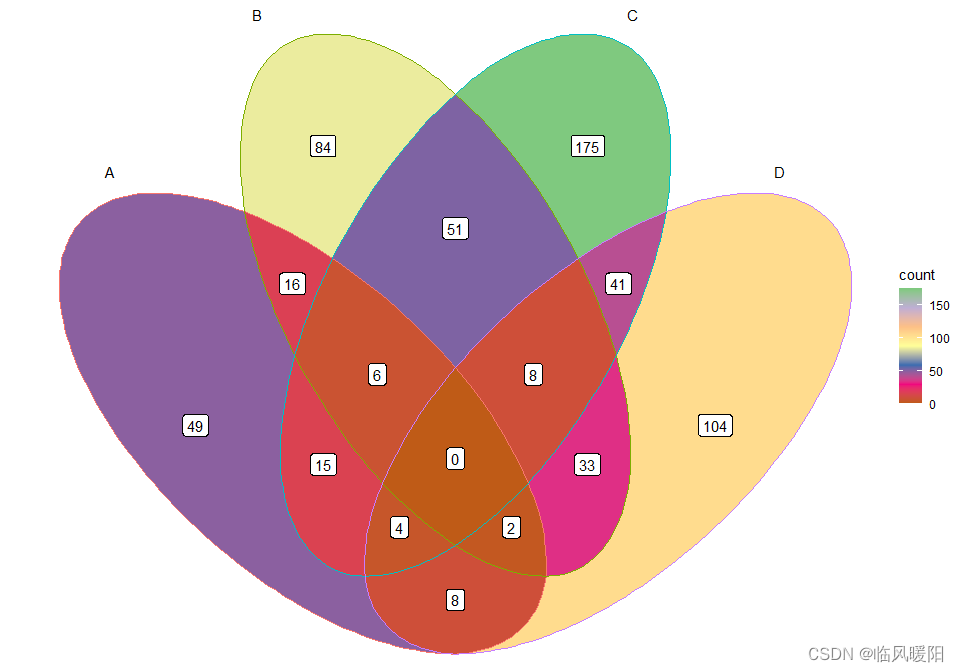
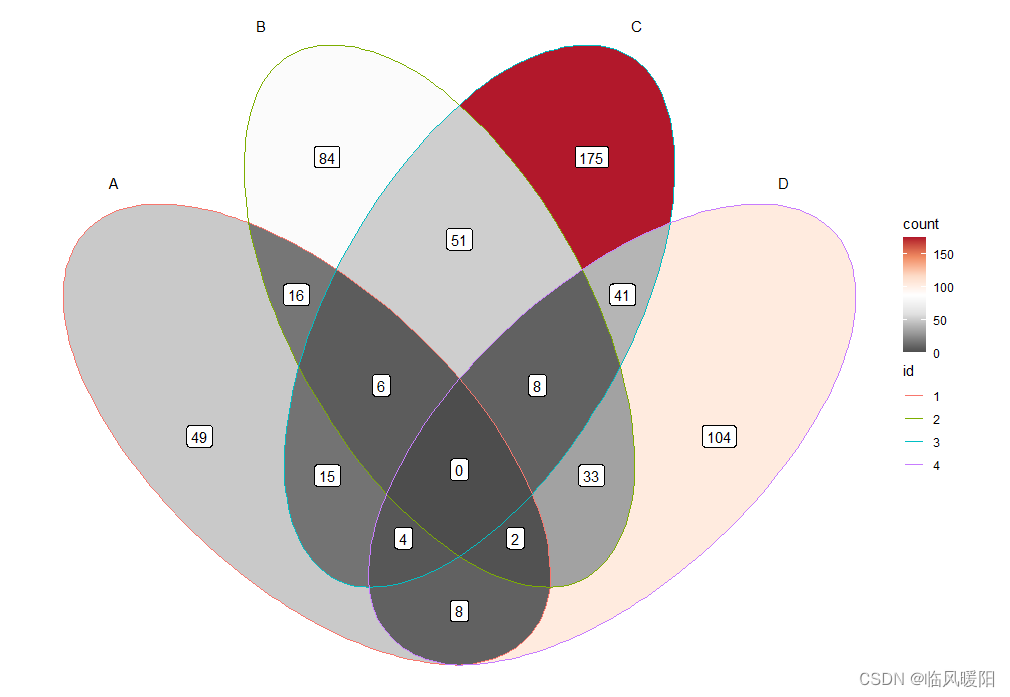
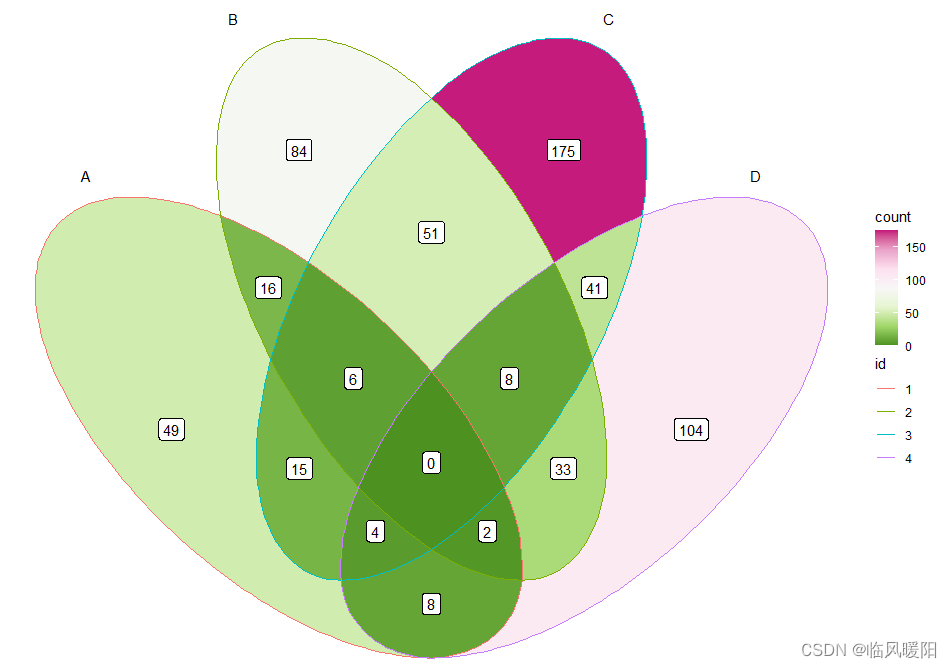
theme_void()+ scale_fill_distiller(palette = "Blues")
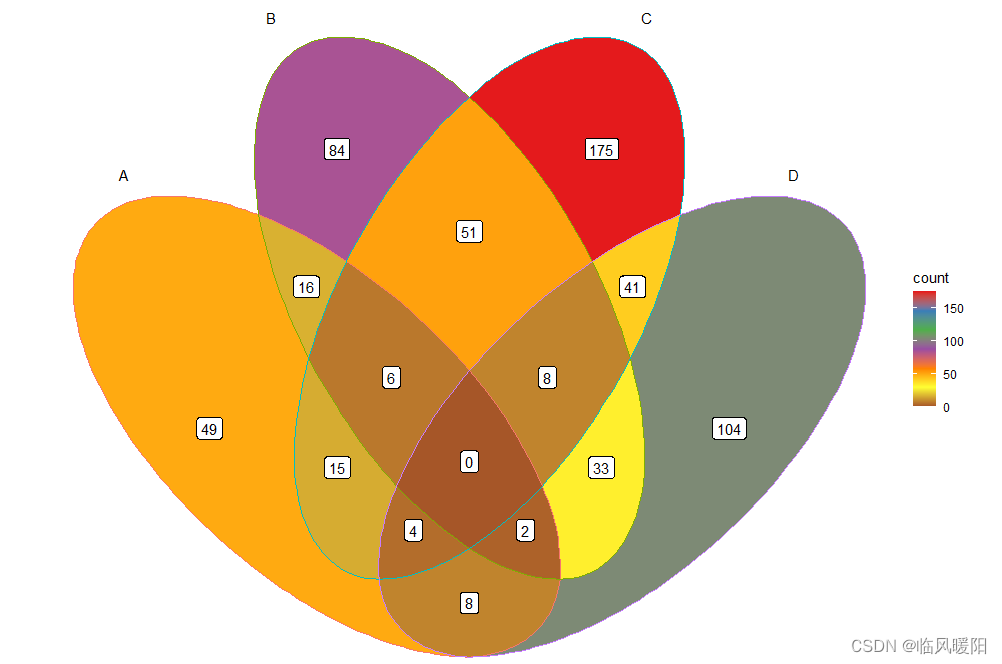
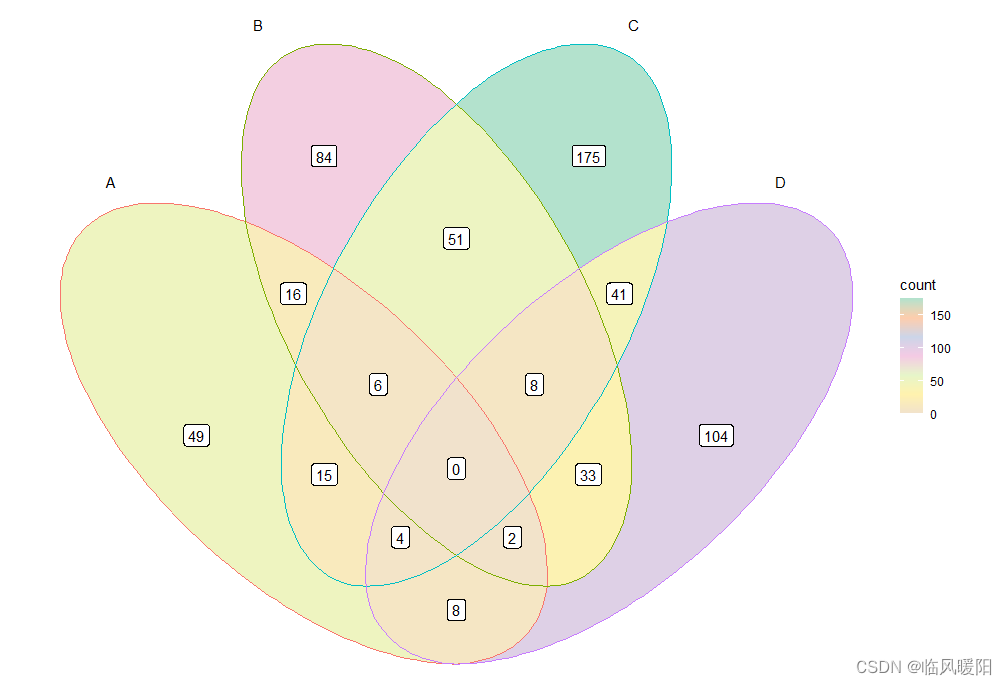
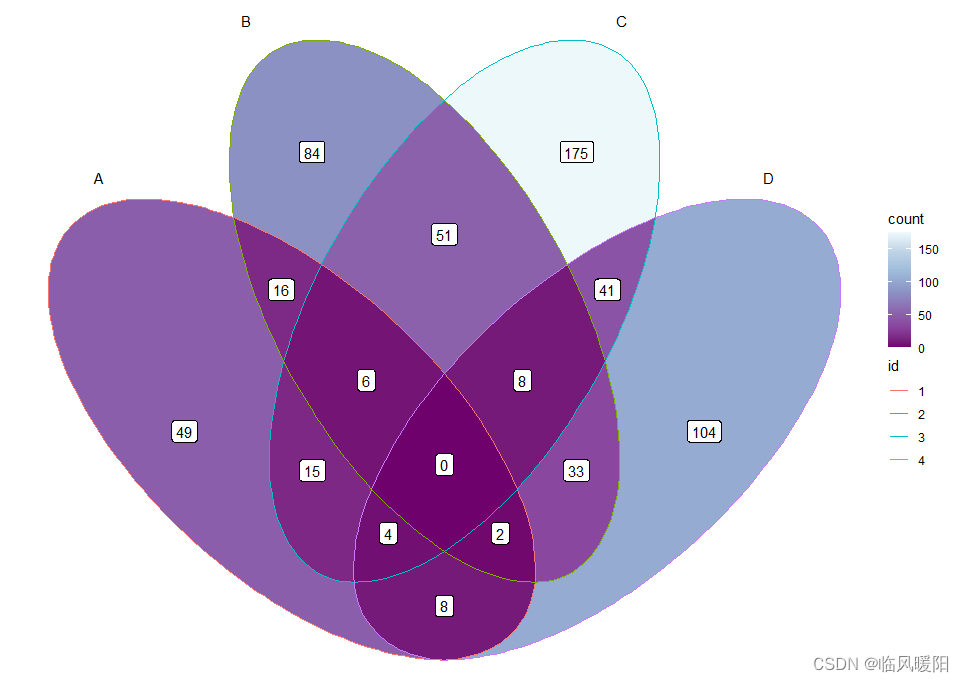
ggplot() +
geom_sf(aes(fill = count), data = venn_region(data)) +
geom_sf(aes(color = id), data = venn_setedge(data), show.legend = FALSE) +
geom_sf_text(aes(label = name), data = venn_setlabel(data)) +
geom_sf_label(aes(label = count), data = venn_region(data)) +
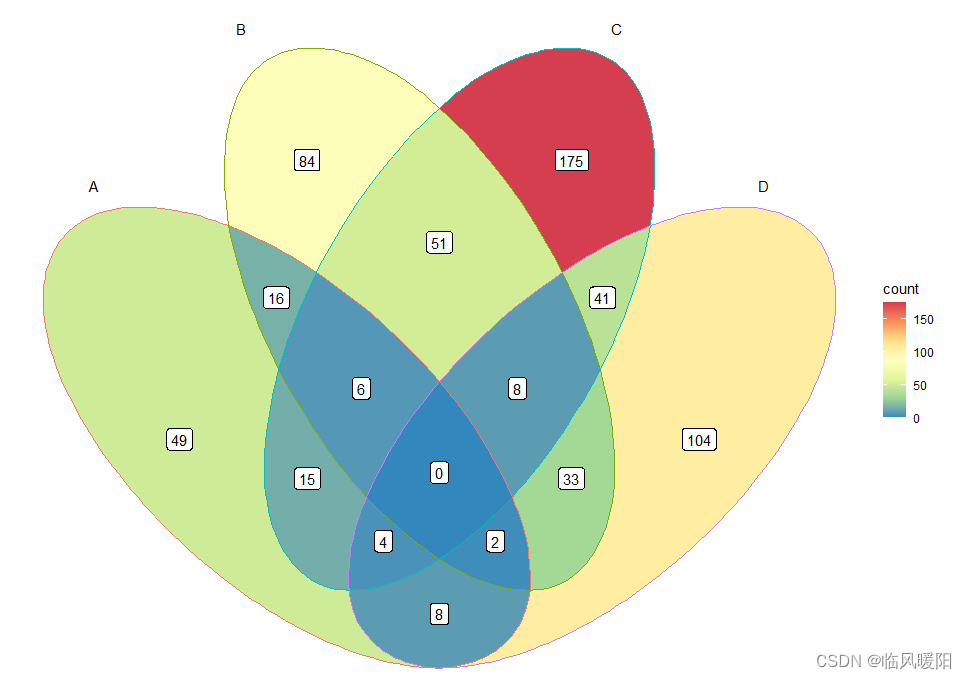
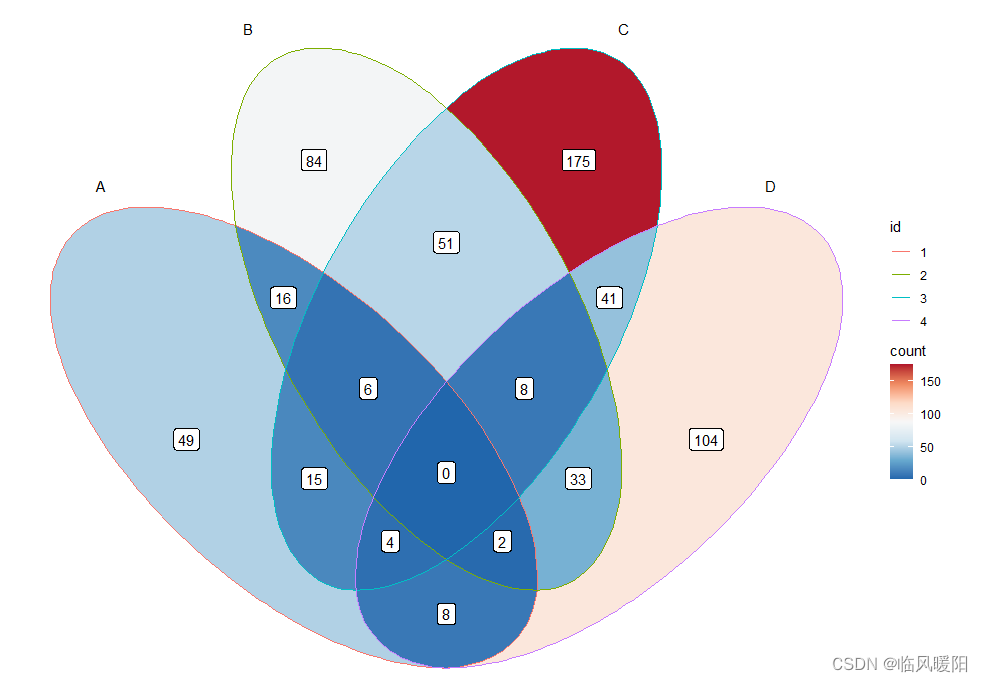
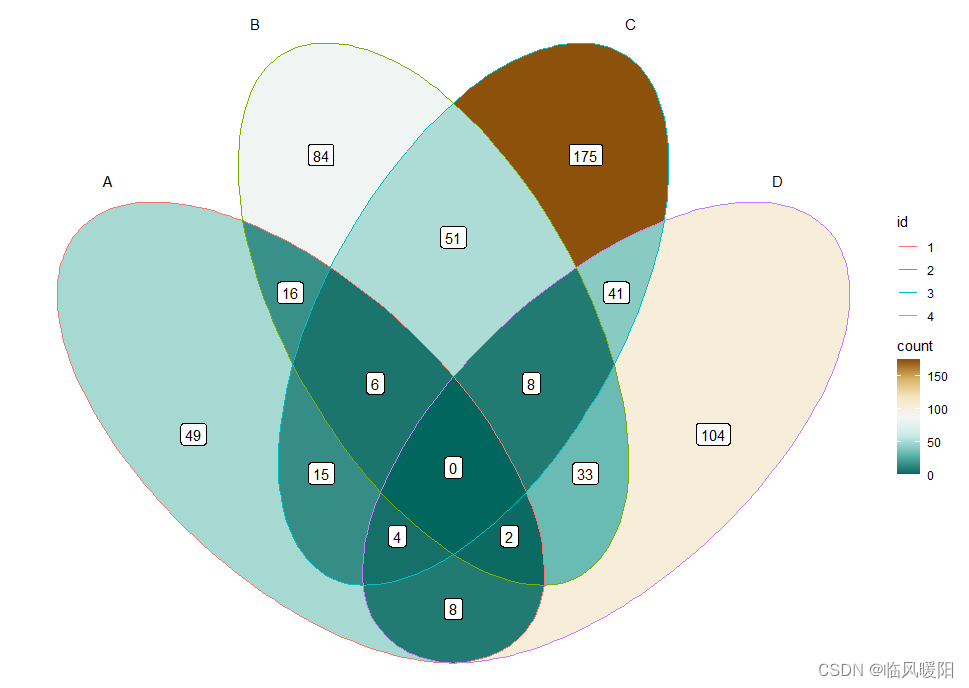
theme_void()+ scale_fill_distiller(palette = "Set1")
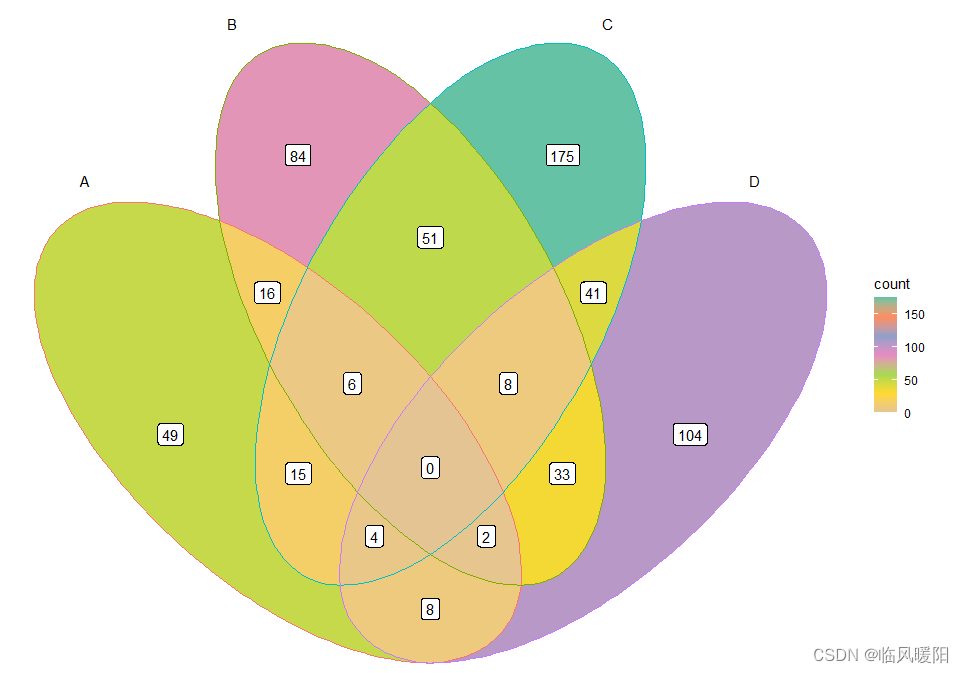
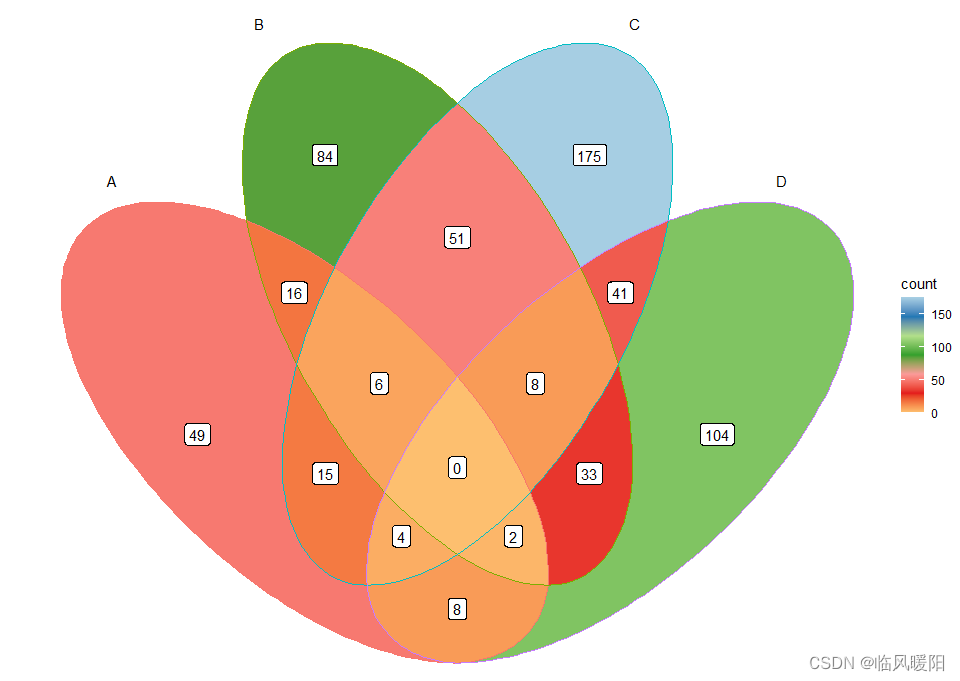
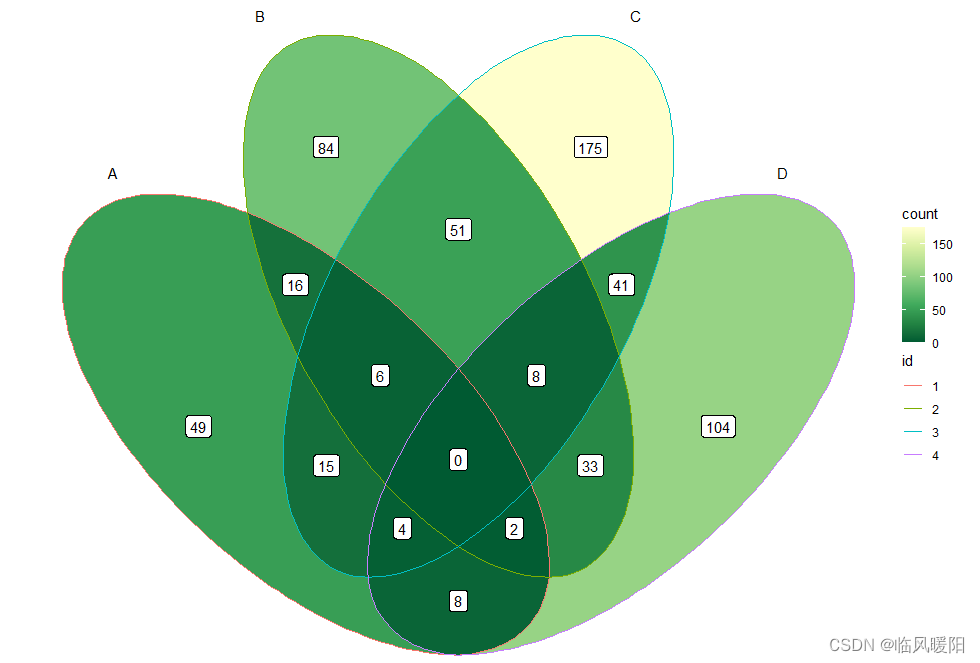
ggplot() +
geom_sf(aes(fill = count), data = venn_region(data)) +
geom_sf(aes(color = id), data = venn_setedge(data), show.legend = FALSE) +
geom_sf_text(aes(label = name), data = venn_setlabel(data)) +
geom_sf_label(aes(label = count), data = venn_region(data)) +
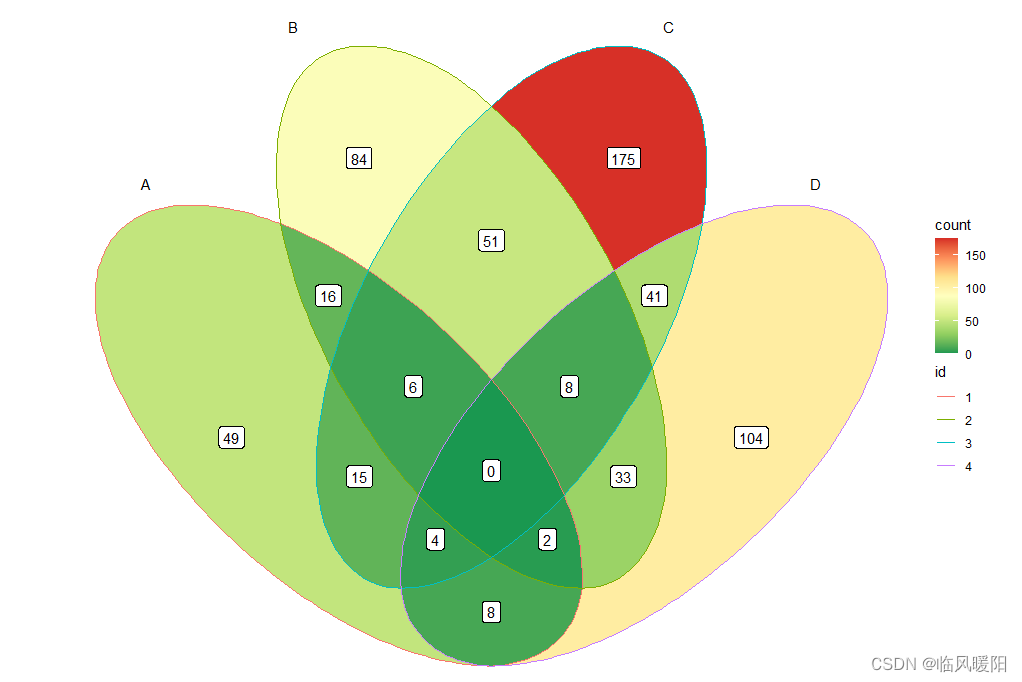
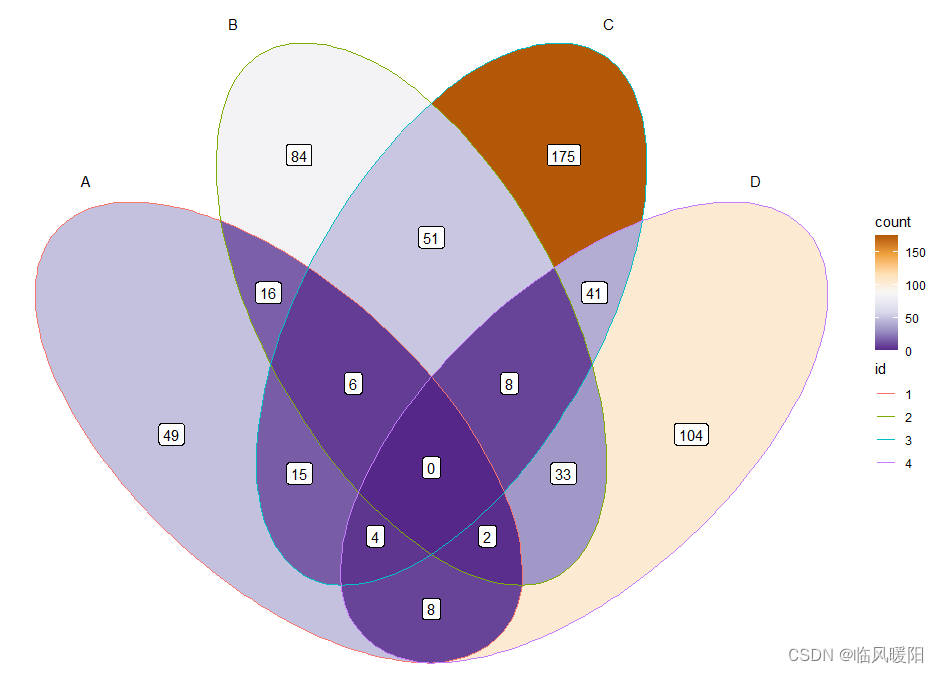
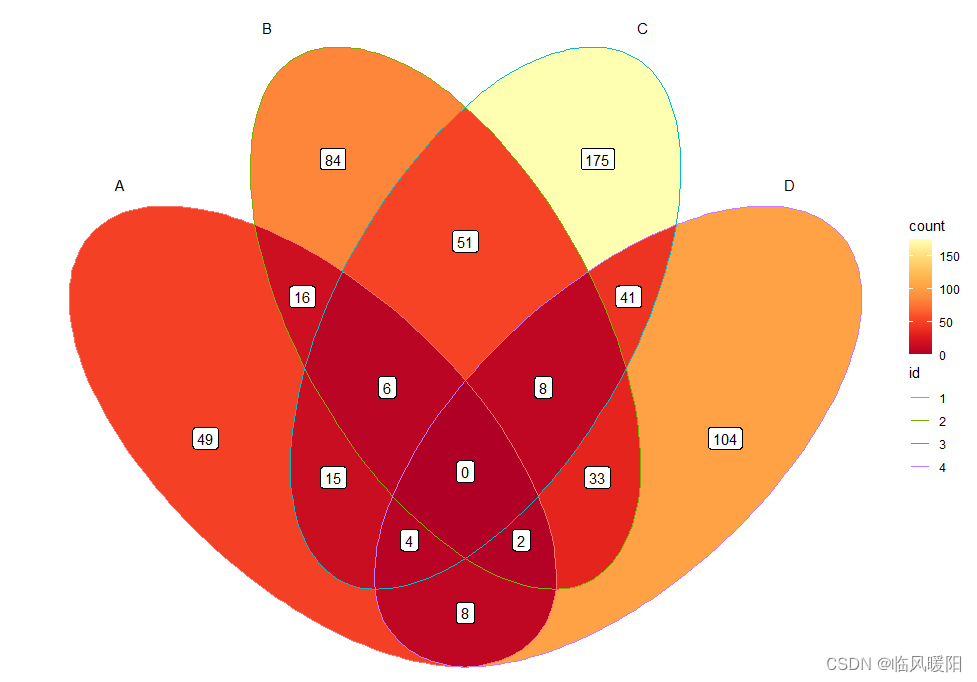
theme_void()+ scale_fill_distiller(palette = "Set2")
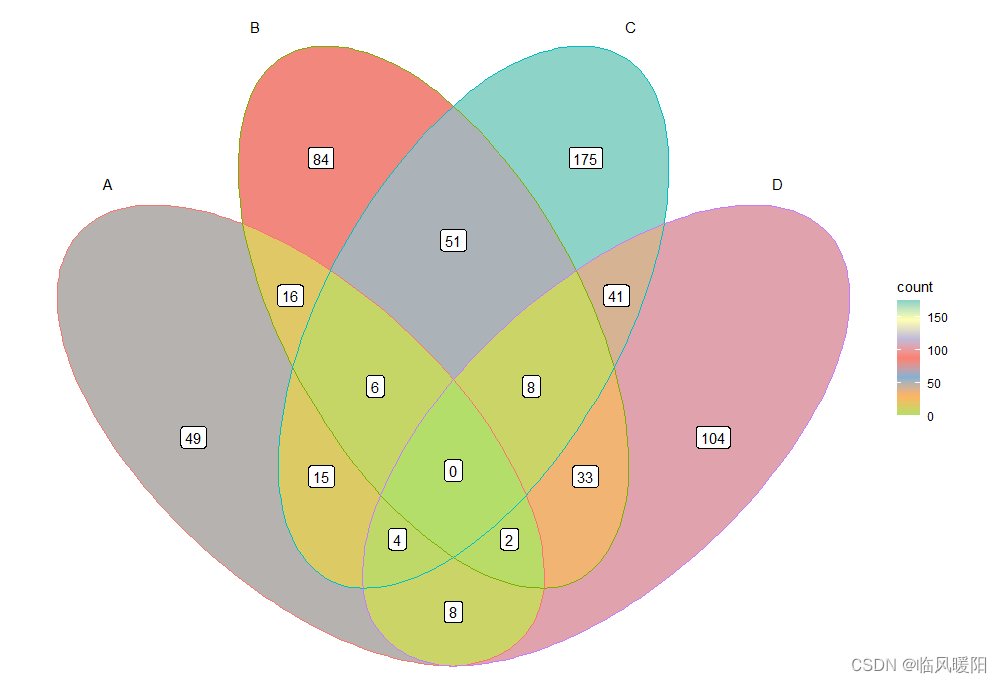
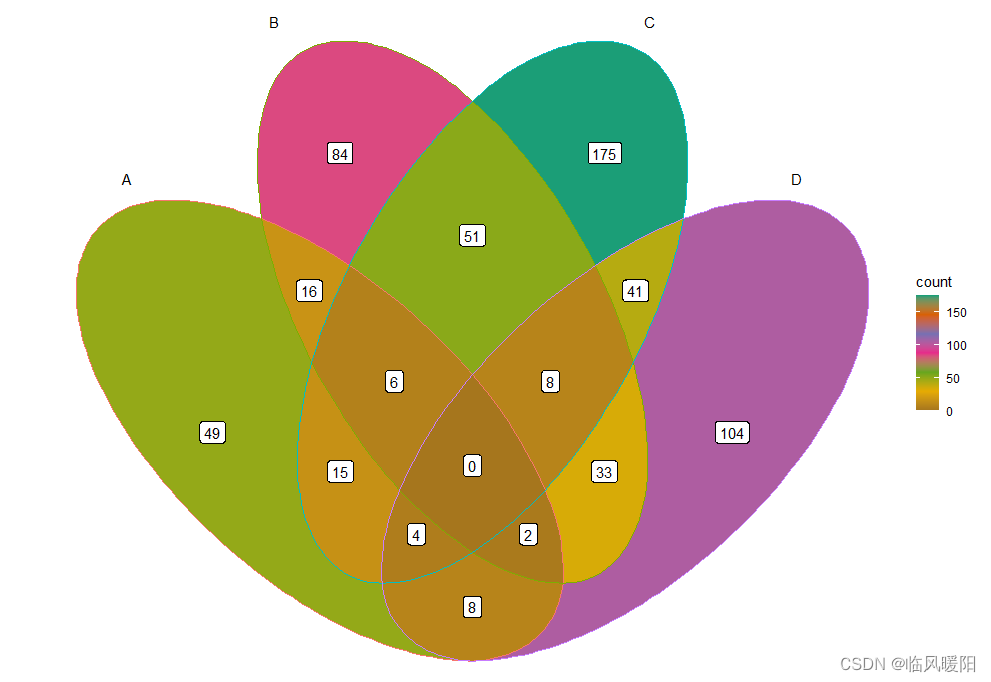
ggplot() +
geom_sf(aes(fill = count), data = venn_region(data)) +
geom_sf(aes(color = id), data = venn_setedge(data), show.legend = FALSE) +
geom_sf_text(aes(label = name), data = venn_setlabel(data)) +
geom_sf_label(aes(label = count), data = venn_region(data)) +
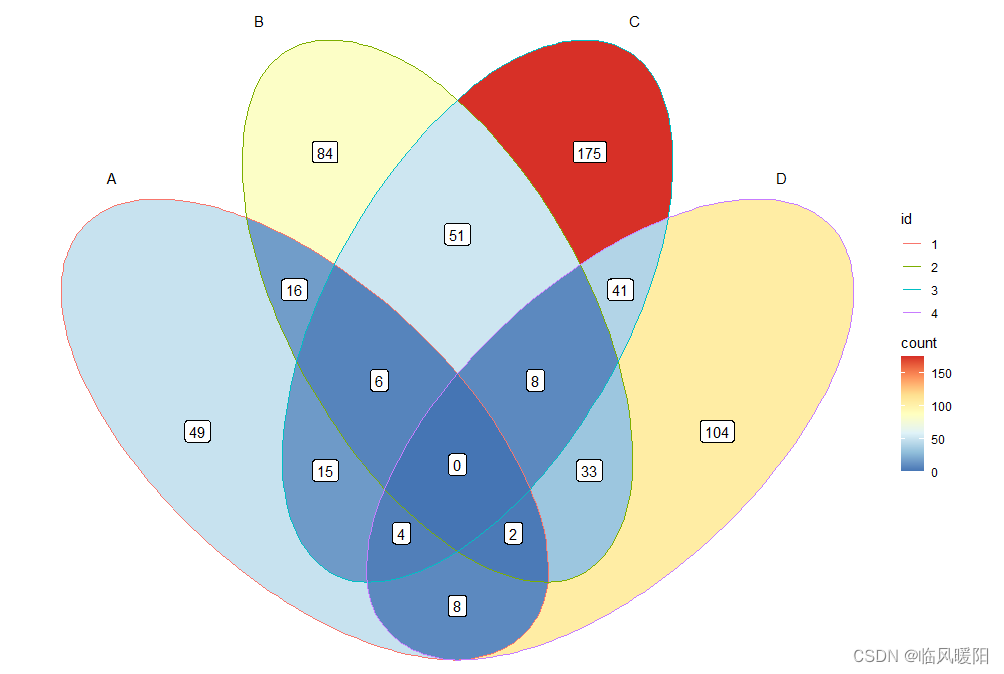
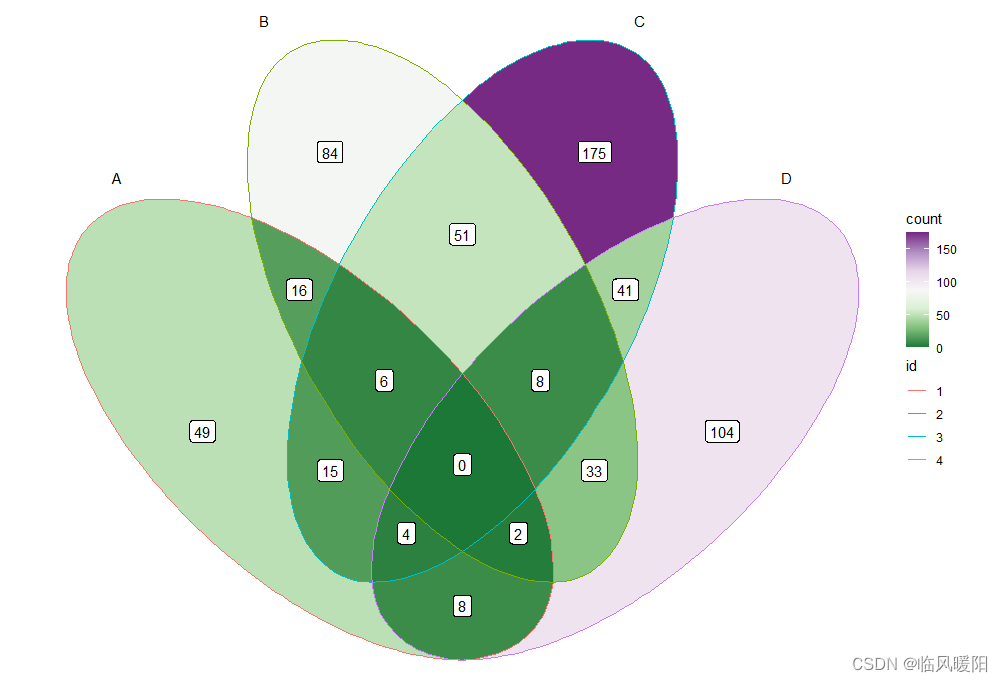
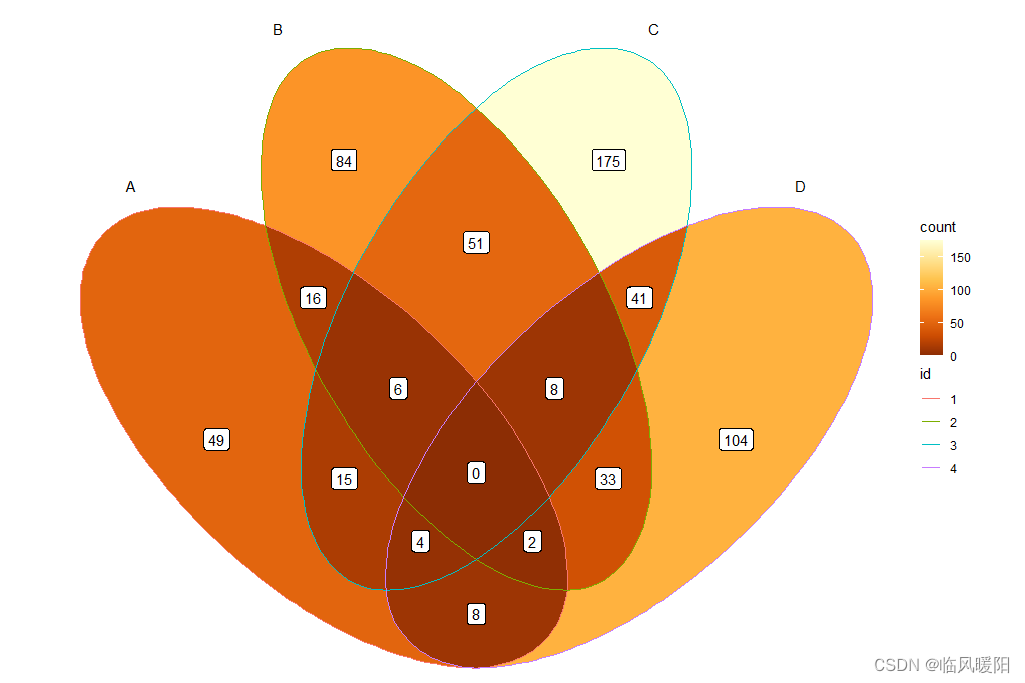
theme_void()+ scale_fill_distiller(palette = "Set3")
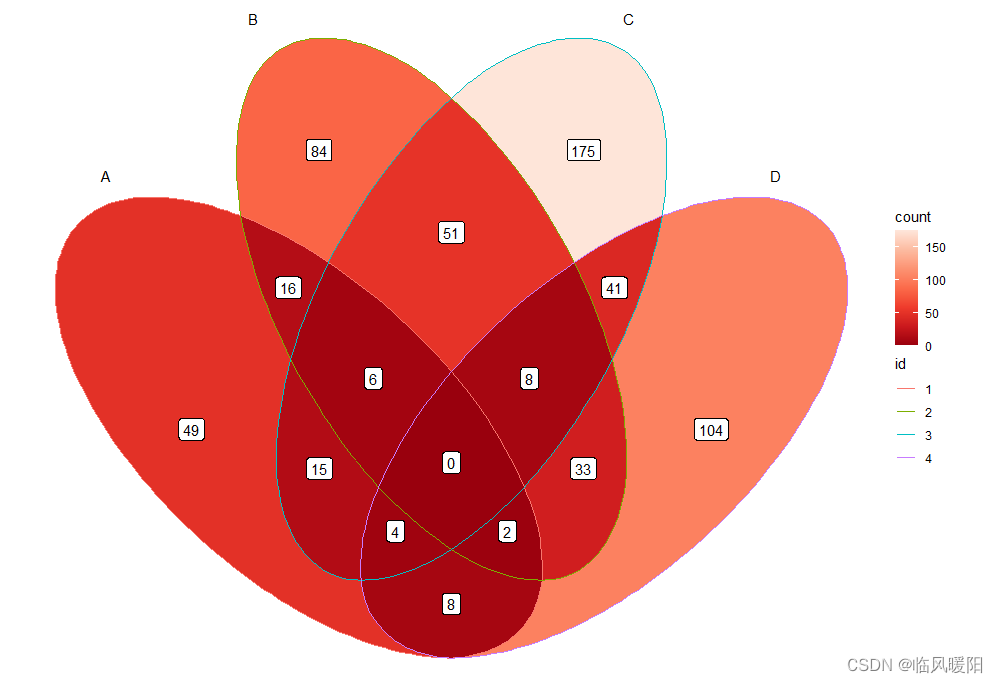
ggplot() +
  geom_sf(aes(fill = count), data = venn_region(data)) +
  geom_sf(aes(color = id), data = venn_setedge(data), show.legend = FALSE) +
  geom_sf_text(aes(label = name), data = venn_setlabel(data)) +
  geom_sf_label(aes(label = count), data = venn_region(data)) +
  theme_void()+ scale_fill_distiller(palette = "Pastel1")
ggplot() +
  geom_sf(aes(fill = count), data = venn_region(data)) +
  geom_sf(aes(color = id), data = venn_setedge(data), show.legend = FALSE) +
  geom_sf_text(aes(label = name), data = venn_setlabel(data)) +
  geom_sf_label(aes(label = count), data = venn_region(data)) +
  theme_void()+ scale_fill_distiller(palette = "Pastel2")
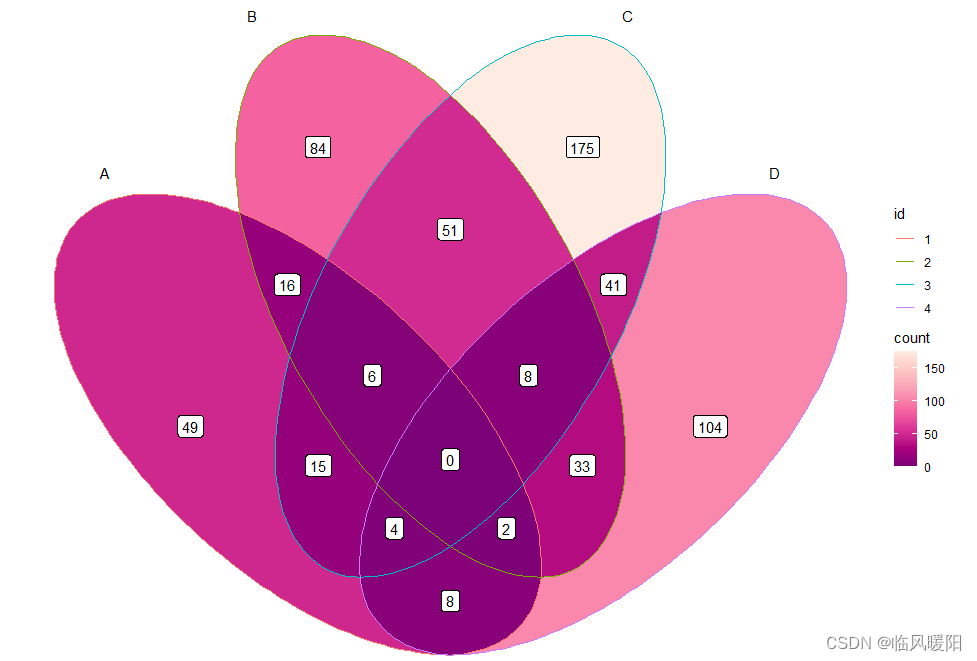
ggplot() +
  geom_sf(aes(fill = count), data = venn_region(data)) +
  geom_sf(aes(color = id), data = venn_setedge(data), show.legend = FALSE) +
  geom_sf_text(aes(label = name), data = venn_setlabel(data)) +
  geom_sf_label(aes(label = count), data = venn_region(data)) +
  theme_void()+ scale_fill_distiller(palette = "Paired")
ggplot() +
  geom_sf(aes(fill = count), data = venn_region(data)) +
  geom_sf(aes(color = id), data = venn_setedge(data), show.legend = FALSE) +
  geom_sf_text(aes(label = name), data = venn_setlabel(data)) +
  geom_sf_label(aes(label = count), data = venn_region(data)) +
  theme_void()+ scale_fill_distiller(palette = "Dark2")
ggplot() +
  geom_sf(aes(fill = count), data = venn_region(data)) +
  geom_sf(aes(color = id), data = venn_setedge(data), show.legend = FALSE) +
  geom_sf_text(aes(label = name), data = venn_setlabel(data)) +
  geom_sf_label(aes(label = count), data = venn_region(data)) +
  theme_void()+ scale_fill_distiller(palette = "Accent")
ggplot() +
  geom_sf(aes(fill = count), data = venn_region(data)) +
  geom_sf(aes(color = id), data = venn_setedge(data), show.legend = FALSE) +
  geom_sf_text(aes(label = name), data = venn_setlabel(data)) +
  geom_sf_label(aes(label = count), data = venn_region(data)) +
  theme_void()+ scale_fill_distiller(palette = "Spectral")
ggplot() +
  geom_sf(aes(fill = count), data = venn_region(data)) +
  geom_sf(aes(color = id), data = venn_setedge(data), show.legend = TRUE) +
  geom_sf_text(aes(label = name), data = venn_setlabel(data)) +
  geom_sf_label(aes(label = count), data = venn_region(data)) +
  theme_void()+ scale_fill_distiller(palette = "RdYlGn")
ggplot() +
  geom_sf(aes(fill = count), data = venn_region(data)) +
  geom_sf(aes(color = id), data = venn_setedge(data), show.legend = TRUE) +
  geom_sf_text(aes(label = name), data = venn_setlabel(data)) +
  geom_sf_label(aes(label = count), data = venn_region(data)) +
  theme_void()+ scale_fill_distiller(palette = "RdYlBu")
ggplot() +
  geom_sf(aes(fill = count), data = venn_region(data)) +
  geom_sf(aes(color = id), data = venn_setedge(data), show.legend = TRUE) +
  geom_sf_text(aes(label = name), data = venn_setlabel(data)) +
  geom_sf_label(aes(label = count), data = venn_region(data)) +
  theme_void()+ scale_fill_distiller(palette = "RdGy")
ggplot() +
  geom_sf(aes(fill = count), data = venn_region(data)) +
  geom_sf(aes(color = id), data = venn_setedge(data), show.legend = TRUE) +
  geom_sf_text(aes(label = name), data = venn_setlabel(data)) +
  geom_sf_label(aes(label = count), data = venn_region(data)) +
  theme_void()+ scale_fill_distiller(palette = "RdBu")
ggplot() +
  geom_sf(aes(fill = count), data = venn_region(data)) +
  geom_sf(aes(color = id), data = venn_setedge(data), show.legend = TRUE) +
  geom_sf_text(aes(label = name), data = venn_setlabel(data)) +
  geom_sf_label(aes(label = count), data = venn_region(data)) +
  theme_void()+ scale_fill_distiller(palette = "PuOr")
ggplot() +
  geom_sf(aes(fill = count), data = venn_region(data)) +
  geom_sf(aes(color = id), data = venn_setedge(data), show.legend = TRUE) +
  geom_sf_text(aes(label = name), data = venn_setlabel(data)) +
  geom_sf_label(aes(label = count), data = venn_region(data)) +
  theme_void()+ scale_fill_distiller(palette = "PRGn")
ggplot() +
  geom_sf(aes(fill = count), data = venn_region(data)) +
  geom_sf(aes(color = id), data = venn_setedge(data), show.legend = TRUE) +
  geom_sf_text(aes(label = name), data = venn_setlabel(data)) +
  geom_sf_label(aes(label = count), data = venn_region(data)) +
  theme_void()+ scale_fill_distiller(palette = "PiYG")
ggplot() +
  geom_sf(aes(fill = count), data = venn_region(data)) +
  geom_sf(aes(color = id), data = venn_setedge(data), show.legend = TRUE) +
  geom_sf_text(aes(label = name), data = venn_setlabel(data)) +
  geom_sf_label(aes(label = count), data = venn_region(data)) +
  theme_void()+ scale_fill_distiller(palette = "BrBG")
ggplot() +
  geom_sf(aes(fill = count), data = venn_region(data)) +
  geom_sf(aes(color = id), data = venn_setedge(data), show.legend = TRUE) +
  geom_sf_text(aes(label = name), data = venn_setlabel(data)) +
  geom_sf_label(aes(label = count), data = venn_region(data)) +
  theme_void()+ scale_fill_distiller(palette = "YlOrRd")
ggplot() +
  geom_sf(aes(fill = count), data = venn_region(data)) +
  geom_sf(aes(color = id), data = venn_setedge(data), show.legend = TRUE) +
  geom_sf_text(aes(label = name), data = venn_setlabel(data)) +
  geom_sf_label(aes(label = count), data = venn_region(data)) +
  theme_void()+ scale_fill_distiller(palette = "YlOrBr")
ggplot() +
  geom_sf(aes(fill = count), data = venn_region(data)) +
  geom_sf(aes(color = id), data = venn_setedge(data), show.legend = TRUE) +
  geom_sf_text(aes(label = name), data = venn_setlabel(data)) +
  geom_sf_label(aes(label = count), data = venn_region(data)) +
  theme_void()+ scale_fill_distiller(palette = "YlGnBu")
ggplot() +
  geom_sf(aes(fill = count), data = venn_region(data)) +
  geom_sf(aes(color = id), data = venn_setedge(data), show.legend = TRUE) +
  geom_sf_text(aes(label = name), data = venn_setlabel(data)) +
  geom_sf_label(aes(label = count), data = venn_region(data)) +
  theme_void()+ scale_fill_distiller(palette = "YlGn")
ggplot() +
geom_sf(aes(fill = count), data = venn_region(data)) +
geom_sf(aes(color = id), data = venn_setedge(data), show.legend = TRUE) +
geom_sf_text(aes(label = name), data = venn_setlabel(data)) +
geom_sf_label(aes(label = count), data = venn_region(data)) +
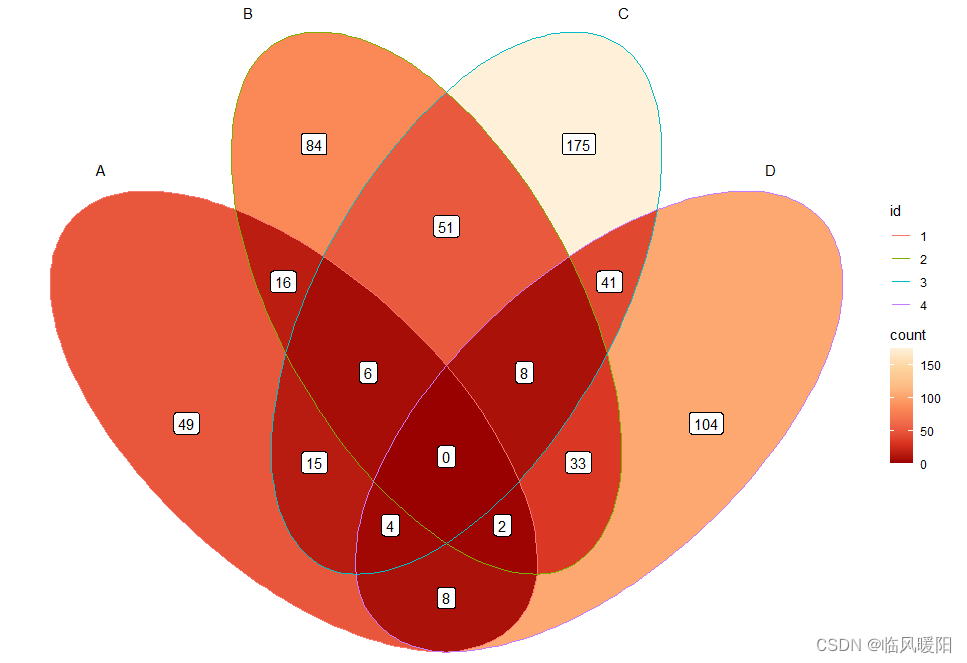
theme_void()+ scale_fill_distiller(palette = "Reds")
ggplot() +
  geom_sf(aes(fill = count), data = venn_region(data)) +
  geom_sf(aes(color = id), data = venn_setedge(data), show.legend = TRUE) +
  geom_sf_text(aes(label = name), data = venn_setlabel(data)) +
  geom_sf_label(aes(label = count), data = venn_region(data)) +
  theme_void()+ scale_fill_distiller(palette = "RdPu")
ggplot() +
  geom_sf(aes(fill = count), data = venn_region(data)) +
  geom_sf(aes(color = id), data = venn_setedge(data), show.legend = TRUE) +
  geom_sf_text(aes(label = name), data = venn_setlabel(data)) +
  geom_sf_label(aes(label = count), data = venn_region(data)) +
  theme_void()+ scale_fill_distiller(palette = "Purples")
ggplot() +
  geom_sf(aes(fill = count), data = venn_region(data)) +
  geom_sf(aes(color = id), data = venn_setedge(data), show.legend = TRUE) +
  geom_sf_text(aes(label = name), data = venn_setlabel(data)) +
  geom_sf_label(aes(label = count), data = venn_region(data)) +
  theme_void()+ scale_fill_distiller(palette = "PuRd")
ggplot() +
  geom_sf(aes(fill = count), data = venn_region(data)) +
  geom_sf(aes(color = id), data = venn_setedge(data), show.legend = TRUE) +
  geom_sf_text(aes(label = name), data = venn_setlabel(data)) +
  geom_sf_label(aes(label = count), data = venn_region(data)) +
  theme_void()+ scale_fill_distiller(palette = "PuBuGn")
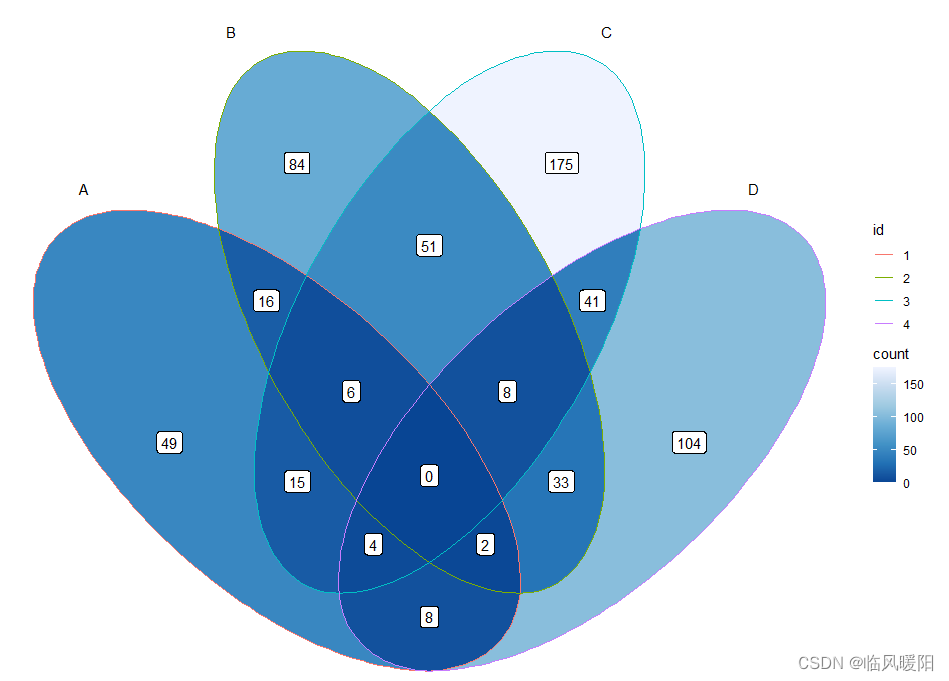
ggplot() +
  geom_sf(aes(fill = count), data = venn_region(data)) +
  geom_sf(aes(color = id), data = venn_setedge(data), show.legend = TRUE) +
  geom_sf_text(aes(label = name), data = venn_setlabel(data)) +
  geom_sf_label(aes(label = count), data = venn_region(data)) +
  theme_void()+ scale_fill_distiller(palette = "PuBu")
ggplot() +
geom_sf(aes(fill = count), data = venn_region(data)) +
geom_sf(aes(color = id), data = venn_setedge(data), show.legend = TRUE) +
geom_sf_text(aes(label = name), data = venn_setlabel(data)) +
geom_sf_label(aes(label = count), data = venn_region(data)) +
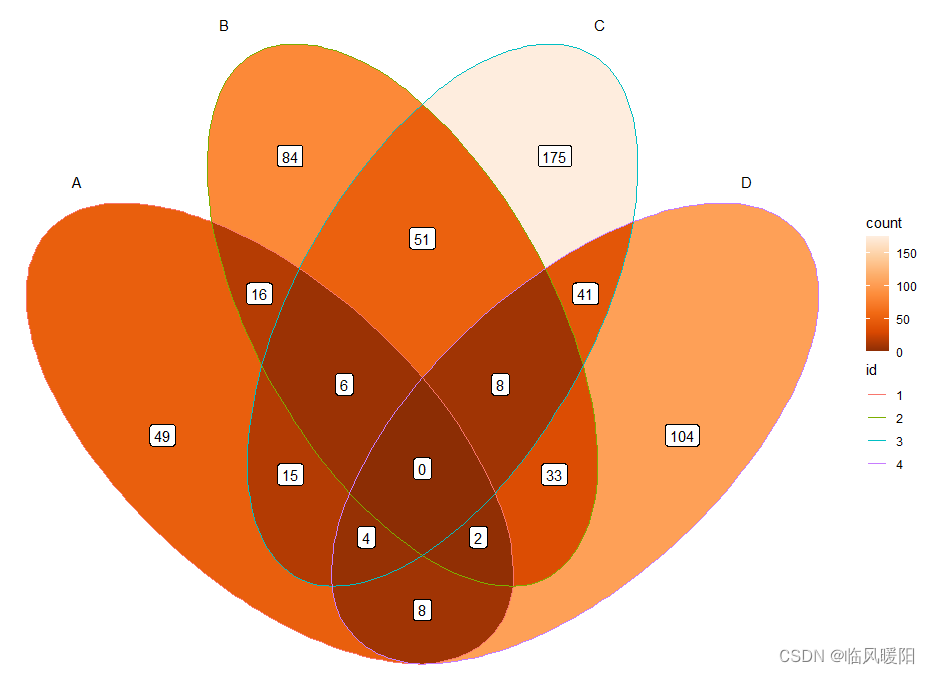
theme_void()+ scale_fill_distiller(palette = "OrRd")
ggplot() +
  geom_sf(aes(fill = count), data = venn_region(data)) +
  geom_sf(aes(color = id), data = venn_setedge(data), show.legend = TRUE) +
  geom_sf_text(aes(label = name), data = venn_setlabel(data)) +
  geom_sf_label(aes(label = count), data = venn_region(data)) +
  theme_void()+ scale_fill_distiller(palette = "Oranges")
ggplot() +
geom_sf(aes(fill = count), data = venn_region(data)) +
geom_sf(aes(color = id), data = venn_setedge(data), show.legend = TRUE) +
geom_sf_text(aes(label = name), data = venn_setlabel(data)) +
geom_sf_label(aes(label = count), data = venn_region(data)) +
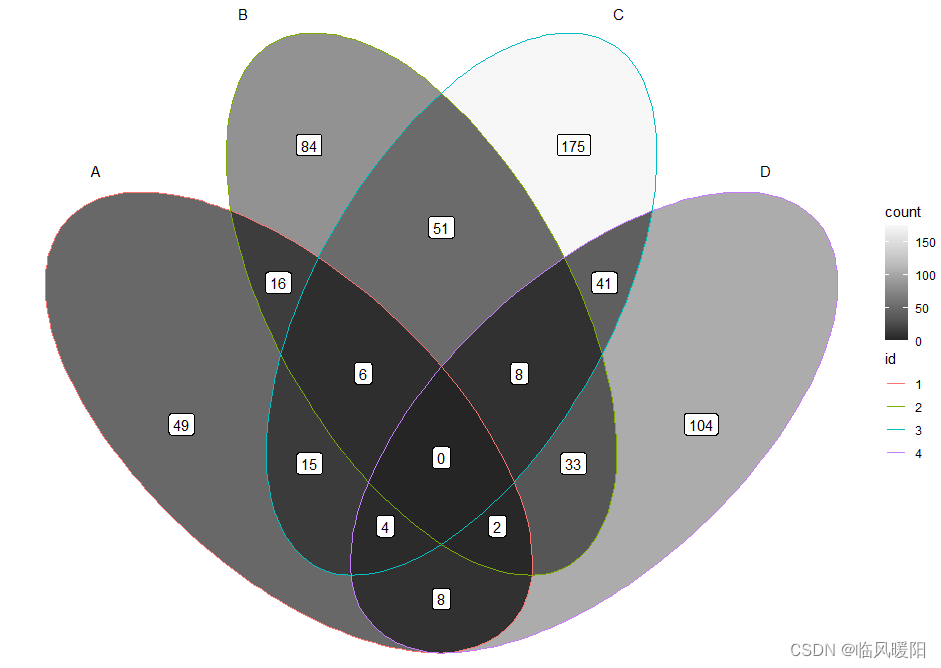
theme_void()+ scale_fill_distiller(palette = "Greys")
ggplot() +
geom_sf(aes(fill = count), data = venn_region(data)) +
geom_sf(aes(color = id), data = venn_setedge(data), show.legend = TRUE) +
geom_sf_text(aes(label = name), data = venn_setlabel(data)) +
geom_sf_label(aes(label = count), data = venn_region(data)) +
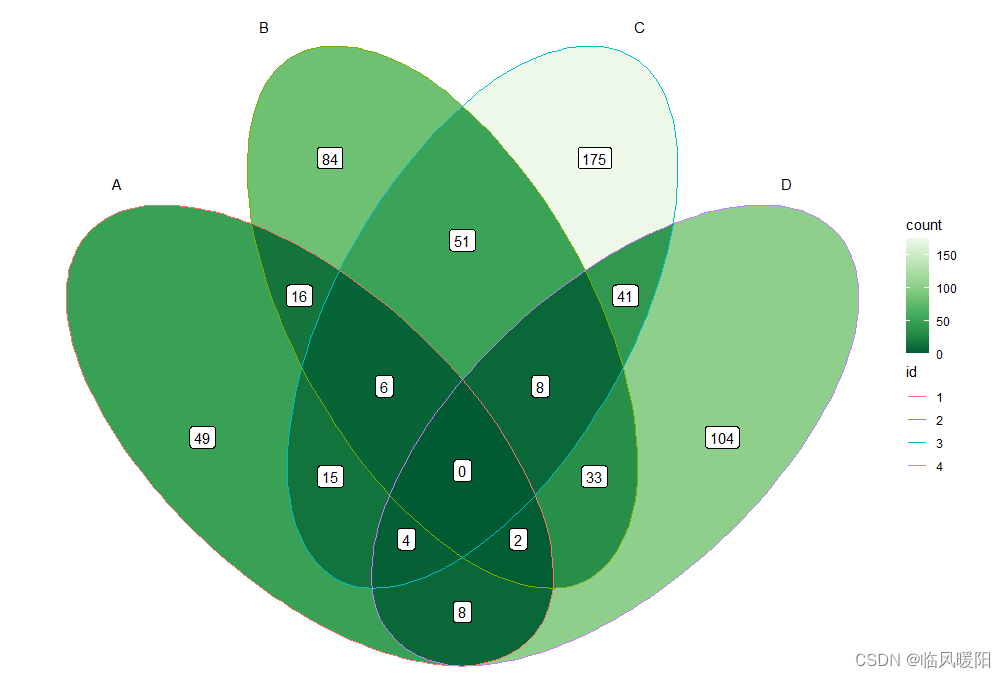
theme_void()+ scale_fill_distiller(palette = "Greens")
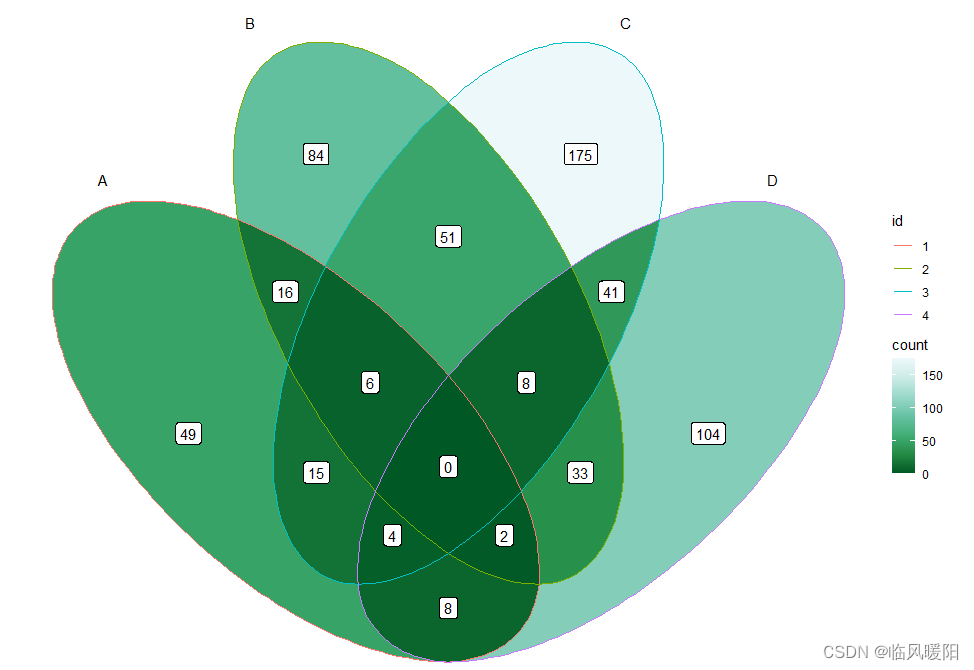
ggplot() +
geom_sf(aes(fill = count), data = venn_region(data)) +
geom_sf(aes(color = id), data = venn_setedge(data), show.legend = TRUE) +
geom_sf_text(aes(label = name), data = venn_setlabel(data)) +
geom_sf_label(aes(label = count), data = venn_region(data)) +
theme_void()+ scale_fill_distiller(palette = “GnBu”)
ggplot() +
  geom_sf(aes(fill = count), data = venn_region(data)) +
  geom_sf(aes(color = id), data = venn_setedge(data), show.legend = TRUE) +
  geom_sf_text(aes(label = name), data = venn_setlabel(data)) +
  geom_sf_label(aes(label = count), data = venn_region(data)) +
  theme_void()+ scale_fill_distiller(palette = "BuPu")
ggplot() +
  geom_sf(aes(fill = count), data = venn_region(data)) +
  geom_sf(aes(color = id), data = venn_setedge(data), show.legend = TRUE) +
  geom_sf_text(aes(label = name), data = venn_setlabel(data)) +
  geom_sf_label(aes(label = count), data = venn_region(data)) +
  theme_void()+ scale_fill_distiller(palette = "BuGn")
ggplot() +
  geom_sf(aes(fill = count), data = venn_region(data)) +
  geom_sf(aes(color = id), data = venn_setedge(data), show.legend = TRUE) +
  geom_sf_text(aes(label = name), data = venn_setlabel(data)) +
  geom_sf_label(aes(label = count), data = venn_region(data)) +
  theme_void()+ scale_fill_distiller(palette = "Blues")
参考文献:
百度百科:韦恩图
https://cloud.tencent.com/developer/article/1965941


 446
446


 被折叠的 条评论
为什么被折叠?
被折叠的 条评论
为什么被折叠?
 到【灌水乐园】发言


