


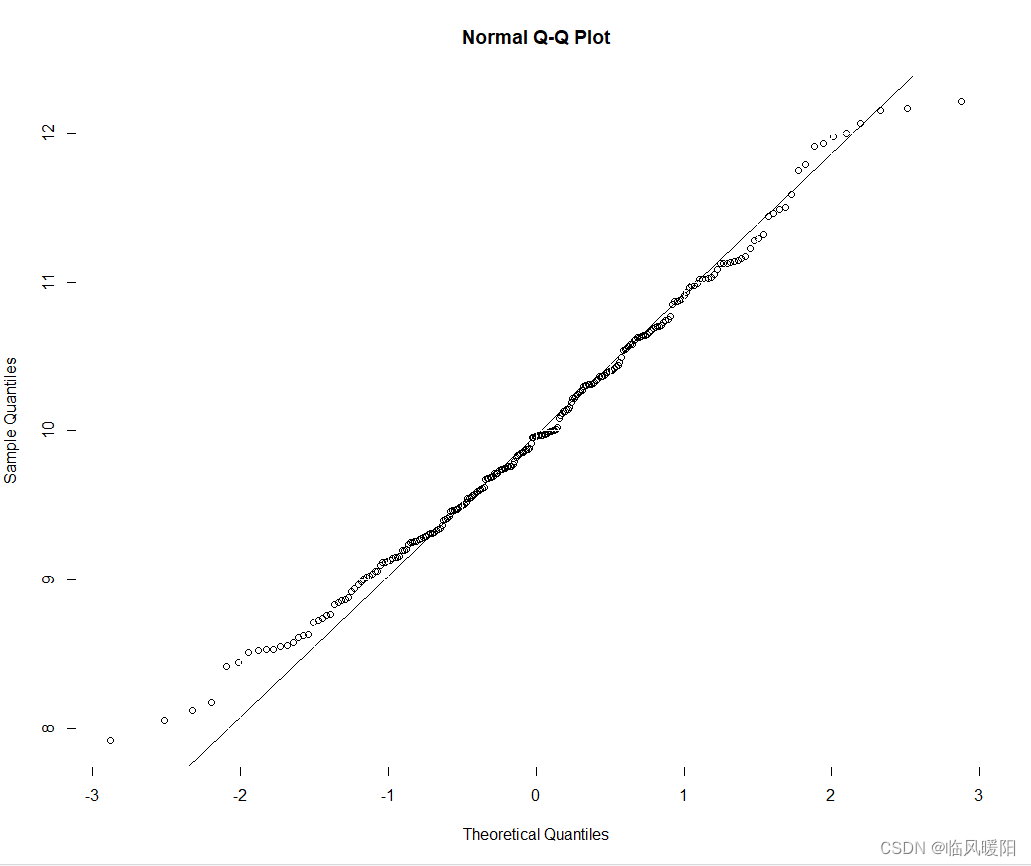
#---------------------------------------------Q-Q图---------------------------------------------------

set.seed(183)
x <- rnorm(250 , mean=10 , sd=1)
# # Compare the numbers sampled with rnorm() against normal distribution
qqnorm(x)
qqline(x)
abline(h = c(7:13)*1/2,col = "gray100",lty =1) # boe cpi target
abline(v = c(-3:3)*1/2,col = "gray100", lty = 1) # 2 year line
abline(h = c(7:13)*1,col = "gray100",lty =1) # boe cpi target
abline(v = c(-3:3),col = "gray100", lty = 1) # 2 year line
box(col="white")
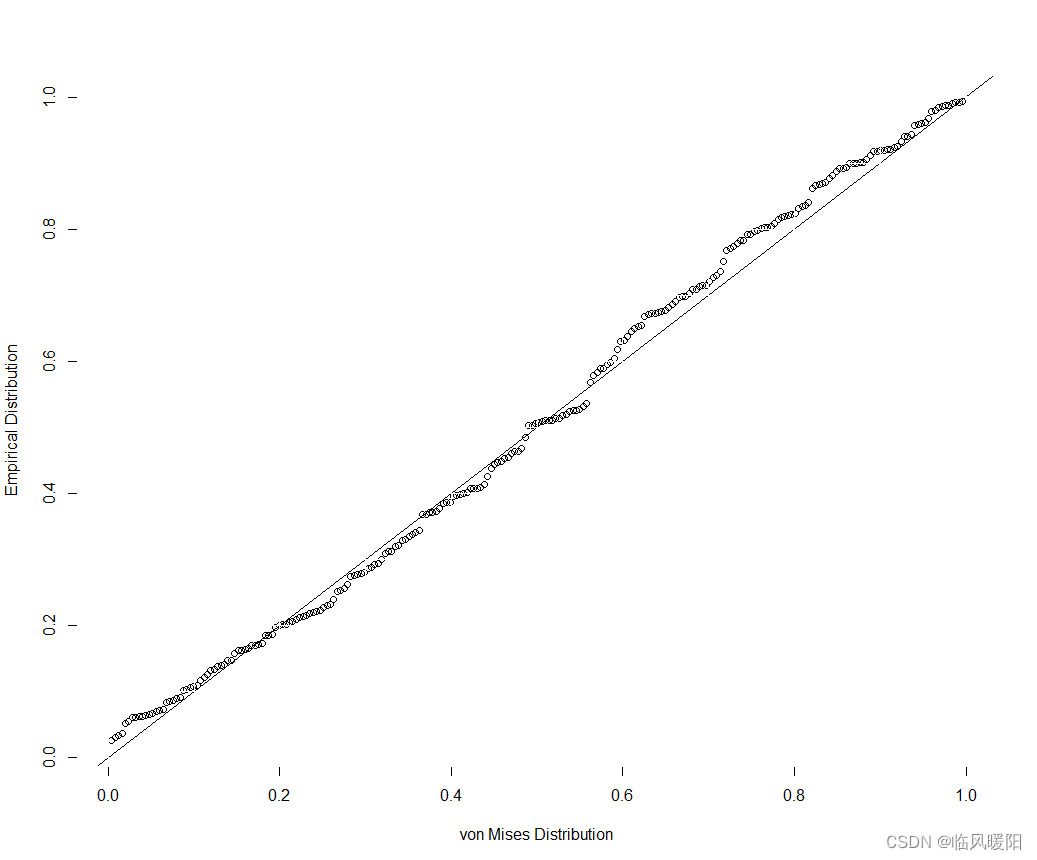
library(CircStats)
pp.plot(x)
abline(h = c(0:10)*1/10,col = "gray100",lty =1) # boe cpi target
abline(v = c(0:10)*1/10,col = "gray100", lty = 1) # 2 year line
abline(h = c(0:10)*2/10,col = "gray100",lty =1) # boe cpi target
abline(v = c(0:10)*2/10,col = "gray100", lty = 1) # 2 year line
box(col="white")
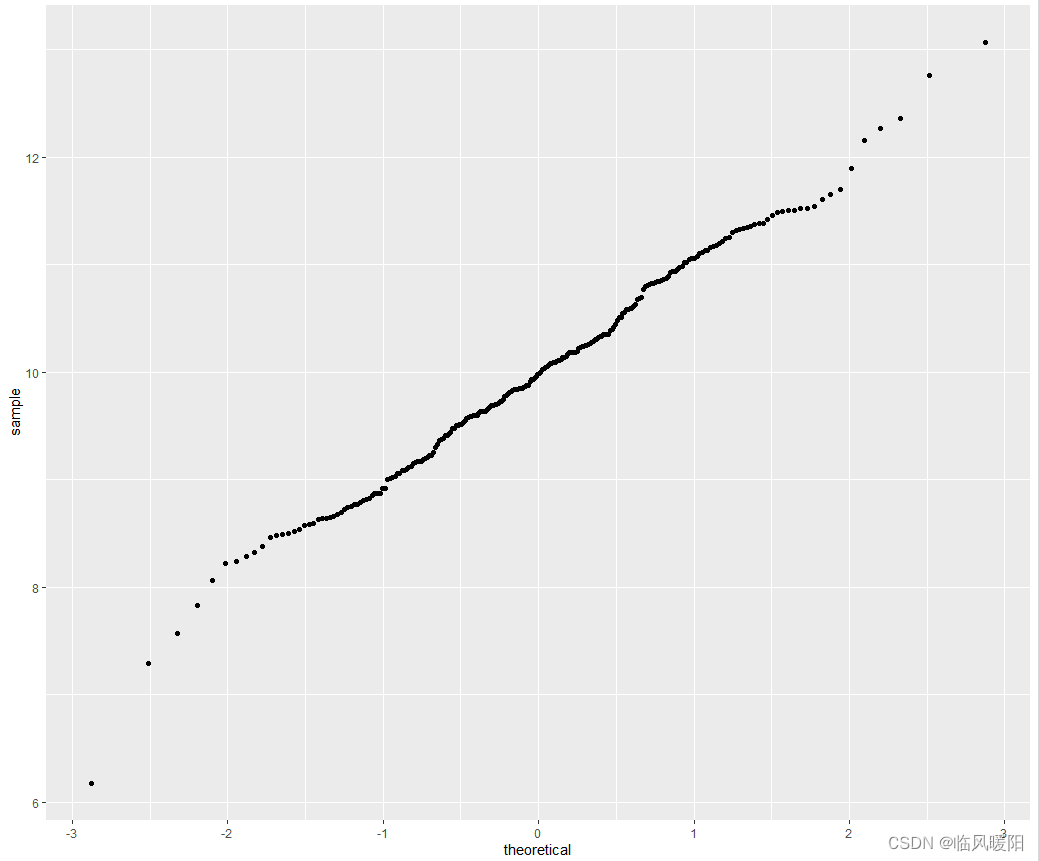
#---------------------------------------------ggplot2-Q-Q图---------------------------------------------------
library(ggplot2)

df <-data.frame(x=rnorm(250 , mean=10 , sd=1))
ggplot(df, aes(sample = x))+
  geom_qq()
  #geom_qq_line(fill = "#00AFBB",size=3)
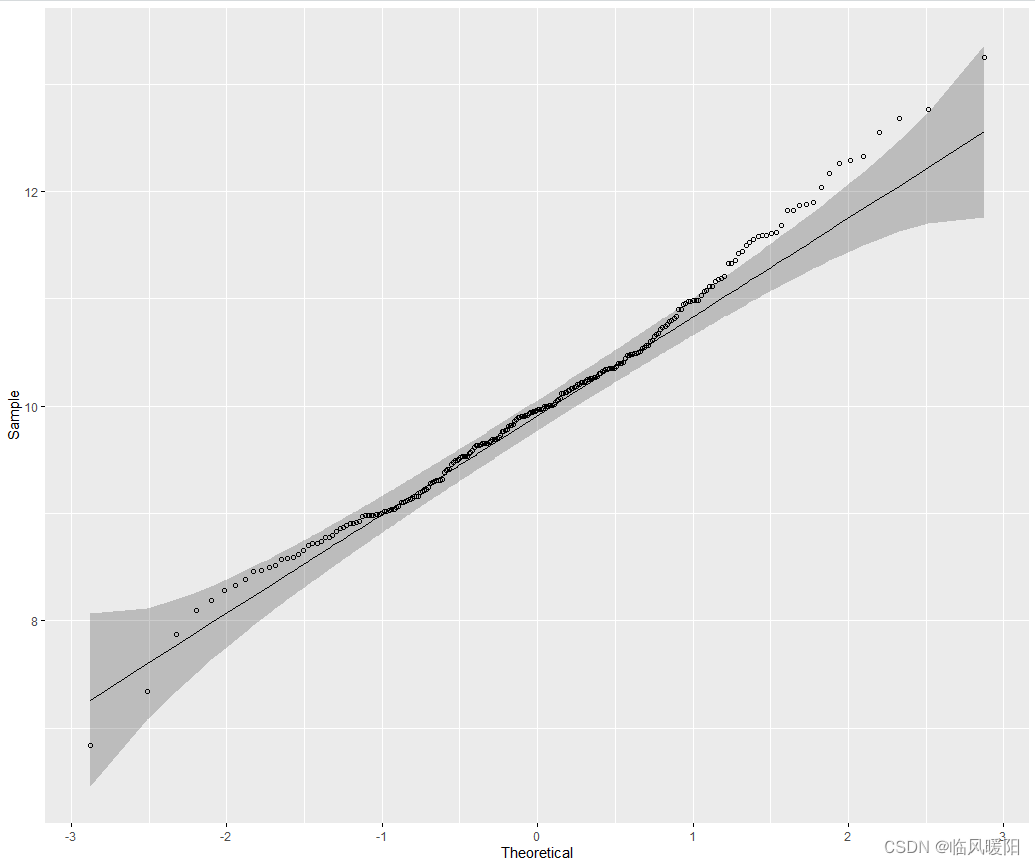
#---------------------------------------------ggqqplot-Q-Q图---------------------------------------------------
library(ggpubr)
x <- rnorm(250 , mean=10 , sd=1)
ggqqplot(x,shape=21,fill="white",colour="black",
         add = "none",
         ggtheme = ggplot2::theme_grey())
开发工具:RStudio与微信Alt+A截屏工具
参考文献:https://download.csdn.net/download/weixin_39840588/11515554?utm_medium=notify.im.downloadSource.a&username=m0_38127487


 1万+
1万+


 被折叠的 条评论
为什么被折叠?
被折叠的 条评论
为什么被折叠?
 到【灌水乐园】发言


