


 本文介绍了如何在RStudio中利用ggplot2包绘制气泡图,包括基本的数据准备、气泡大小与坐标轴标签的设置,以及两个实例演示了不同数据集下的气泡图应用。
# 安装并加载所需的包
library(ggplot2)
# 创建示例数据
data <- data.frame(
x = 1:10,
y = 11:20,
z = 101:110,
color = paste0("R", 1:10)
)
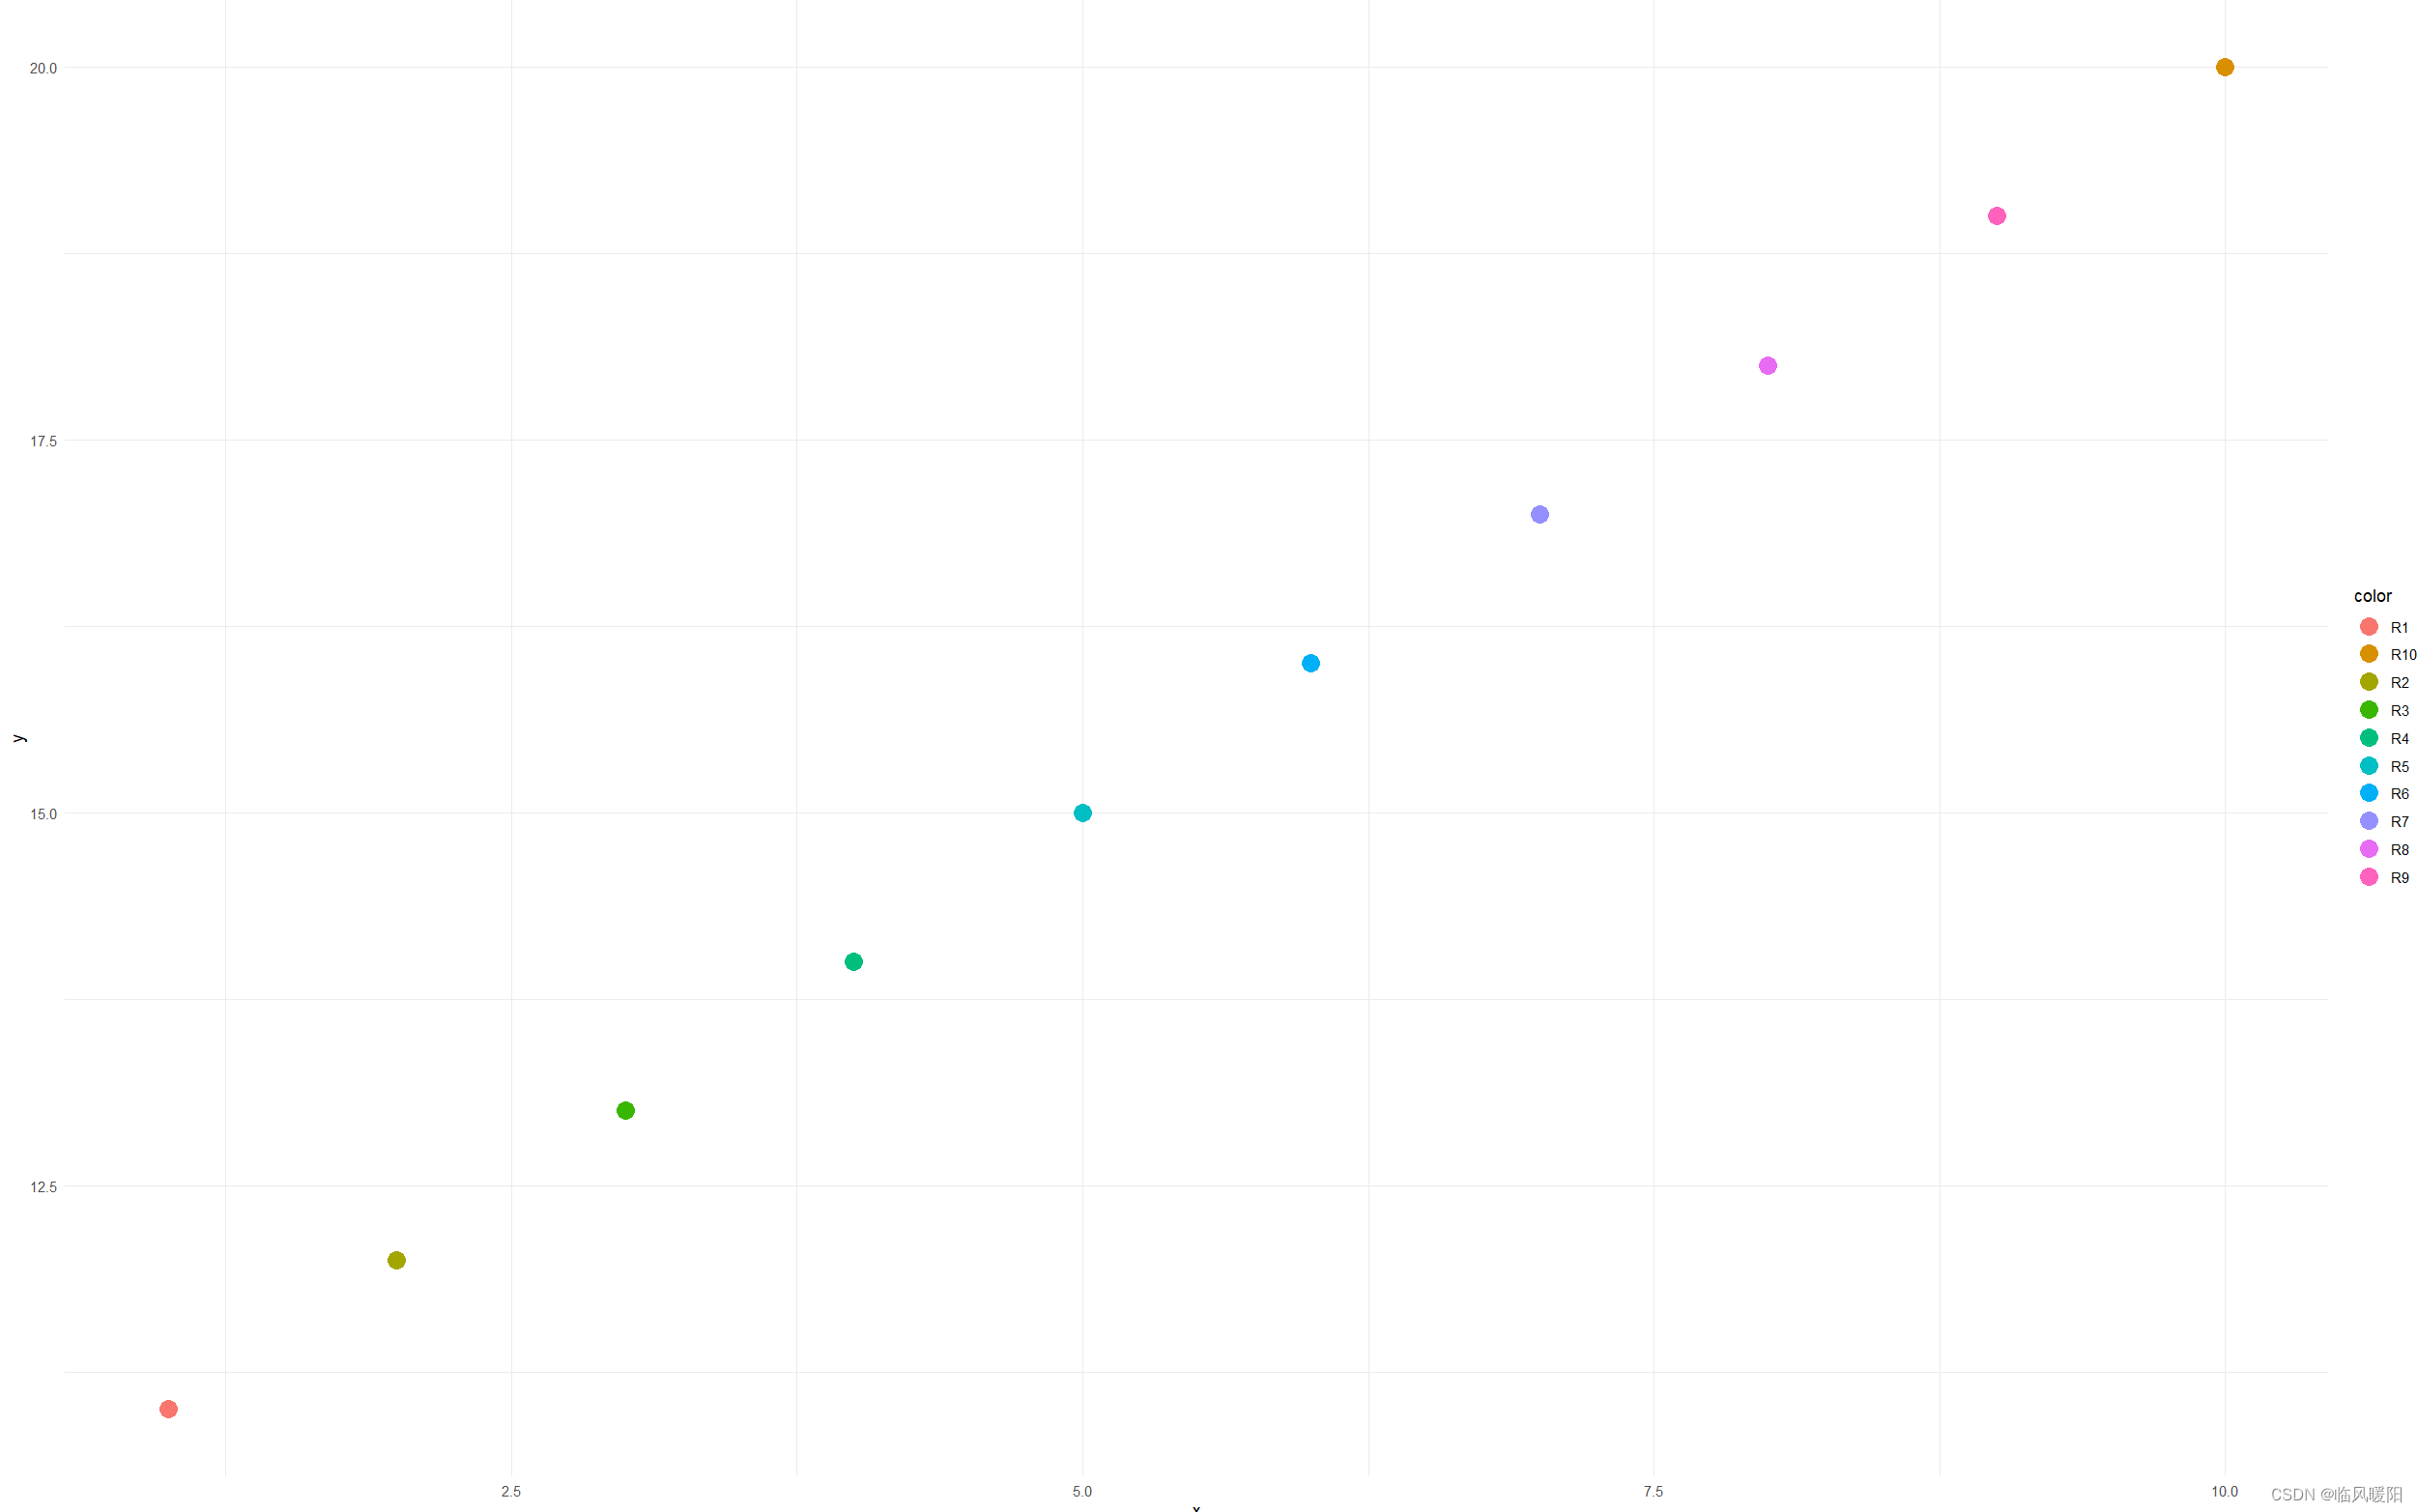
# 绘制气泡图
ggplot(data, aes(x, y, z = z, color = color)) +
geom_point(size = 5) +
theme_minimal()
library(ggplot2)
data <- data.frame(
x = c(1, 2, 3, 4, 5),
y = c(5, 4, 3, 2, 1),
z = c(10, 20, 30, 40, 50)
)
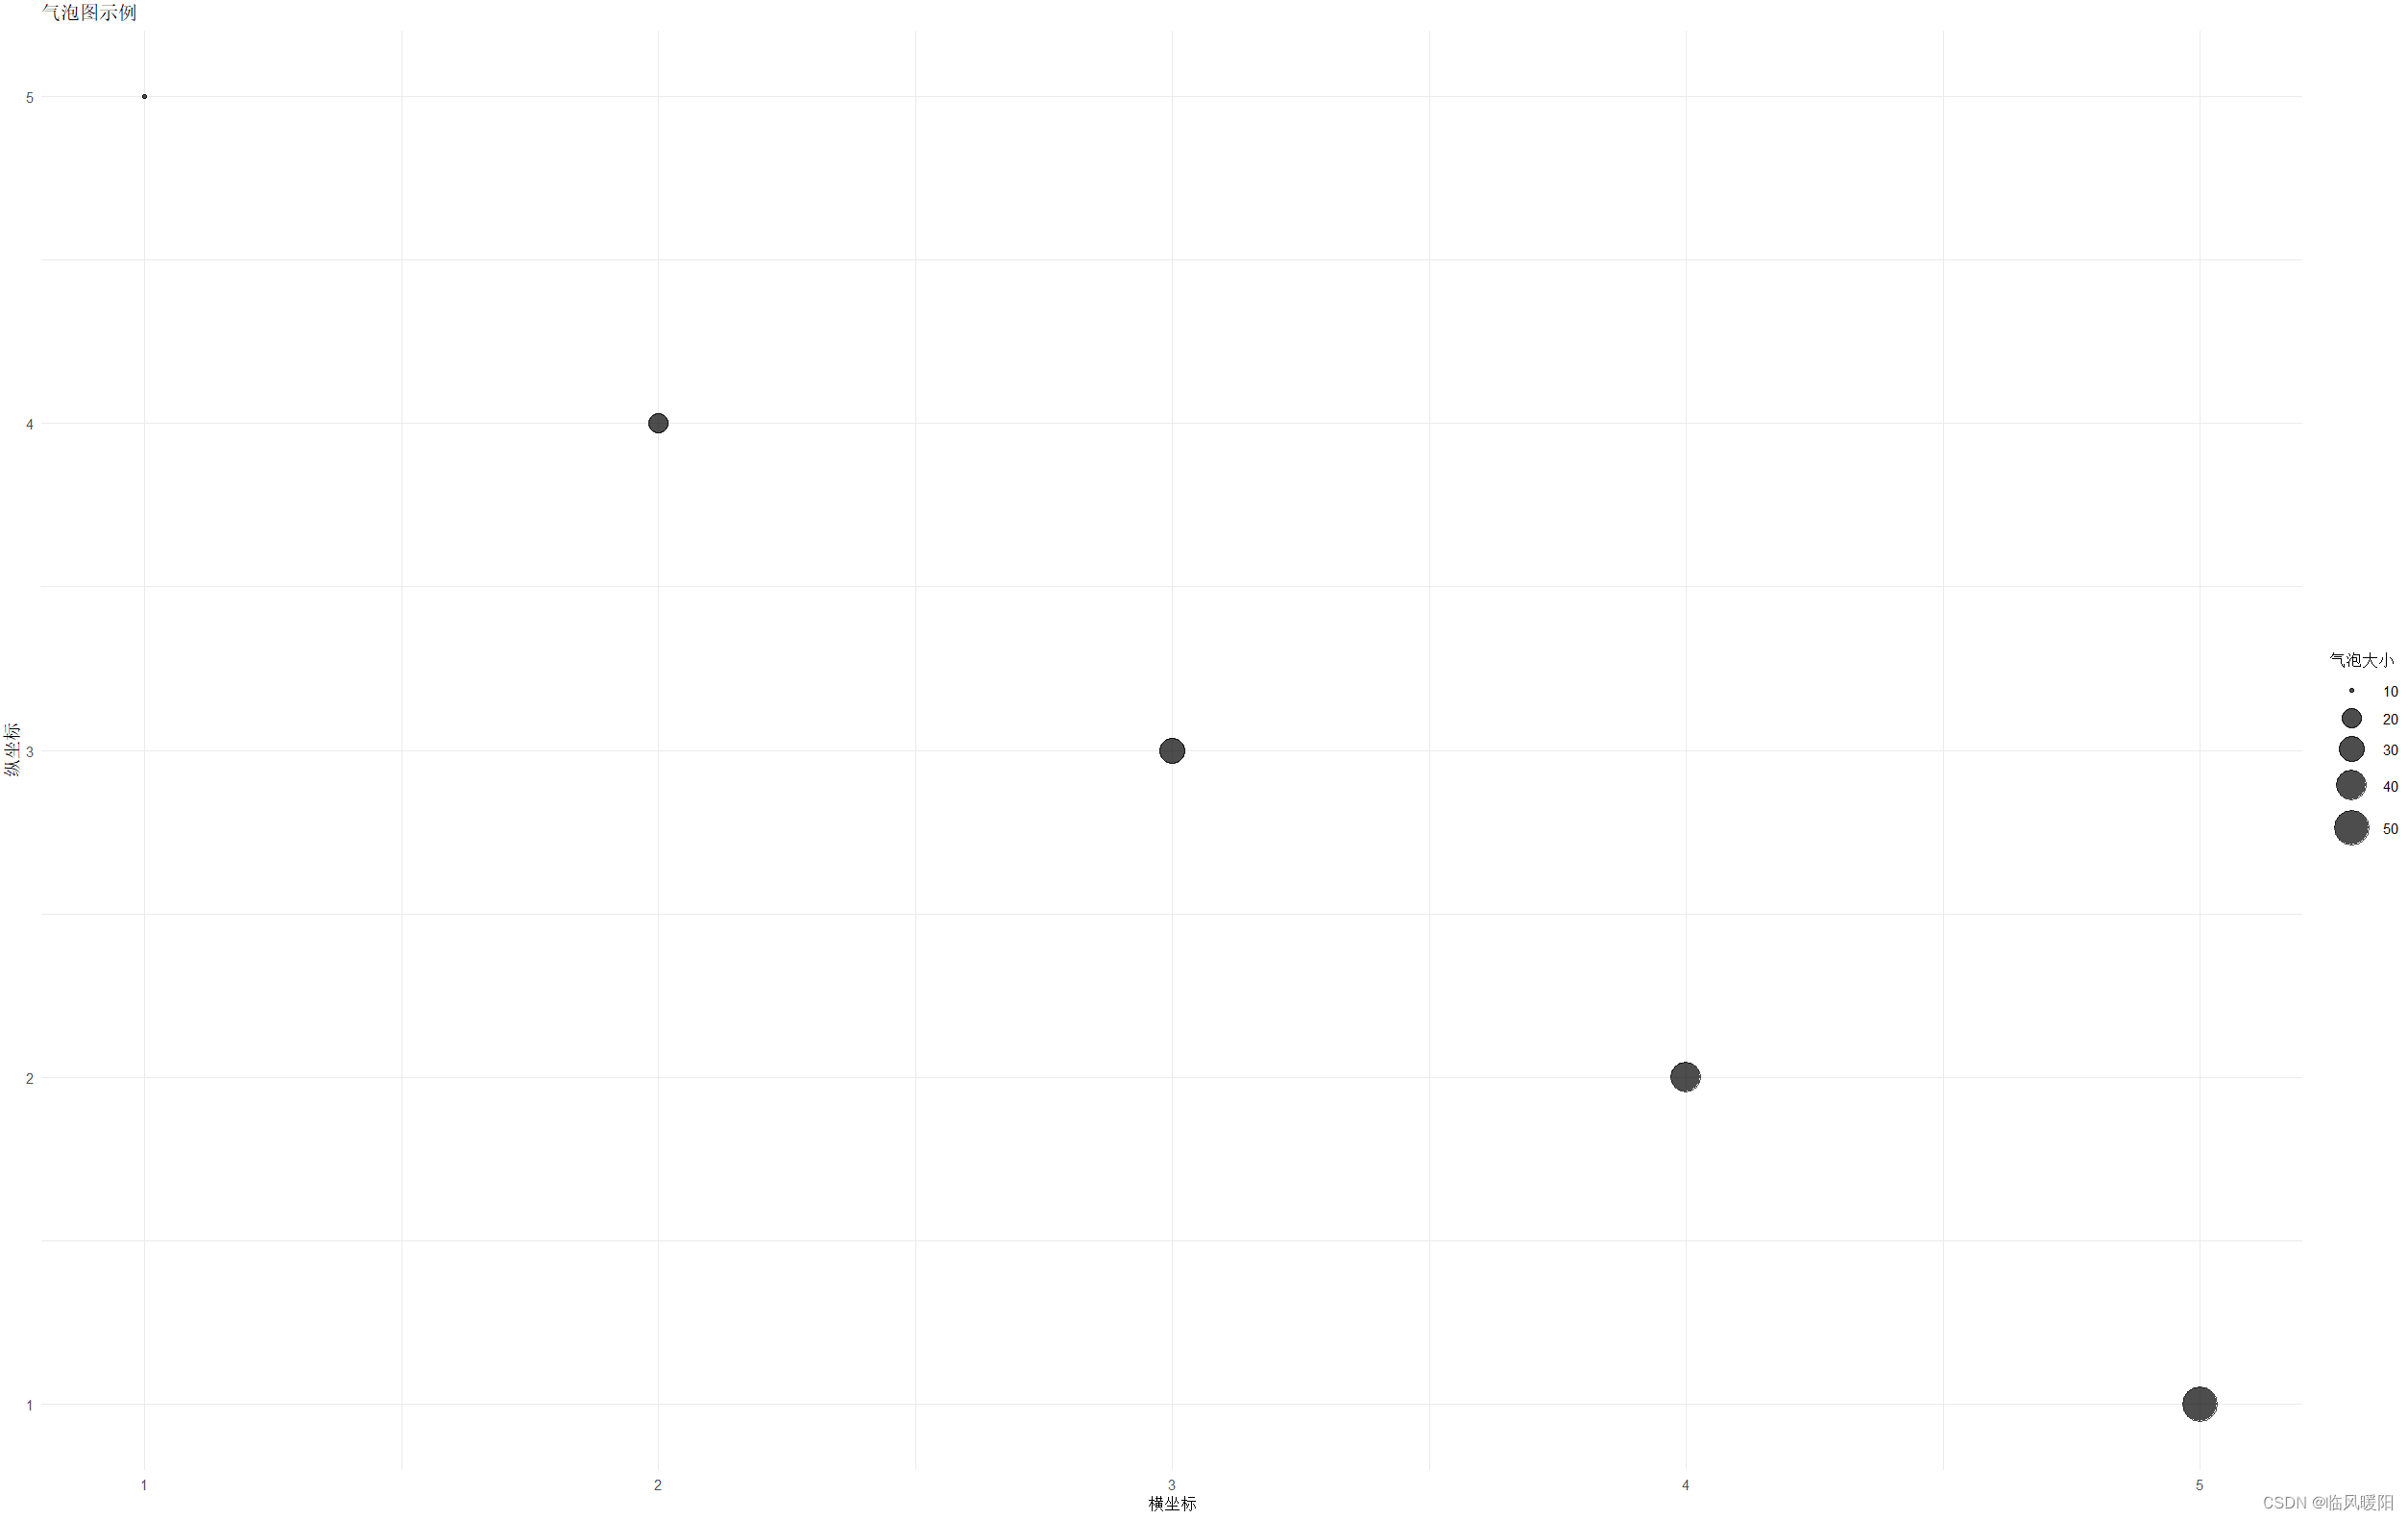
ggplot(data, aes(x = x, y = y, size = z)) +
geom_point(alpha = 0.7) +
scale_size(range = c(1,10)) +
theme_minimal() +
labs(title = "气泡图示例", x = "横坐标", y = "纵坐标", size = "气泡大小")


开发语言:RStudio 2023.06.1 Build 524
微信Alt+A截屏工具


 98
98


 被折叠的 条评论
为什么被折叠?
被折叠的 条评论
为什么被折叠?
 到【灌水乐园】发言


