


 本文详细介绍如何在Matplotlib中设置图例,包括使用label参数和plt.legend()函数的方法,以及如何自定义图例的位置和样式。通过实例代码演示了不同参数的设置效果。
图例
-
设置
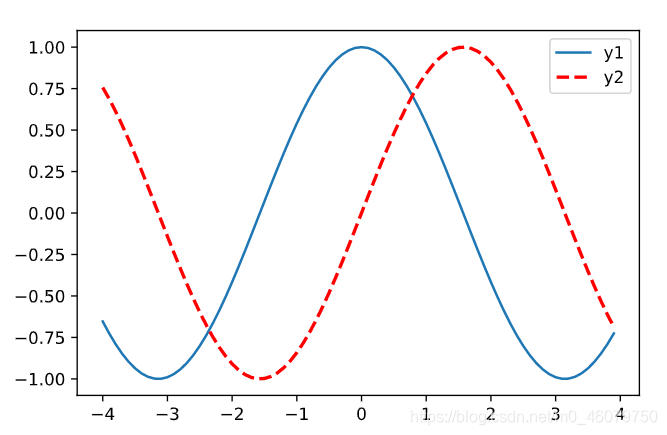
label,再使用plt.legend()plt.plot(x,y1,label='y1') plt.plot(x,y2,color='red',linewidth=2.0,linestyle='--',label='y2') plt.legend() #使用默认参数
-
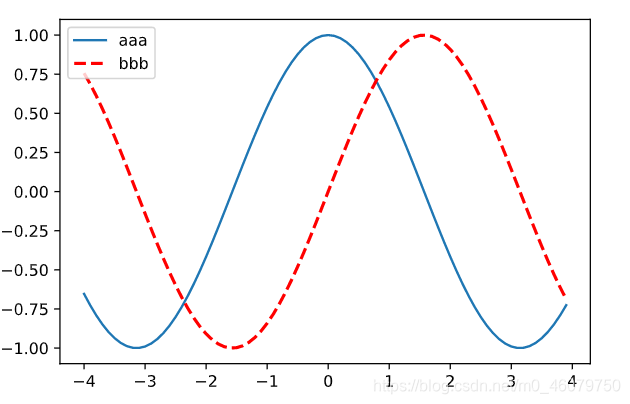
legend(*handles, *labels,loc)参数设置plt.figure(num=4) # figure对象名称、尺寸设置 L1, = plt.plot(x,y1,label='y1') #L1后面必须有逗号 L2, = plt.plot(x,y2,color='red',linewidth=2.0,linestyle='--',label='y2') #L2后面必须有逗号 plt.legend(handles=[L1,L2],labels=['aaa','bbb'],loc='upper left')
-
handles所要处理的线,参数为列表 -
labels所要处理的线的图例名称,参数为列表,名称对应handles相应位置 -
loc表示图例位置,best表示自动找一个比较合适的地方(不会覆盖住数据)放置loc常用参数:
	best   			自动寻找合适位置
	upper right		右上角
	upper left		左上角
	lower left		左下角
	lower right		右下角
	right			右边中间位置 =center right
	center left		右边中间位置
	center right	右边中间位置
	lower center	底部中间位置
	upper center	顶部中间位置
	center			整张图中间位置
完整代码:
import matplotlib.pyplot as plt
import numpy as np

x = np.arange(-4, 4, 0.1)
y1 = np.cos(x)
y2 = np.sin(x)

L1, = plt.plot(x, y1, color= 'r',label='y1')
L2, = plt.plot(x, y2, color= 'skyblue', label='y2')
plt.legend(handles=[L1,L2], labels=['aaa','bbb'],loc='lower left')
plt.show()


 4万+
4万+

 被折叠的 条评论
为什么被折叠?
被折叠的 条评论
为什么被折叠?
 到【灌水乐园】发言


