


将从下面这四步开始介绍整个过程(遇到问题,解决问题的过程)
1:将在一个窗口中绘制三个子图。转变为在一个窗口绘制一个图,并在另一个窗口绘制剩下两个子图。
2:在绘制第二个窗口时,子图的创建 和 函数的选择;
3:第二个窗口中子图的排列。
例子,在一个窗口,分别用三个子图绘制两种不同的数据。
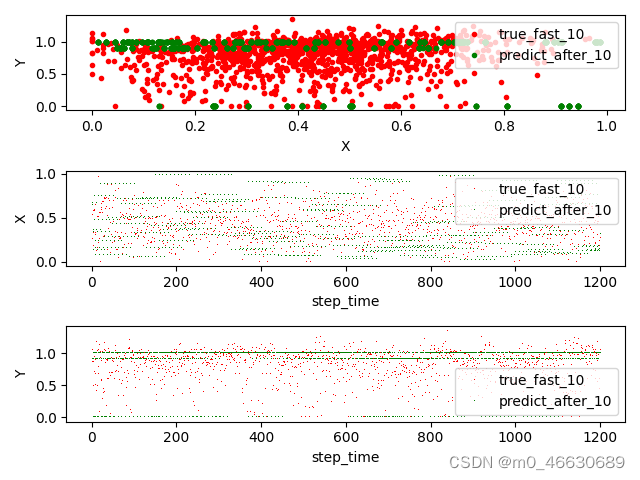
1、绘制子图的代码。
其中“test_y_x”、“test_y_y”分别代表“横轴”和“纵轴”,“rel_test_y_x”、“rel_test_y_y”同理。可用自己的数据代替,这里代表我数据集中(x,y)的坐标位置。
# 创建横轴
x = np.arange(1200)
x.reshape(1200, 1)

# 创建第一个子图,位置第一行第一列
plt.subplot(3, 1, 1)
plt.xlabel('X')        # 设置横坐标标签
plt.ylabel('Y')        # 设置纵坐标标签
plt.plot(test_y_x, test_y_y, '.', linewidth=1.0, color='red')    # 根据数据横轴和纵轴的点进行绘制,每个点用“.”表示,“linewidth”设置点的粗细,“color”设置点的颜色。下面同理
plt.plot(rel_test_y_x, rel_test_y_y, '.', linewidth=1.0, color='green')
plt.legend(["predict_after_10", "true_after_10"], loc='upper right')    #设置不同颜色点的标识,标识位置图片的右上角

# 创建第二个子图
plt.subplot(3, 1, 2)
plt.xlabel('step_time')
plt.ylabel('X')
plt.plot(x, test_y_x, ',', color='red')
plt.plot(x, rel_test_y_x, ',', color='green')
plt.legend(["predict_after_10", "true_after_10"], loc='upper right')

# 创建第三个子图
plt.subplot(3, 1, 3)
plt.xlabel('step_time')
plt.ylabel('Y')
plt.plot(x, test_y_y, ',', color='red')
plt.plot(x, rel_test_y_y, ',', color='green')
plt.legend(["predict_after_10", "true_after_10"], loc='lower right')

# 自动调节子图之间的间距
plt.tight_layout()

# 将绘制窗口显示出来
plt.show()
运行出绘制的结果如下图:
2、将上面的一个窗口中三个子图,绘制为两个窗口,一个窗口有一张图,另一个窗口有两个子图。
2.1、报错信息1:
将会遇到的报错信息:TypeError: subplots() takes from 1 to 3 positional arguments but 4 were given。
报错位置:在绘制第二个画布中的第二行“ax2=fig2.subplots(2,1,1)”
解决方法:将“subplots”改为“subplot”。
自我理解:“fig.subplots()”是生成一个画布一个子图时用的,如果想要在同一个画布中生成多个子图,需要用“subplot()”函数。
其他地方的更改:使用“fig1= plt.figure(1)”,“ax1=fig1.subplots()”生成一个画布和一个坐标系。
下面是报错代码:
# 创建横轴
x = np.arange(1200)
x.reshape(1200, 1)

# 生成一个Figure画布和一个Axes坐标系
fig1 = plt.figure(1)
ax1 = fig1.subplots()
plt.xlabel('X')        # 设置横坐标标签
plt.ylabel('Y')        # 设置纵坐标标签
ax1.plot(test_y_x, test_y_y, '.', linewidth=1.0, color='red')    # 根据数据横轴和纵轴的点进行绘制,每个点用“.”表示,“linewidth”设置点的粗细,“color”设置点的颜色。下面同理
ax1.plot(rel_test_y_x, rel_test_y_y, '.', linewidth=1.0, color='green')
ax1.legend(["predict_after_10", "true_after_10"], loc='upper right')    #设置不同颜色点的标识,标识位置图片的右上角

# 生成第二个画布,创建第一个子图
fig2 = plt.figure(2)
ax2 = fig2.subplots(2, 1, 1)
plt.xlabel('step_time')
plt.ylabel('X')
ax2.plot(x, test_y_x, ',', color='red')
ax2.plot(x, rel_test_y_x, ',', color='green')
ax2.legend(["predict_after_10", "true_after_10"], loc='upper right')

# 创建第二个子图
ax3 = fig2.add_subplots(2, 1, 2)
plt.xlabel('step_time')
plt.ylabel('Y')
ax3.plot(x, test_y_y, ',', color='red')
ax3.plot(x, rel_test_y_y, ',', color='green')
ax3.legend(["predict_after_10", "true_after_10"], loc='lower right')

# 自动调节子图之间的间距
plt.tight_layout()

# 将绘制窗口显示出来
plt.show()下面是改正后的代码:以第二张画布的第一个子图为例。将“fig2.subplots(2,1,1)”改为“fig2.subplot(2,1,1)”
# 生成第二个画布,创建第一个子图
fig2 = plt.figure(2)
ax2 = fig2.subplot(2, 1, 1)
plt.xlabel('step_time')
plt.ylabel('X')
ax2.plot(x, test_y_x, ',', color='red')
ax2.plot(x, rel_test_y_x, ',', color='green')
ax2.legend(["predict_after_10", "true_after_10"], loc='upper right')
2.2、报错信息2:
将会遇到的报错信息:ax2 = fig2.subplot(2, 1, 1)
AttributeError: 'Figure' object has no attribute 'subplot'
解决方法:将“fig2.subplot(2, 1, 1)”改为“fig2.add_subplot(2, 1, 1)”
自我理解:fig中没有“subplot()”函数
下面是改正后的代码:以第二张画布的第一个子图为例。将“fig2.subplots(2,1,1)”改为“fig2.subplot(2,1,1)”
# 生成第二个画布,创建第一个子图
fig2 = plt.figure(2)
ax2 = fig2.add_subplot(2, 1, 1)
plt.xlabel('step_time')
plt.ylabel('X')
ax2.plot(x, test_y_x, ',', color='red')
ax2.plot(x, rel_test_y_x, ',', color='green')
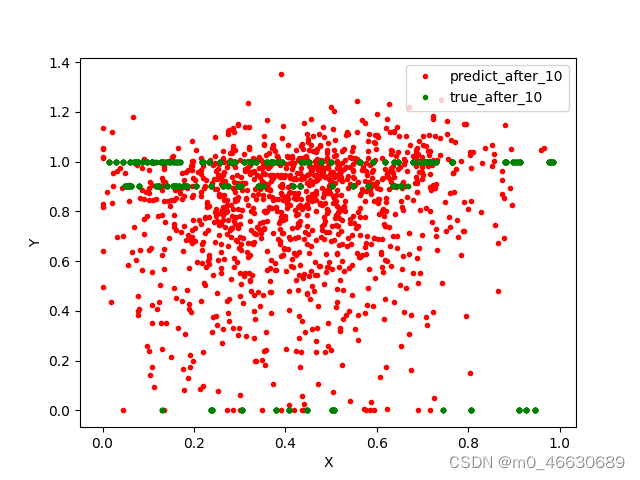
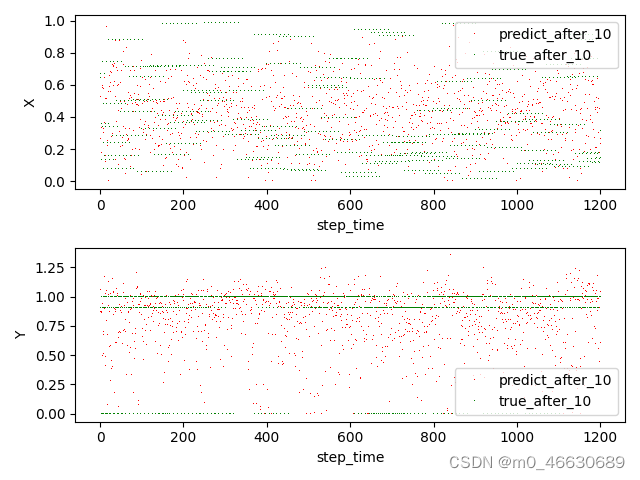
ax2.legend(["predict_after_10", "true_after_10"], loc='upper right')3、将一张画布中绘制三张子图,转变到一张画布中绘制一张子图 + 另一张画布中绘制两张子图的完整正确代码。
代码如下所示:上面提到的问题在下面代码中也进行了标识。
    x = np.arange(1200)
    x.reshape(1200, 1)


    # 生成一个Figure画布和一个Axes坐标系
    fig1 = plt.figure(1)
    ax1 = fig1.subplots()
    plt.xlabel('X')
    plt.ylabel('Y')
    ax1.plot(test_y_x, test_y_y, '.', linewidth=1.0, color='red')
    ax1.plot(rel_test_y_x, rel_test_y_y, '.', linewidth=1.0, color='green')
    ax1.legend(["predict_after_10", "true_after_10"], loc='upper right')

    # 创建图形
    fig2 = plt.figure(2)
    # 【问题2.1、在用多图的时候,函数名称是“subplot”,而不是“subplots”】
    # ax2 = fig2.subplot(2, 1, 1)
    # 【问题2.2、不能直接像上面那样使用,要改为下面这种】
    ax2 = fig2.add_subplot(2, 1, 1)

    plt.xlabel('step_time')
    plt.ylabel('X')
    ax2.plot(x, test_y_x, ',', color='red')
    ax2.plot(x, rel_test_y_x, ',', color='green')
    ax2.legend(["predict_after_10", "true_after_10"], loc='upper right')

    ax3 = fig2.add_subplot(2, 1, 2)
    plt.xlabel('step_time')
    plt.ylabel('Y')
    ax3.plot(x, test_y_y, ',', color='red')
    ax3.plot(x, rel_test_y_y, ',', color='green')

    ax3.legend(["predict_after_10", "true_after_10"], loc='lower right')

    # 【自动调节子图之间的间距】
    plt.tight_layout()

    plt.show()
最后运行结果图,如下所示。
参考链接:
matplotlib 绘制多个图形,如何同时独立显示? - 知乎 (zhihu.com) https://www.zhihu.com/question/280931066
下面链接中的回答是解决方法


 644
644

 被折叠的 条评论
为什么被折叠?
被折叠的 条评论
为什么被折叠?
 到【灌水乐园】发言


