


一、完整代码
def plot_2d_gp(gp, inputs, predictions=None, figure=None, axis=None,
               fixed_inputs=None, beta=3, fmin=None, **kwargs):
        """
        Plot a 2D GP with uncertainty.

        Parameters
        ----------
        gp: Instance of GPy.models.GPRegression
        inputs: 2darray
            The input parameters at which the GP is to be evaluated
        predictions: ndarray
            Can be used to manually pass the GP predictions, set to None to
            use the gp directly. Is of the form (mean, variance)
        figure: matplotlib figure
            The figure on which to draw (ignored if axis is provided
        axis: matplotlib axis
            The axis on which to draw
        fixed_inputs: list
            A list containing the the fixed inputs and their corresponding
            values, e.g., [(0, 3.2), (4, -2.43)]. Set the value to None if
            it's not fixed, but should not be a plotted axis either
        beta: float
            The confidence interval used
        fmin : float
            The safety threshold value.

        Returns
        -------
        axis
        """
        if fixed_inputs is None:
            if gp.kern.input_dim > 1:
                raise NotImplementedError('This only works for 1D inputs')
            fixed_inputs = []
        elif gp.kern.input_dim - len(fixed_inputs) != 1:
            raise NotImplemented('This only works for 1D inputs')

        ms = kwargs.pop('ms', 10)
        mew = kwargs.pop('mew', 3)
        point_color = kwargs.pop('point_color', 'k')

        if axis is None:
            if figure is None:
                figure = plt.figure()
                axis = figure.gca()
            else:
                axis = figure.gca()

        # Get a list of unfixed inputs to plot
        unfixed = list(range(gp.kern.input_dim))
        for dim, val in fixed_inputs:
            if val is not None:
                inputs[:, dim] = val
            unfixed.remove(dim)

        # Compute GP predictions if not provided
        if predictions is None:
            mean, var = gp._raw_predict(inputs)
        else:
            mean, var = predictions

        output = mean.squeeze()
        std_dev = beta * np.sqrt(var.squeeze())

        axis.fill_between(inputs[:, unfixed[0]],
                          output - std_dev,
                          output + std_dev,
                          facecolor='blue',
                          alpha=0.3)

        axis.plot(inputs[:, unfixed[0]], output, **kwargs)
        axis.scatter(gp.X[:-1, unfixed[0]], gp.Y[:-1, 0], s=20 * ms,
                     marker='x', linewidths=mew, color=point_color)
        axis.scatter(gp.X[-1, unfixed[0]], gp.Y[-1, 0], s=20 * ms,
                     marker='x', linewidths=mew, color='r')
        axis.set_xlim([np.min(inputs[:, unfixed[0]]),
                       np.max(inputs[:, unfixed[0]])])

        if fmin is not None:
            axis.plot(inputs[[0, -1], unfixed[0]], [fmin, fmin], 'k--')

        return axis
二、关键步骤
1. 调用 mean, var = gp._raw_predict(inputs)函数
2. 绘制图形axis.plot(inputs[:, unfixed[0]], output, **kwargs)
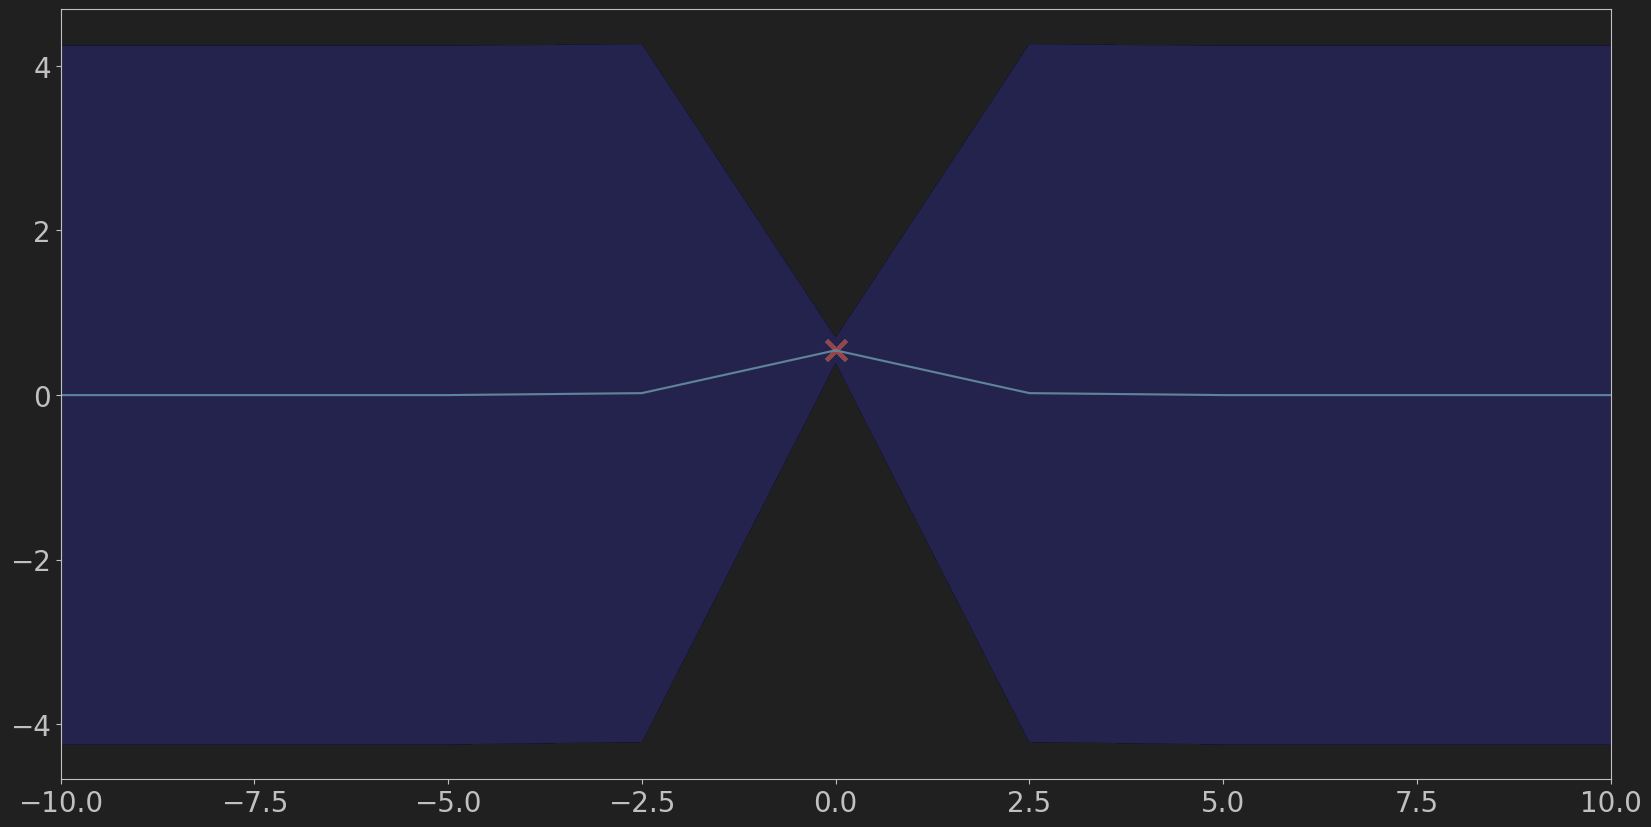
绘制结果:
- 只有初始点
- 加上下一个点
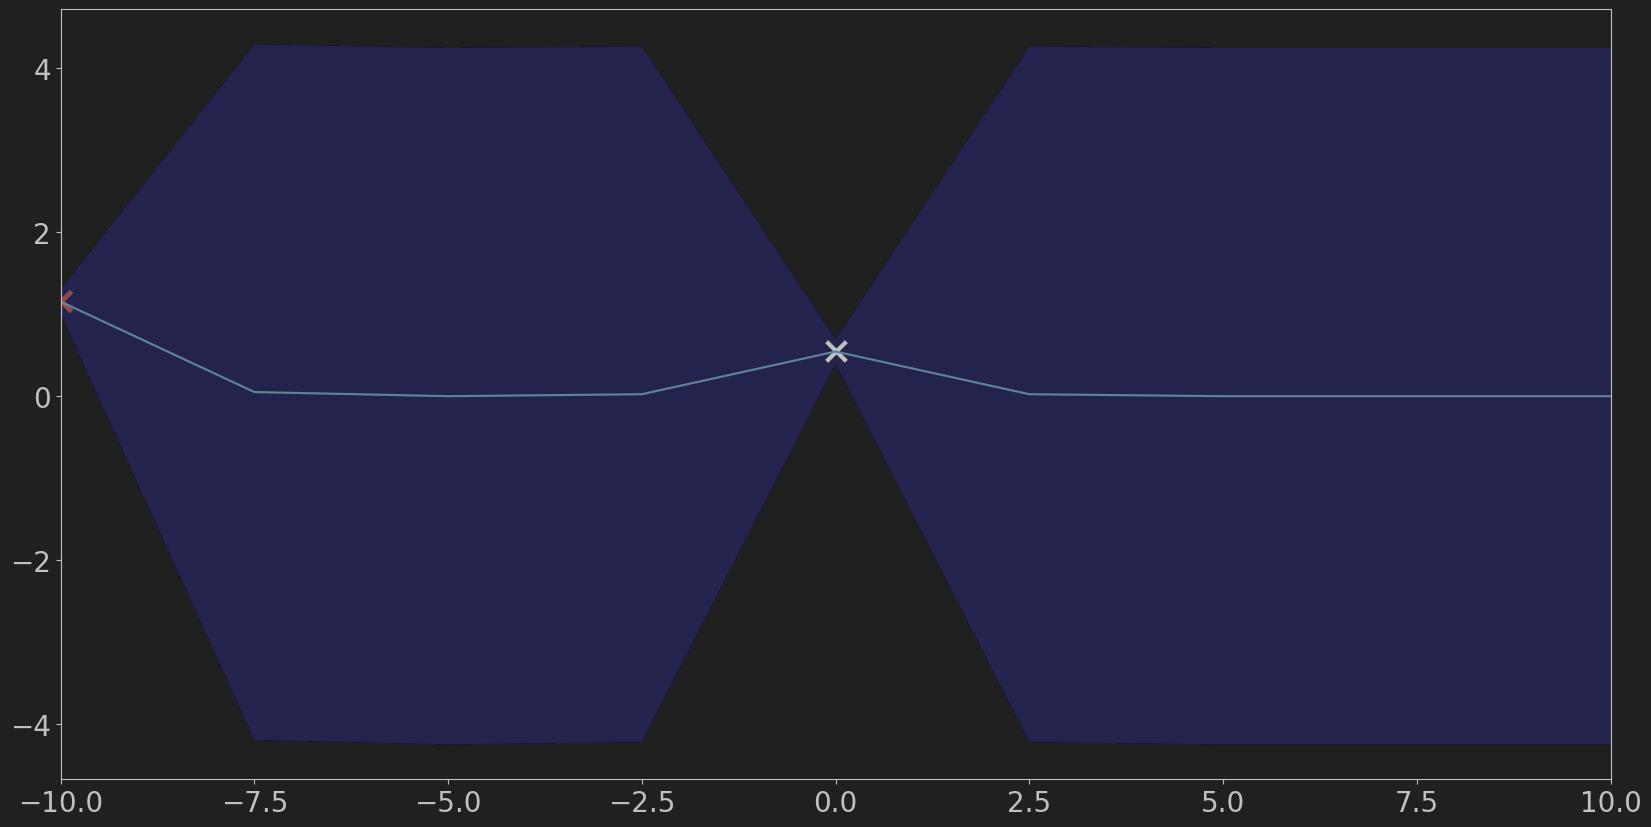
依旧符合高斯分布的特点
- 在已知点 mean等于该点的值
- 在已知点 std最小
三、predict的调用
1.直接调用mean, var = gp.predict(parameter_set)
gp是GPRegression类,集成GP类,调用的是gp中的_raw_predict函数
2.在plot_2d_gp中:也是用的gp._raw_predict(inputs)


 8万+
8万+

 被折叠的 条评论
为什么被折叠?
被折叠的 条评论
为什么被折叠?
 到【灌水乐园】发言


