


1.1实验目的
1,掌握绘制二维图形的常用函数;
2,掌握绘制三维图形的常用函数;
3,掌握绘制图形的辅助操作。
1.2实验内容

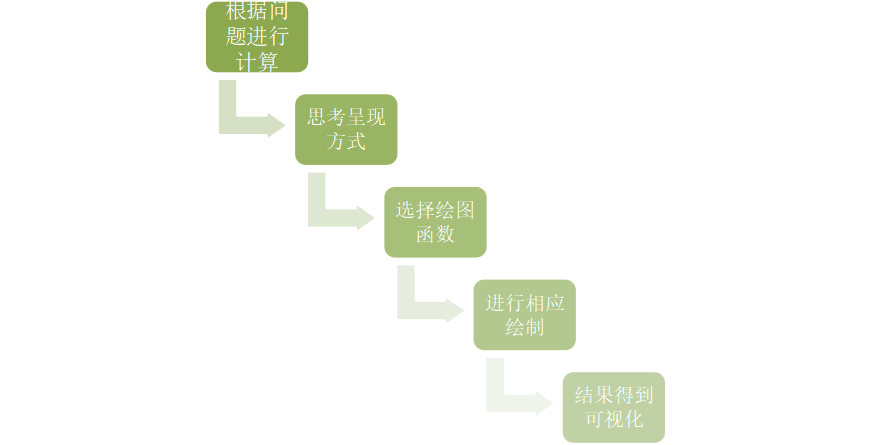
1.3流程图
1.4程序清单
clc
clear
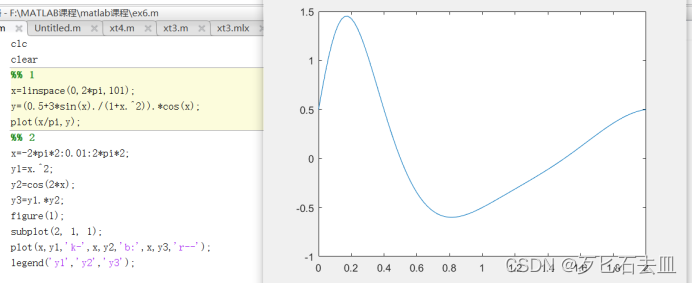
%% 1
x=linspace(0,2*pi,101);
y=(0.5+3*sin(x)./(1+x.^2)).*cos(x);
plot(x/pi,y);
%% 2
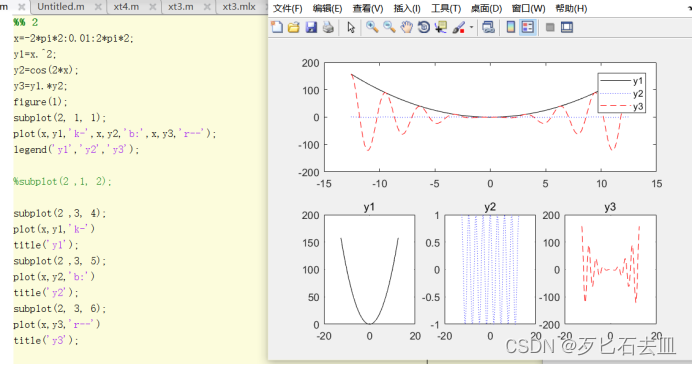
x=-2*pi*2:0.01:2*pi*2;
y1=x.^2;
y2=cos(2*x);
y3=y1.*y2;
figure(1);
subplot(2, 1, 1);
plot(x,y1,'k-',x,y2,'b:',x,y3,'r--');
legend('y1','y2','y3');
%subplot(2 ,1, 2);
subplot(2 ,3, 4);
plot(x,y1,'k-')
title('y1');
subplot(2 ,3, 5);
plot(x,y2,'b:')
title('y2');
subplot(2, 3, 6);
plot(x,y3,'r--')
title('y3');
figure(5);
subplot(4 ,3, 10);
fill(x,y1,'r');
ylabel('fill');
subplot(4 ,3, 11);
fill(x,y2,'r');
subplot(4 ,3, 12);
fill(x,y3,'r');
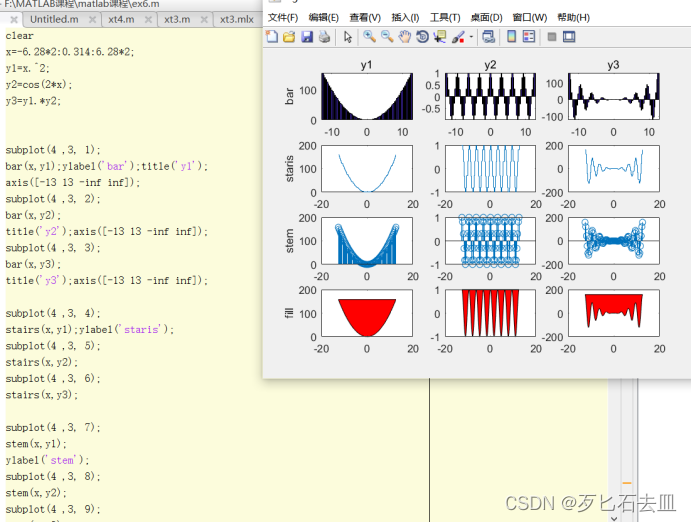
clear
x=-6.28*2:0.314:6.28*2;
y1=x.^2;
y2=cos(2*x);
y3=y1.*y2;
subplot(4 ,3, 1);
bar(x,y1);ylabel('bar');title('y1');
axis([-13 13 -inf inf]);
subplot(4 ,3, 2);
bar(x,y2);
title('y2');axis([-13 13 -inf inf]);
subplot(4 ,3, 3);
bar(x,y3);
title('y3');axis([-13 13 -inf inf]);
subplot(4 ,3, 4);
stairs(x,y1);ylabel('staris');
subplot(4 ,3, 5);
stairs(x,y2);
subplot(4 ,3, 6);
stairs(x,y3);
subplot(4 ,3, 7);
stem(x,y1);
ylabel('stem');
subplot(4 ,3, 8);
stem(x,y2);
subplot(4 ,3, 9);
stem(x,y3);
%% 3
x=-5:0.01:5;
y=(x+pi^0.5)/exp(2).*(x<=0)+1/2*log(x+(1+x.^2).^0.5).*(x>0);
plot(x,y);
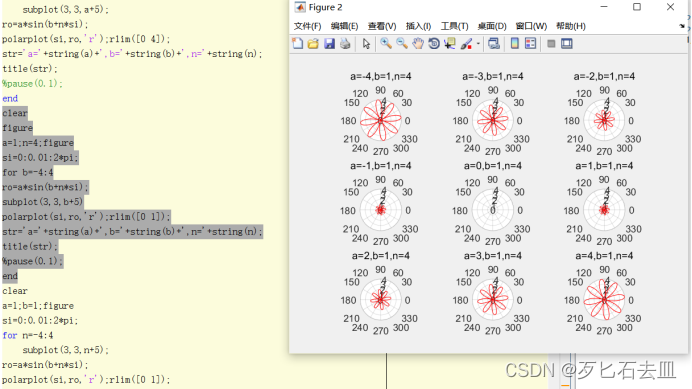
%% 4
clc
clear
si=0:0.01:2*pi;
b=1;n=1;figure
for a=-4:4
subplot(3,3,a+5);
ro=a*sin(b+n*si);
polarplot(si,ro,'r');rlim([0 4]);
str='a='+string(a)+',b='+string(b)+',n='+string(n);
title(str);
%pause(0.1);
end
clear
a=1;n=1;figure
si=0:0.01:2*pi;
for b=-4:4
ro=a*sin(b+n*si);
subplot(3,3,b+5)
polarplot(si,ro,'r');rlim([0 1]);
str='a='+string(a)+',b='+string(b)+',n='+string(n);
title(str);
%pause(0.1);
end
clear
a=1;b=1;figure
si=0:0.01:2*pi;
for n=-4:4
subplot(3,3,n+5);
ro=a*sin(b+n*si);
polarplot(si,ro,'r');rlim([0 1]);
str='a='+string(a)+',b='+string(b)+',n='+string(n);
title(str);
%pause(0.1);
end
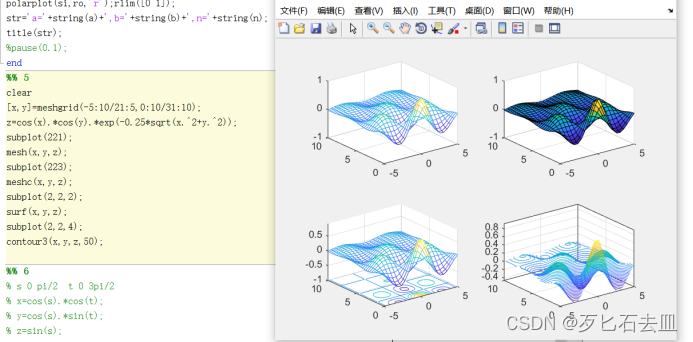
%% 5
clear
[x,y]=meshgrid(-5:10/21:5,0:10/31:10);
z=cos(x).*cos(y).*exp(-0.25*sqrt(x.^2+y.^2));
subplot(221);
mesh(x,y,z);
subplot(223);
meshc(x,y,z);
subplot(2,2,2);
surf(x,y,z);
subplot(2,2,4);
contour3(x,y,z,50);
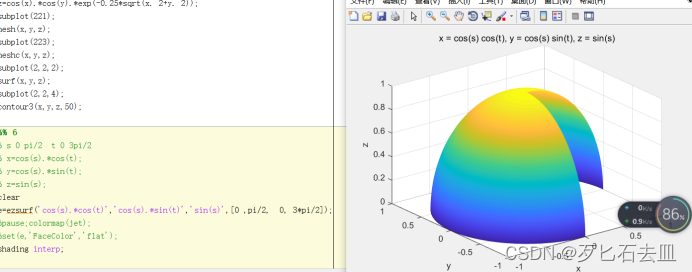
%% 6
% s 0 pi/2 t 0 3pi/2
% x=cos(s).*cos(t);
% y=cos(s).*sin(t);
% z=sin(s);
clear
e=ezsurf('cos(s).*cos(t)','cos(s).*sin(t)','sin(s)',[0 ,pi/2, 0, 3*pi/2]);
%pause;colormap(jet);
%set(e,'FaceColor','flat');
shading interp;
1.5运行结果及分析
1.
2.
3.
4.a对圆的大小有影响,负的a时圆在左下方,正的a圆在右上方。
b对圆的位置有影响。
n对其形状有影响,决定这形状是几个瓣。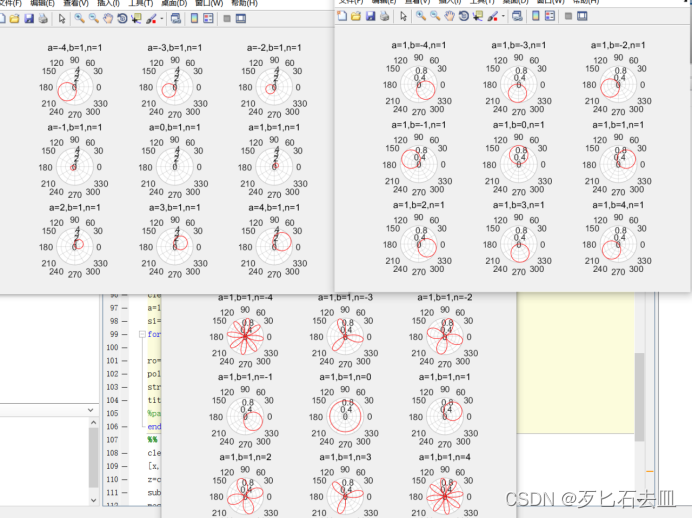
5.
6.
1.6实验的收获与体会
本次实验我掌握绘制二维图形和三维图形的常用函数,并掌握绘制图形的辅助操作。
绘图是matlab的另一大特色,好的绘图可以给自己的论证提供巨大的帮助。图片可以提供的信息量在一定程度上是高于文字或者表格的。
图片也是一种表达,是一种高效的表达。以后无论是论文也好,PPT介绍也好,用上matlab绘制的图片一定可以增色不少。因此学好这一章节,学好matlab绘图对我们来说十分重要。一定要多练习,多探索,这样才能学会并熟练掌握这一技能。


 8444
8444


 被折叠的 条评论
为什么被折叠?
被折叠的 条评论
为什么被折叠?
 到【灌水乐园】发言


