


前言
关于一个睡不着的大学生在学习机器学习这档子事 T_T 可恶,写着写着就困了(╯ ̄Д ̄)╯╘═╛
目的:普通的分类实验
将存放好的数据集进行分类,画出决策边界
想法
- 当数据集长这样子的时候,可以直观的发现决策边界是一条曲线。所以选择多项式回归模型

2.然后对特征进行映射,生成在只有两个特征的情况下,得到更多的特征。
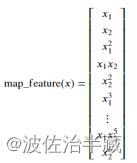
3.同样也会得到更多的参数,这是通过Pycharm debug功能得到的参数w的内容,可以看到在19和26处他们的比重是比其他的其大很多的,但也有像是-4,-5,0.278这样的小比重的存在,这可能会导致曲线过拟合.
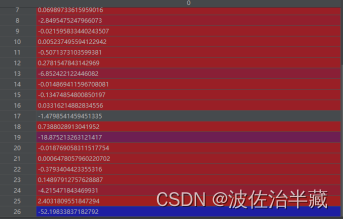
- 正则化可以保留所有特征,通过减小参数w的幅度来解决过拟合。举个栗子(烂梗):把上图的所有数字都进行乘上一个0.01,这样来看是不是很多数字的影响就更微乎其微了呢?(๑乛◡乛๑)。
得到的结果如下

引入代码(推荐去看吴恩达老师的课( ͡° ͜ʖ ͡°)✧)
main.py (需要下载matplotlib和numpy)
import math

import numpy as np
from matplotlib import pyplot as plt
from utils import plot_data, plot_decision_boundary,map_feature

def get_dataset_quad(N=100, pi=0.3):
    positive = int(N * pi)
    negative = N - positive
    data, target = [], []
    for i in range(positive):
        x = np.random.rand() * 2 - 1
        data.append([x, 2 * x * x + np.random.rand() * 2])
        target.append(1)
    for i in range(negative):
        x = np.random.rand() * 2 - 1
        data.append([x, 2 * x * x - np.random.rand() * 2])
        target.append(0)
    return np.array(data), np.array(target).reshape((-1, 1))


def sigmoid(z):
    g = 1 / (1 + np.exp(-z))
    return g


def compute_cost_reg(X, y, w, b, lambda_=0.01):
    m = X.shape[0] #100
    z = np.dot(X, w) + b
    f = sigmoid(z)+1e-5 #其中包含0 使得log(f)有除0错误
    reg = (lambda_ / (2 * m)) * np.sum(np.square(w))
    np.seterr(divide="ignore", invalid="ignore")
    f = np.where(f>1,0.999,f)
    cost = (1 / m) * np.sum(-y * np.log(f) - (1 - f) * np.log(1 - f)) + reg
    return cost


def compute_gradient_reg(X, y, w, b, lambda_=0.01):
    m = X.shape[0]
    f = sigmoid(np.dot(X, w) + b)
    err = (f - y)
    dw = (1 / m) * np.dot(X.T, err)
    dw += (lambda_ / m) * w
    db = (1 / m) * np.sum(err)
    return db, dw

def predict(X, w, b):
    f_w = sigmoid(np.dot(w.T, X) + b)
    p = f_w >= 0.5
    return f_w, p


def gradient_descent(X, y, w_in, b_in, cost_function, gradient_function, alpha, num_iters, lambda_):
    J_history = []
    w_history = []
    for i in range(num_iters):
        dj_db, dj_dw = gradient_function(X, y, w_in, b_in, lambda_)
        w_in = w_in - alpha * dj_dw
        b_in = b_in - alpha * dj_db
        if i < 100000:
            cost = cost_function(X, y, w_in, b_in, lambda_)
            J_history.append(cost)
        if i % math.ceil(num_iters / 10) == 0 or i == (num_iters - 1):
            w_history.append(w_in)
            print(f"Iteration {i:4}: Cost {float(J_history[-1]):8.2f}   ")
    return w_in, b_in, J_history, w_history


data, target = get_dataset_quad()
X_mapped = map_feature(data[:, 0], data[:, 1])
print(X_mapped.shape)
plot_data(data, target)

plt.show()
initial_w = (np.random.rand(X_mapped.shape[1])-0.5).reshape((-1,1))
initial_b = -1
iterations = 10000
alpha = 0.01
lambda_ = 0.1
w, b, J_history, _ = gradient_descent(X_mapped, target, initial_w, initial_b,
                                      compute_cost_reg, compute_gradient_reg, alpha, iterations,lambda_)
plot_decision_boundary(w, b, X_mapped, target)
plt.show()
utils.py (一个存放函数库)
import numpy as np
import matplotlib.pyplot as plt

def load_data(filename):
    data = np.loadtxt(filename, delimiter=',')
    X = data[:,:2]
    y = data[:,2]
    return X, y

def sig(z):

    return 1/(1+np.exp(-z))

def map_feature(X1, X2):
    """
    Feature mapping function to polynomial features
    """
    X1 = np.atleast_1d(X1)
    X2 = np.atleast_1d(X2)
    degree = 6
    out = []
    for i in range(1, degree+1):
        for j in range(i + 1):
            out.append((X1**(i-j) * (X2**j)))
    return np.stack(out, axis=1)


def plot_data(X, y, pos_label="y=1", neg_label="y=0",color0='yo',color1='bo'):
    positive =np.squeeze(y) == 1
    negative =np.squeeze(y) == 0

    # Plot examples
    plt.plot(X[positive, 0], X[positive, 1],color1 , label=pos_label)
    plt.plot(X[negative, 0], X[negative, 1],color0 , label=neg_label)


def plot_decision_boundary(w, b, X, y):
    plot_data(X[:, 0:2], y)
    if X.shape[1] <= 2:
        plot_x = np.array([min(X[:, 0]), max(X[:, 0])])  #(2,)
        plot_y = (-1. / w[1]) * (w[0] * plot_x + b)  #w[0]  (50,)
        plt.plot(plot_x, plot_y, c="b")
    else:
        u = np.linspace(-1, 1.5, 50)
        v = np.linspace(-1, 1.5, 50)

        z = np.zeros((len(u), len(v)))

        # Evaluate z = theta*x over the grid
        for i in range(len(u)):
            for j in range(len(v)):
                z[i,j] = sig(np.dot(map_feature(u[i], v[j]), w) + b)

        # important to transpose z before calling contour
        z = z.T

        # Plot z = 0
        plt.contour(u,v,z, levels = [0.5], colors="g")
遇到的错误以及解决方案 (真的改的很辛苦(╥╯^╰╥))
First bug:ValueError: setting an array element with a sequence.
你的初始的target的shape属性打印出来是个 --> (100,),而feature的shape属性是–> (100,2),你只需要小小的reshape一下就行了,至于怎么reshape——任意门!!!
-------->>> https://blog.csdn.net/a8039974/article/details/119925040?ops_request_misc=%257B%2522request%255Fid%2522%253A%2522168280341416800182773879%2522%252C%2522scm%2522%253A%252220140713.130102334…<<<------------我去,这传送门还有点长( ̄^ ̄)
Second bug:RuntimeWarning: divide by zero encountered in log
我们的有些w参数比重很大,有些很小,导致在sigmoid函数上求得的值有1和0,如果你不仔细进行debug的话,就会有功夫带师的感觉
( ˙灬˙ ):这两个w,不讲码德,来骗,来偷袭,我21岁的大学生,这好吗?这不好。所以我们应该要怎么劝这两位w耗子喂汁。
提高下限,降低上线即可。都在代码里面了哟
Third bug:ValueError: operands could not be broadcast together with shapes (2,) (50,)
这代表了你矩阵相乘的时候,不符合规则,第一个矩阵的列要和第二个矩阵的行的数目是一样的。栗子:(2,50)×(50,1)=(2,1)


 1733
1733


 被折叠的 条评论
为什么被折叠?
被折叠的 条评论
为什么被折叠?
 到【灌水乐园】发言


