


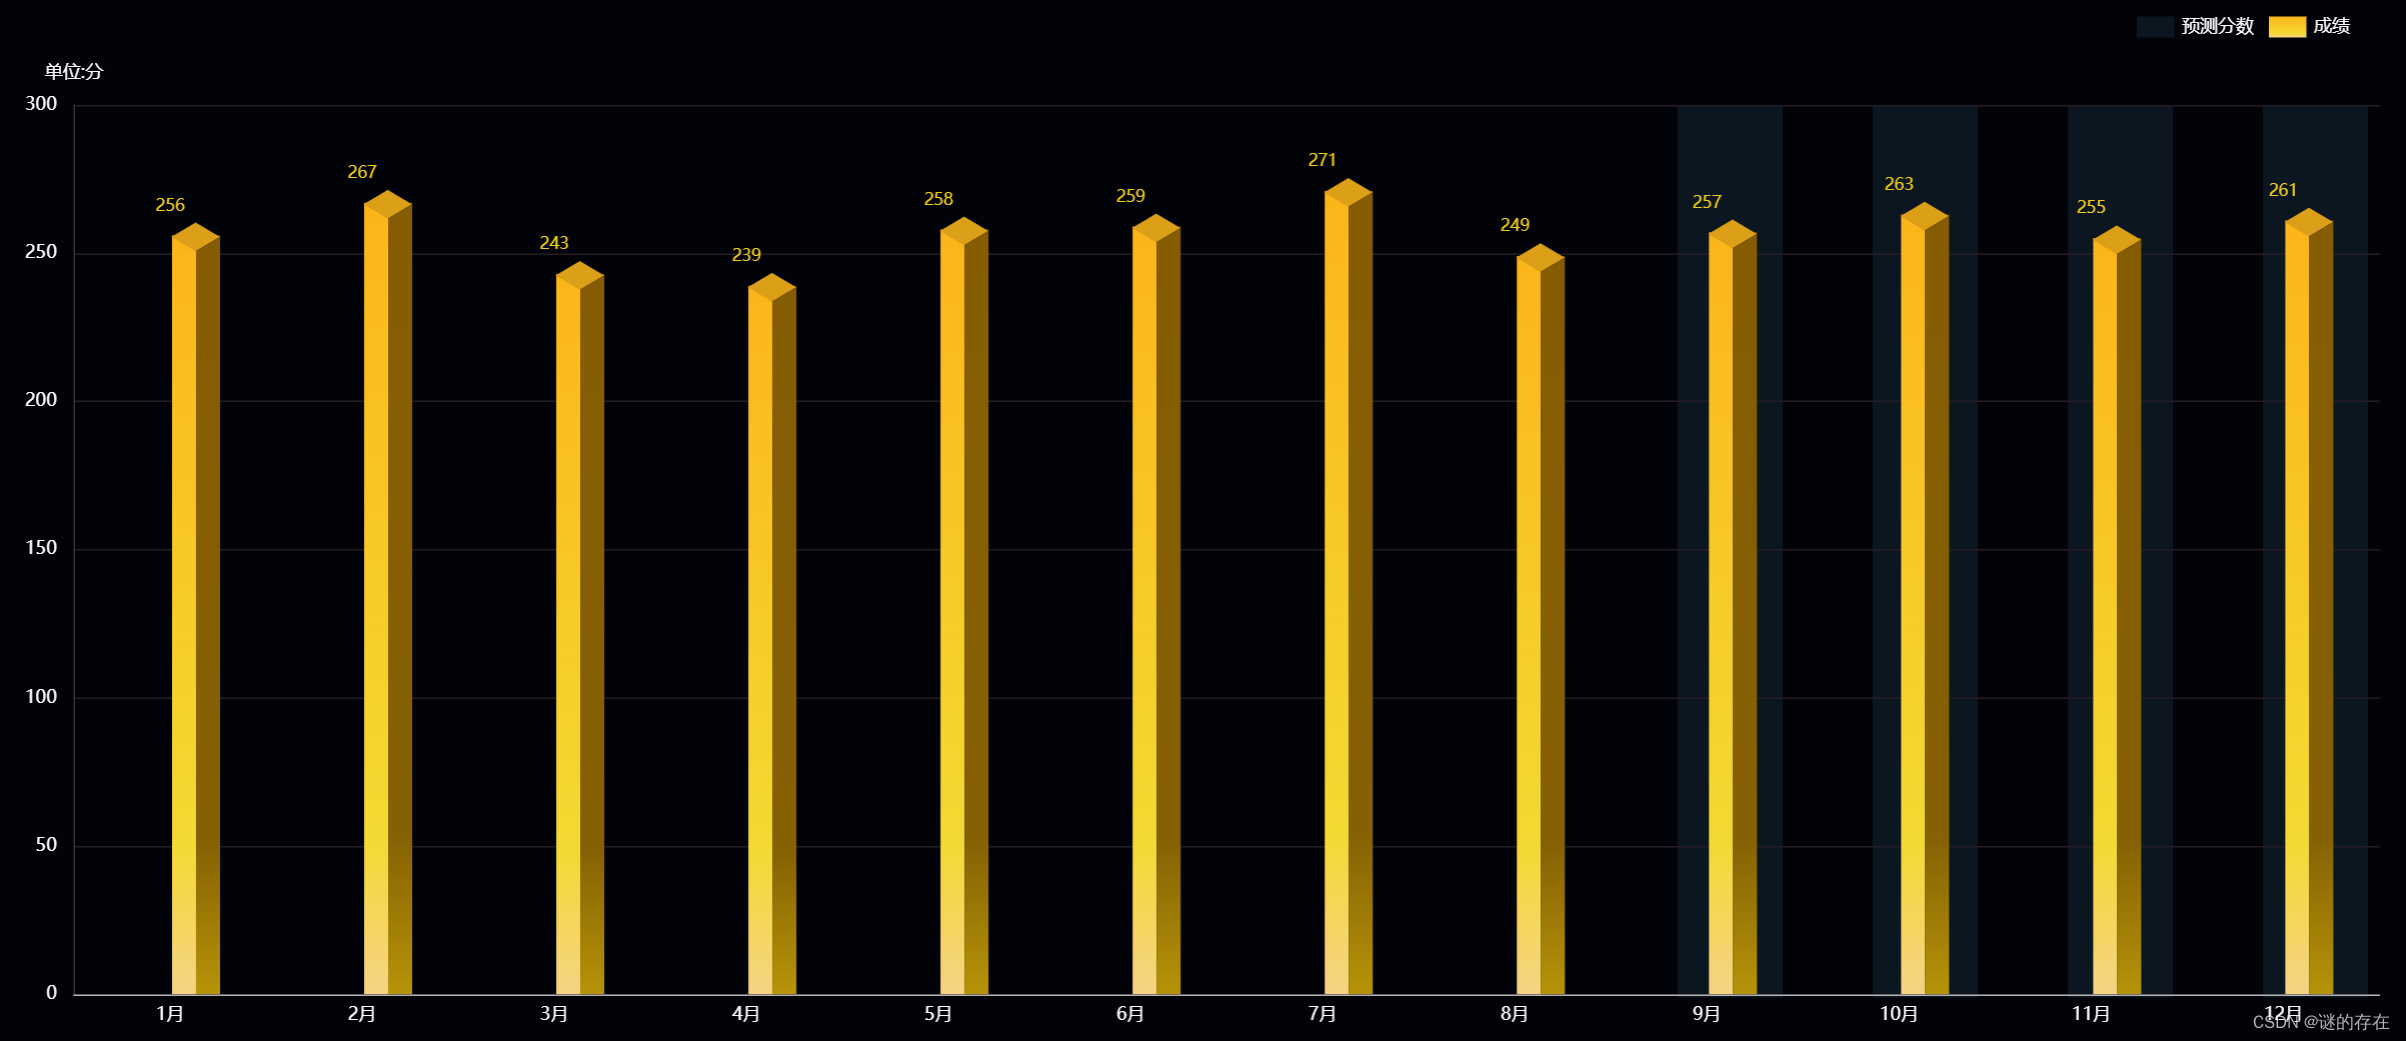
首先,搭建好Vue 3项目并集成ECharts,这里不做详细描述。本文以月考统计为例。
最终效果如下:
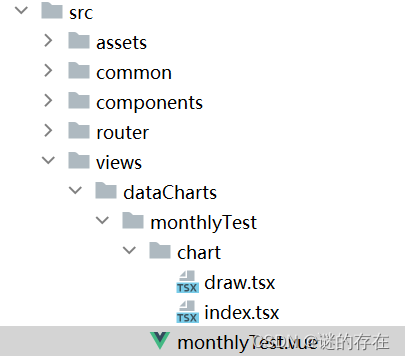
1.以下是我的项目结构,其中,draw.tsx用来绘制图表,index.tsx里面用来写模拟数据,monthlyTest.vue文件则做界面展示。
2.draw.tsx的代码如下
import { defineComponent, watch, ref } from 'vue'
import * as echarts from 'echarts'
// 声明类型
const PropsType = {
  cdata: {
    type: Object,
    require: true
  }
} as const

// 定义主体
export default defineComponent({
  props: PropsType,
  setup(props) {
    // 定义 ref
    const chartRef = ref()
    // 配置项
    let options = {}

    // 监听
    watch(
      () => props.cdata,
      (val: any) => {
        options = {
          tooltip: {
            show: true,
            trigger: "item",
            axisPointer: {
              type: "shadow",
              label: {
                show: true,
                backgroundColor: "#7B7DDC"
              }
            }
          },
          legend: {//图例标签相关设置
            show: true,
            top:50,
            right:100,
            icon:'rect'
          },
          grid: {//坐标系相关设置
            x: "9%",
            width: "90%",
            top: "15%",
            bottom: '7%',
            left:'5%'
          },
          xAxis: {//x轴相关设置
            data: val.category,
            axisLine: {//轴颜色
              lineStyle: {
                color: "#B4B4B4"
              }
            },
            axisTick: {
              show: false
            }
          },
          yAxis: [
            {
              name: '单位:分', // 设置坐标轴标题
              nameTextStyle: {
                color: '#ffffff', // 设置标题的颜色
              },

              splitLine: {
                show: true,
                lineStyle: {
                  color: "rgb(37,28,37)"
                }
              },
              axisLine: {
                lineStyle: {
                  color: "rgba(66,59,66,0.84)"
                }
              },
              //y轴标签
              axisLabel: {
                formatter: "{value} ",
              }
            },
          ],
          series: [//图表配置
            {
              name: "预测分数",//只保留图例标签
              type: "bar",
              itemStyle: {
                normal: {
                  color: "rgba(45,100,134,0.2)"
                }
              },
            },
            {
              name: "成绩",
              type: "bar",
              barWidth: 16,
              emphasis: {
                itemStyle: {
                  color: '#eac50b'
                }
              },
              itemStyle: {
                normal: {//渐变色效果
                  color: new echarts.graphic.LinearGradient(0, 0, 0, 1, [
                    { offset: 0, color: "rgb(252,181,25)" },
                    { offset: 0.8, color: "rgb(243,218,50)" },
                    { offset: 1, color: "rgb(246,211,132)" }
                  ]),
                  barBorderRadius: [0, 0, 0, 0],
                  opacity: '1'
                }
              },
              data: val.achievement//数据由index传入
            },
            {
              name: "成绩",
              tooltip: {
                show: false
              },
              type: "bar",
              barWidth: 16,
              itemStyle: {
                normal: {
                  color: new echarts.graphic.LinearGradient(0, 0, 0, 1, [
                    { offset: 0, color: "rgb(133,92,2)" },
                    { offset: 0.8, color: "rgb(134,97,4)" },
                    { offset: 1, color: "rgb(182,148,8)" }
                  ]),
                  barBorderRadius: [0, 0, 0, 0],
                  opacity: '1'
                }
              },
              data: val.achievement,
              barGap: 0,
              legendHoverLink: false,
            },
            {
              name: "成绩",//顶部凌型效果
              tooltip: {
                show: false
              },
              type: 'pictorialBar',

              itemStyle: {
                normal: {
                  color: '#dc9f18',
                  opacity: '1',
                  borderWidth: 1,
                  shadowColor: 'rgb(0,0,0,0.1)',
                  shadowOffsetX: '0.5',
                  shadowOffsetY: '0.5'
                }
              },
              label: {//柱形顶部字体相关设置
                show: true,
                color: '#f3ce16',
                offset: [0, 0],
                position: 'top',
                fontSize: '11',
                fontWeight: 'normal'
              },
              symbol: 'diamond',
              symbolRotate: 0,
              symbolSize: ['32', '19'],//大小[左右,上下]
              symbolOffset: ['17', '-9'],//偏移[左右,上下]
              symbolPosition: 'end',
              data: val.achievement,
              z: 3
            },
          ],
          graphic: [//图中成绩预测部分的灰色条形背景
            {
              type: 'rect',
              right: 483,
              bottom:51,
              shape: {
                width: 70,
                height: 595
              },
              style: {
                fill: 'rgba(45,100,134,0.2)'
              }
            },
            {
              type: 'rect',
              right: 353,
              bottom:51,
              shape: {
                width: 70,
                height: 595
              },
              style: {
                fill: 'rgba(45,100,134,0.2)'
              }
            },
            {
              type: 'rect',
              right: 223,
              bottom:51,
              shape: {
                width: 70,
                height: 595
              },
              style: {
                fill: 'rgba(45,100,134,0.2)'
              }
            },
            {
              type: 'rect',
              right: 93,
              bottom:51,
              shape: {
                width: 70,
                height: 595
              },
              style: {
                fill: 'rgba(45,100,134,0.2)'
              }
            },
          ],
        }
        // 手动触发更新
        if (chartRef.value) {
          // 通过初始化参数打入数据
          chartRef.value.initChart(options)
        }
      },
      {
        immediate: true,
        deep: true
      }
    )

    return () => {
      const height = "760px"
      const width = "100%"

      return <div>
        <echart ref={chartRef} height={height} width={width} />
      </div>
    }
  }
})
3.index.tsx代码如下
import { defineComponent, reactive ,onMounted} from 'vue'
import Draw from './draw'

export default defineComponent({
  components: {
    Draw
  },
  setup() {
    const cdata = reactive({
      category: [],
      achievement: [],
    })
    // methods
    const setData = () => {//这里设置模拟数据。也可通过后台获取数据
        cdata.category=["1月", "2月", "3月", "4月", "5月", "6月", "7月", "8月", "9月", "10月", "11月", "12月"]
        cdata.achievement=[256, 267, 243, 239, 258, 259, 271, 249, 257, 263, 255, 261]
    }
    //生命周期
    onMounted(() => {
      setData()
    })
    return () => {
      return <div>
        <Draw cdata={cdata} />
      </div>
    }
  }
})
4.monthlyTest.vue代码如下
<template>
  <div>
    <chart />
  </div>
</template>

<script>
import { defineComponent } from 'vue'
import Chart from "./chart";
export default defineComponent({
  components: {
    Chart
  }
})
</script>

<style lang="scss" scoped>
</style>


 4920
4920


 被折叠的 条评论
为什么被折叠?
被折叠的 条评论
为什么被折叠?
 到【灌水乐园】发言


