Linear Regression with one variable
实验要求
"""
在这部分练习中,您将使用一个变量实现线性回归,以预测食品卡车的利润。
假设你是一家餐厅特许经营公司的首席执行官,正在考虑在不同的城市开设新的分店。
该连锁店已经在各个城市拥有卡车,您可以从这些城市获得利润和人口数据。

您希望使用此数据来帮助您选择下一个要扩展到的城市。
文件ex1data1.txt包含线性回归问题的数据集。
第一列是一个城市的人口,第二列是该城市食品卡车的利润。利润为负值表示亏损。
"""
代码部分如下
import numpy as np
import pandas as pd
import matplotlib.pyplot as plt
加载数据集
data = pd.read_csv('ex1data1.txt',names = ['Population','Profit']) # names参数传递列表,将名字命名在对应列上
data_x = np.array(data['Population'])  # 将数据名为x的列提取
data_y = np.array(data['Profit'])  # 同上
data.head()  # 是指取数据的前n行数据,默认是前5行。
打印了前五行数据
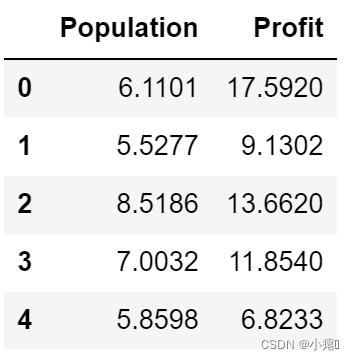
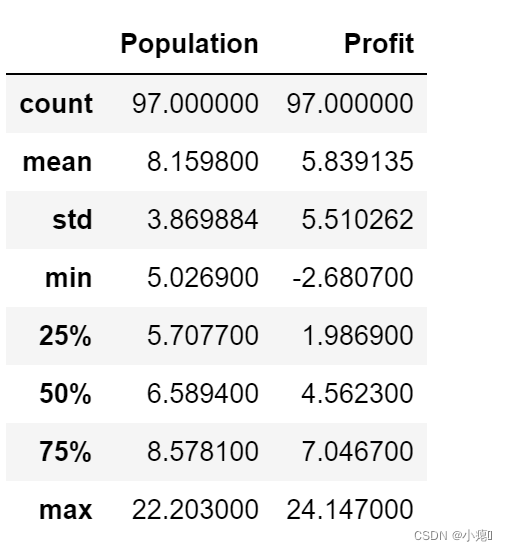
看看数据分布
data.describe() # count数据量 mean均值 std标准差 min最小值 max最大值
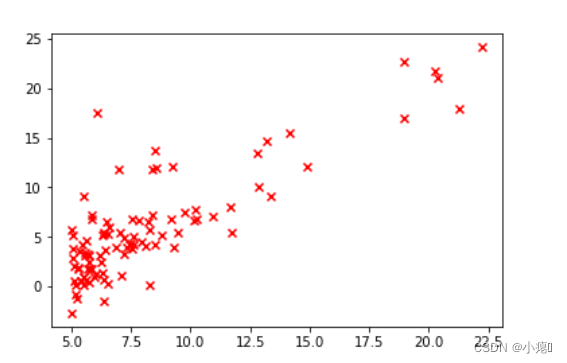
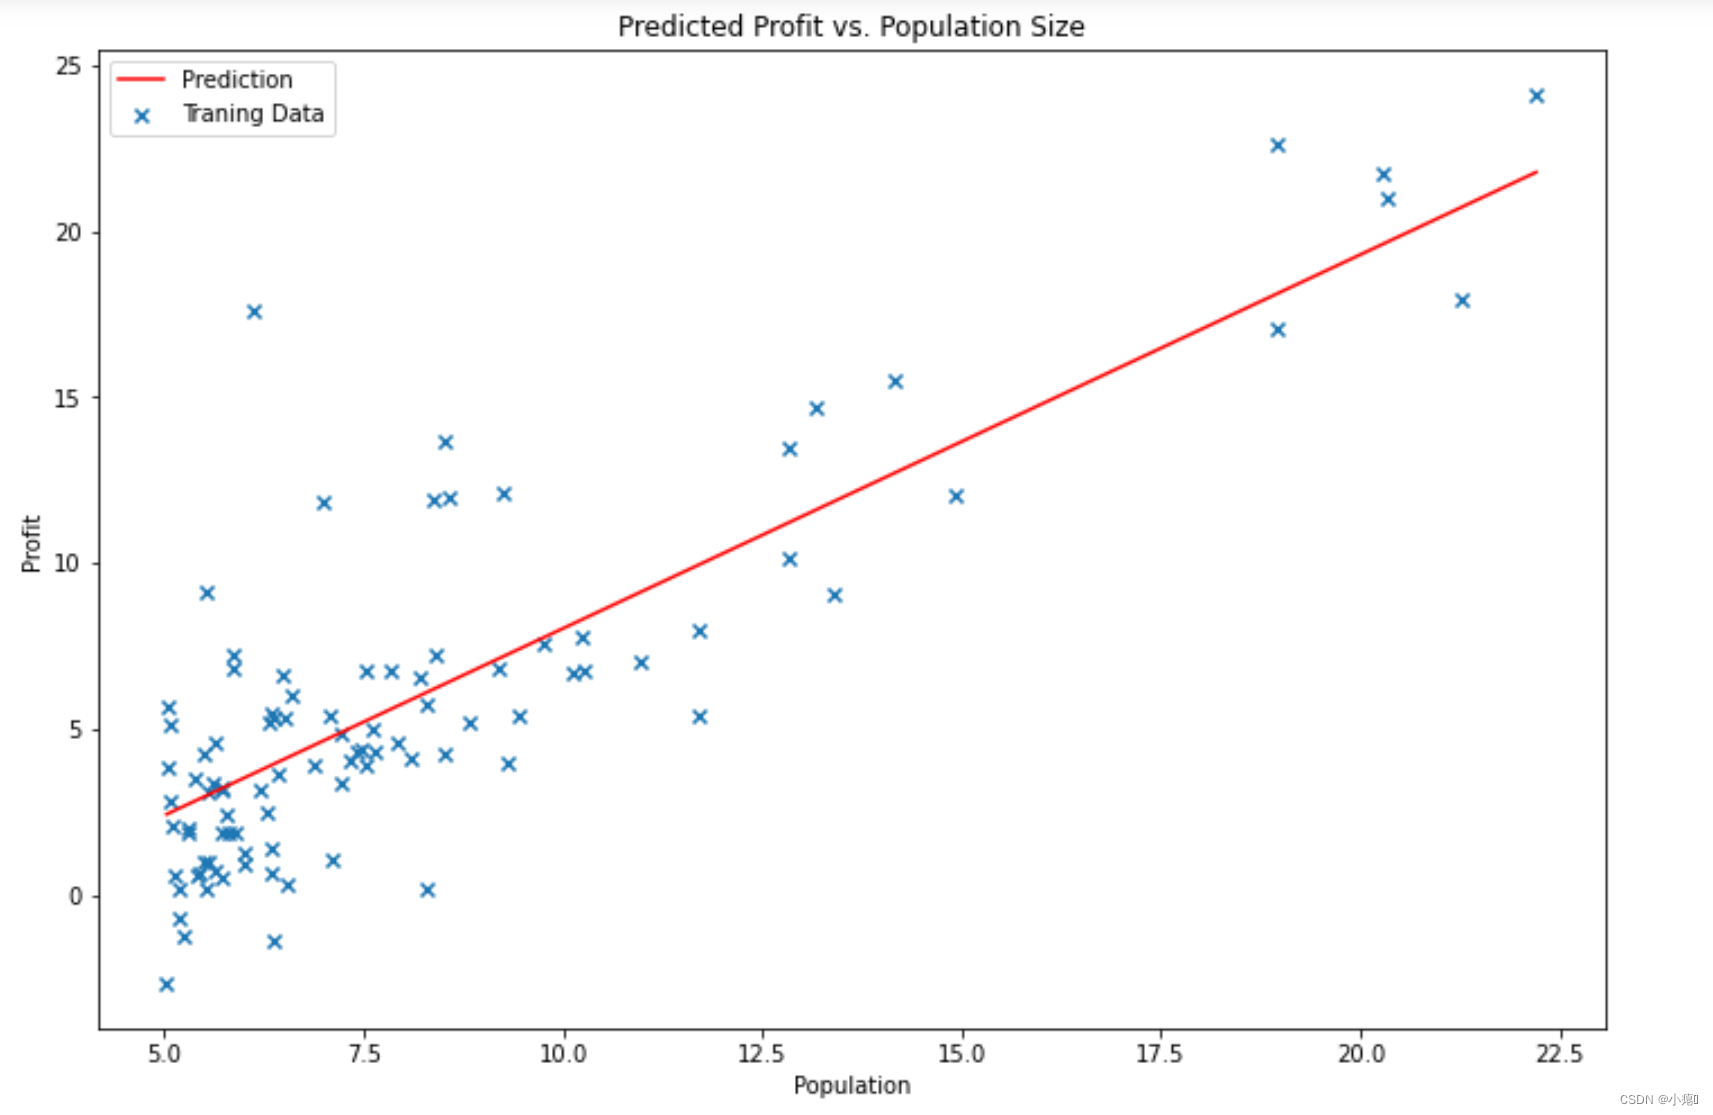
绘图观察数据在坐标上的分布。
目标:利用梯度下降,使代价函数代价最小化,从而使假设函数更好地拟合数据,完成线性回归从而作出新的预测。
下面是代价函数:
J
(
θ
)
=
1
2
m
∑
i
=
1
m
(
h
θ
(
x
(
i
)
)
−
y
(
i
)
)
2
J\left( \theta \right)=\frac{1}{2m}\sum\limits_{i=1}^{m}{{{\left( {{h}_{\theta }}\left( {{x}^{(i)}} \right)-{{y}^{(i)}} \right)}^{2}}}
J(θ)=2m1i=1∑m(hθ(x(i))−y(i))2
# 代价函数
def computeCost(X,y,theta):
    inner = np.dot(X,theta.T)
    result = np.sum(np.power(inner - y,2))
    return result/( 2 * len(X))
让我们在训练集中添加一列,保存theta0的占位符。
以便我们可以使用向量化的解决方案来计算代价和梯度。
在第0个列上建造一个新列’ones’,插入值1,方便后面计算时theta0的x系数为1.
因为:
h
(
x
)
=
θ
0
+
θ
1
x
h(x) = \theta_0 + \theta_1 x
h(x)=θ0+θ1x
以下两式由梯度下降和代价函数求偏导数后求出。
θ
0
:
=
θ
0
−
a
1
m
∑
i
=
1
m
(
h
θ
(
x
(
i
)
)
−
y
(
i
)
)
{\theta_{0}}:={\theta_{0}}-a\frac{1}{m}\sum\limits_{i=1}^{m}{ \left({{h}_{\theta }}({{x}^{(i)}})-{{y}^{(i)}} \right)}
θ0:=θ0−am1i=1∑m(hθ(x(i))−y(i))
θ
1
:
=
θ
1
−
a
1
m
∑
i
=
1
m
(
(
h
θ
(
x
(
i
)
)
−
y
(
i
)
)
⋅
x
(
i
)
)
{\theta_{1}}:={\theta_{1}}-a\frac{1}{m}\sum\limits_{i=1}^{m}{\left( \left({{h}_{\theta }}({{x}^{(i)}})-{{y}^{(i)}} \right)\cdot {{x}^{(i)}} \right)}
θ1:=θ1−am1i=1∑m((hθ(x(i))−y(i))⋅x(i))
所以:
data.insert(0,'Ones',1)
data.head()
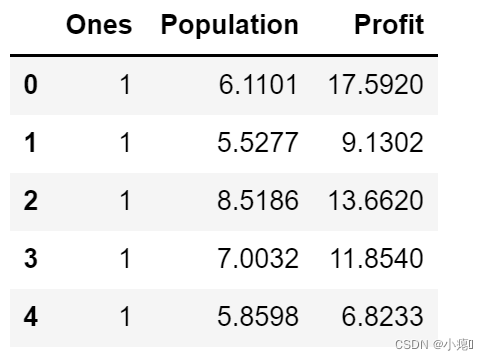
# 建立训练数据集X 和 目标变量y
cols = data.shape[1]
X = data.iloc[:,0:cols-1] # 因为提取是左闭右开原则[0,2)故将ones和人口给X
y = data.iloc[:,cols-1:cols] # 原理同上,必须打上开区间才行,否则维度不正确
这里可以用X.shape 和 y.shape检验一下维度。
这里初始化参数值, θ 0 θ 1 \theta_0 \theta_1 θ0θ1 的初值都是0.
# 初始化数据
theta = np.matrix(np.array([0,0]))
X = np.matrix(X)
y = np.matrix(y)
下面设置梯度下降算法:
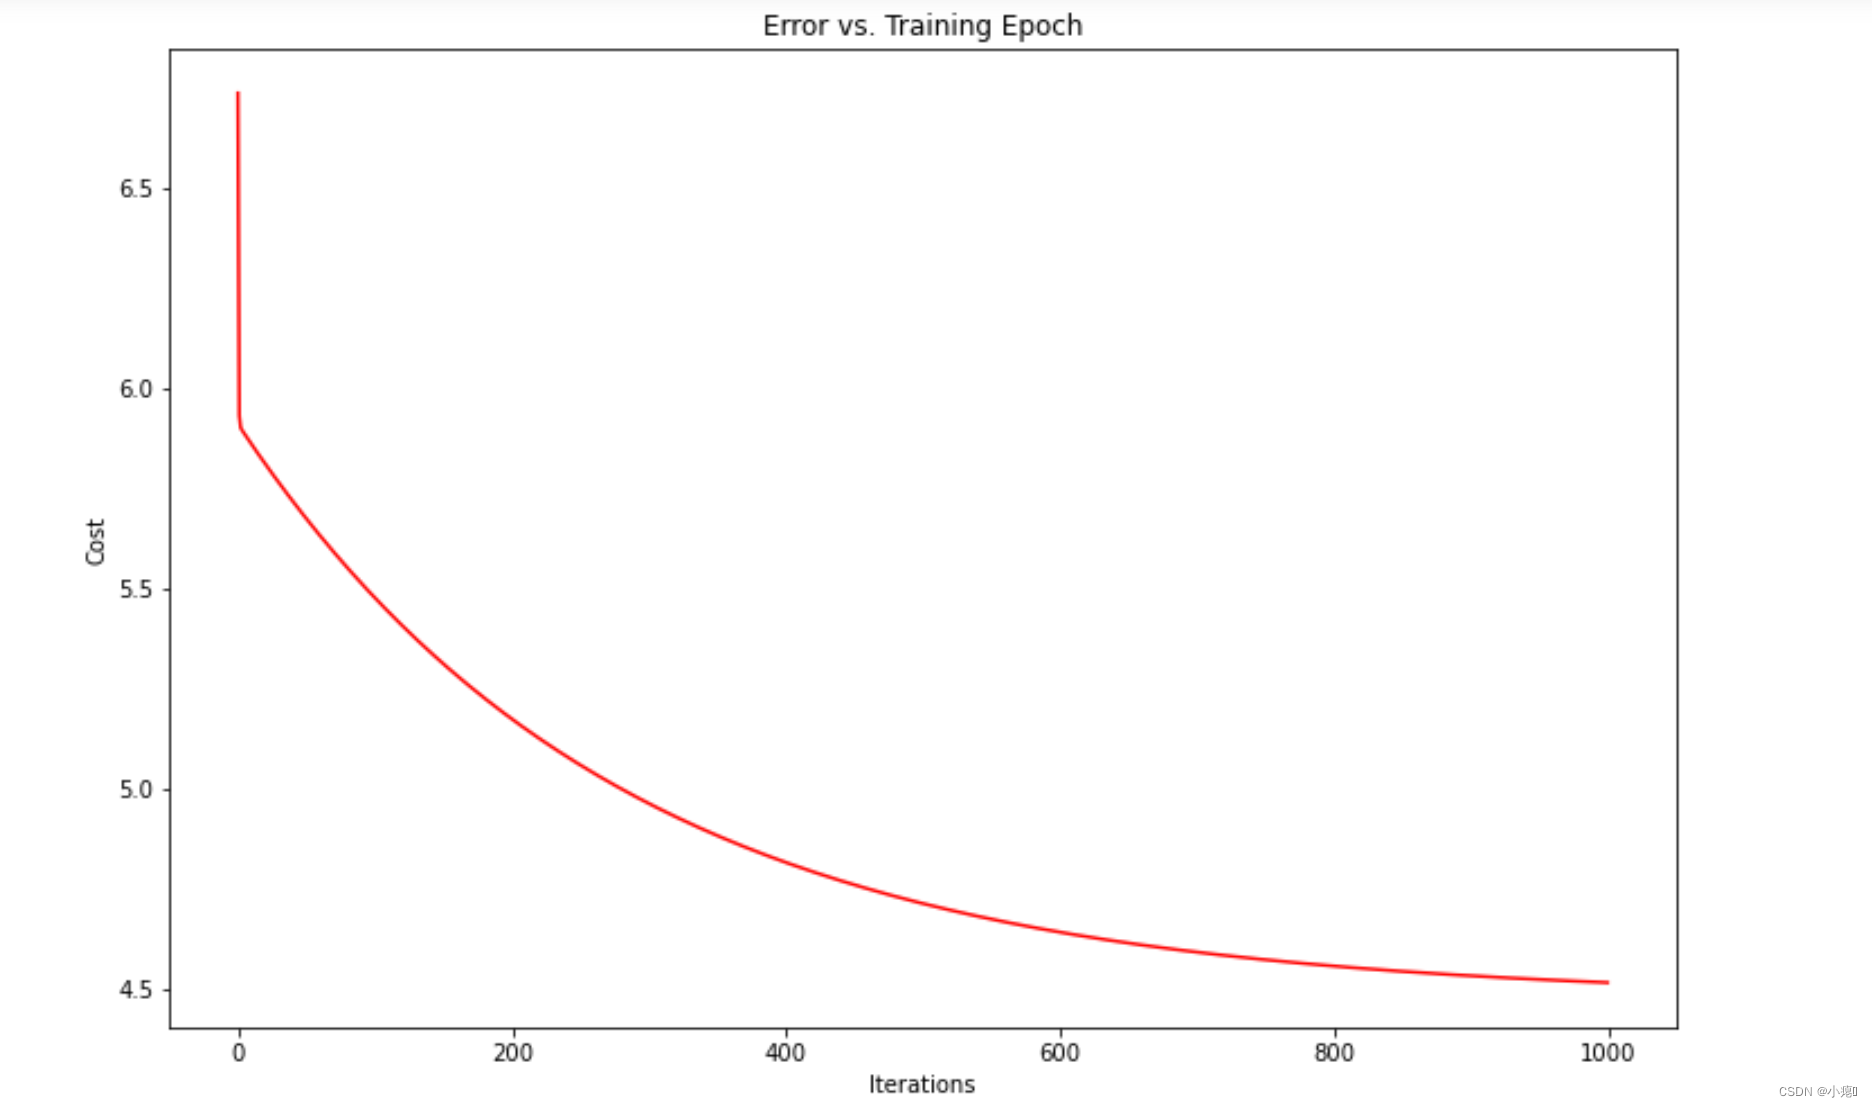
这里的原理就是通过不断的迭代,通过误差来不断修改
θ
\theta
θ参数的值,并且每一次迭代,都要保证代价cost的下降。直到cost最小(收敛)。最后的参数刚好可以使线性函数最好地拟合数据。
# 单变量梯度下降
def gradientDescent(X,y,theta,alpha,iters):
    temp = np.matrix(np.zeros(theta.shape)) # 创建一个和theta相同大小的临时变量矩阵
    parameters = int(theta.ravel().shape[1])
    cost = np.zeros(iters)

    for i in range(iters):
        error = (X * theta.T) - y  # 建模误差
        for j in range(parameters):
            term = np.multiply(error , X[:,j]) # 建模误差与x样本对应相乘
            temp[0,j] = theta[0,j] - ((alpha / len(X)) * np.sum(term))# 矩阵访问下标

        theta = temp
        cost[i] = computeCost(X,y,theta)

    return theta , cost
对应公式:(1)先求偏导数:
∂
∂
θ
j
J
(
θ
0
,
θ
1
)
=
∂
∂
θ
j
1
2
m
∑
i
=
1
m
(
h
θ
(
x
(
i
)
)
−
y
(
i
)
)
2
\frac{\partial }{\partial {{\theta }_{j}}}J({{\theta }_{0}},{{\theta }_{1}})=\frac{\partial }{\partial {{\theta }_{j}}}\frac{1}{2m}{{\sum\limits_{i=1}^{m}{\left( {{h}_{\theta }}({{x}^{(i)}})-{{y}^{(i)}} \right)}}^{2}}
∂θj∂J(θ0,θ1)=∂θj∂2m1i=1∑m(hθ(x(i))−y(i))2
j = 0 j=0 j=0 时: ∂ ∂ θ 0 J ( θ 0 , θ 1 ) = 1 m ∑ i = 1 m ( h θ ( x ( i ) ) − y ( i ) ) \frac{\partial }{\partial {{\theta }_{0}}}J({{\theta }_{0}},{{\theta }_{1}})=\frac{1}{m}{{\sum\limits_{i=1}^{m}{\left( {{h}_{\theta }}({{x}^{(i)}})-{{y}^{(i)}} \right)}}} ∂θ0∂J(θ0,θ1)=m1i=1∑m(hθ(x(i))−y(i))
j
=
1
j=1
j=1 时:
∂
∂
θ
1
J
(
θ
0
,
θ
1
)
=
1
m
∑
i
=
1
m
(
(
h
θ
(
x
(
i
)
)
−
y
(
i
)
)
⋅
x
(
i
)
)
\frac{\partial }{\partial {{\theta }_{1}}}J({{\theta }_{0}},{{\theta }_{1}})=\frac{1}{m}\sum\limits_{i=1}^{m}{\left( \left( {{h}_{\theta }}({{x}^{(i)}})-{{y}^{(i)}} \right)\cdot {{x}^{(i)}} \right)}
∂θ1∂J(θ0,θ1)=m1i=1∑m((hθ(x(i))−y(i))⋅x(i))
(2)接下来对应公式
Repeat {
θ 0 : = θ 0 − a 1 m ∑ i = 1 m ( h θ ( x ( i ) ) − y ( i ) ) {\theta_{0}}:={\theta_{0}}-a\frac{1}{m}\sum\limits_{i=1}^{m}{ \left({{h}_{\theta }}({{x}^{(i)}})-{{y}^{(i)}} \right)} θ0:=θ0−am1i=1∑m(hθ(x(i))−y(i))
θ 1 : = θ 1 − a 1 m ∑ i = 1 m ( ( h θ ( x ( i ) ) − y ( i ) ) ⋅ x ( i ) ) {\theta_{1}}:={\theta_{1}}-a\frac{1}{m}\sum\limits_{i=1}^{m}{\left( \left({{h}_{\theta }}({{x}^{(i)}})-{{y}^{(i)}} \right)\cdot {{x}^{(i)}} \right)} θ1:=θ1−am1i=1∑m((hθ(x(i))−y(i))⋅x(i))
}
error 对应:
h
θ
(
x
(
i
)
)
−
y
(
i
)
=
θ
0
+
θ
1
x
−
y
(
i
)
h_\theta(x^{(i)}) - y^{(i)} = \theta_0 + \theta_1x - y^{(i)}
hθ(x(i))−y(i)=θ0+θ1x−y(i)
term对应:
θ
:
=
θ
−
a
1
m
∑
i
=
1
m
(
(
e
r
r
o
r
)
⋅
x
(
i
)
)
{\theta}:={\theta}-a\frac{1}{m}\sum\limits_{i=1}^{m}{\left( \left(\mathrm{error} \right)\cdot {{x}^{(i)}} \right)}
θ:=θ−am1i=1∑m((error)⋅x(i))
temp[0,j]应该对应上面公式很容易看出。这是一个更新临时变量的过程,这可以保证参数同时更新。
这里注意temp的类型是matrix类型,[0,j]表示访问矩阵的第0行第j列元素。
将代价存放在数组里方便后续运算和画图。
# 初始化参数
alpha = 0.01
iters = 1000
绘制图片:
x = np.linspace(data.Population.min(), data.Population.max(), 100)
f = g[0, 0] + (g[0, 1] * x) # 假设函数

fig, ax = plt.subplots(figsize=(12,8)) # 建立一个图
ax.plot(x, f, 'r', label='Prediction')
ax.scatter(data.Population, data.Profit, marker = 'x', label='Traning Data')
ax.legend(loc=2)
ax.set_xlabel('Population')
ax.set_ylabel('Profit')
ax.set_title('Predicted Profit vs. Population Size')
plt.show()
绘制cost图像观察收敛情况。
fig, ax = plt.subplots(figsize=(12,8))
ax.plot(np.arange(iters), cost, 'r')
ax.set_xlabel('Iterations')
ax.set_ylabel('Cost')
ax.set_title('Error vs. Training Epoch')
plt.show()
参考链接:
https://blog.csdn.net/weixin_40212554/article/details/89437146
https://www.zhihu.com/people/fengdu78
Linear Regression with Multivariable
"""
在这一部分中,您将使用多个变量实现线性回归,以预测房价。
假设你正在卖房子,你想知道好的市场价格是多少。
这样做的一个方法是首先收集近期售出房屋的信息,并制作房价模型。
ex1data2.txt文件包含俄勒冈州波特兰市房价的训练集。
第一列是房子的大小(平方英尺),第二列是卧室的数量,第三列是房子价格。
"""
data2 = pd.read_csv('ex1data2.txt',names = ['Size','Bedrooms','Price']) # names参数传递列表,将名字命名在对应列上
data2.head()  # 是指取数据的前n行数据,默认是前5行。
要进行数据预处理,这是实验要求:

# 因为样本数据范围大且分布不一致,所以使用特征归一化。
# 这部分是实验要求的:

#通过查看这些值,请注意房屋大小大约是卧室数量的1000倍。
#当特征相差几个数量级时,首先执行特征缩放可以使梯度下降收敛得更快
data2 = (data2 - data2.mean()) / data2.std()
data2.head()
# add ones column
data2.insert(0, 'Ones', 1)

# set X (training data) and y (target variable)
cols = data2.shape[1]
X2 = data2.iloc[:,0:cols-1]
y2 = data2.iloc[:,cols-1:cols]

# convert to matrices and initialize theta
X2 = np.matrix(X2.values)
y2 = np.matrix(y2.values)
theta2 = np.matrix(np.array([0,0,0]))

# perform linear regression on the data set
g2, cost2 = gradientDescent(X2, y2, theta2, alpha, iters)

# get the cost (error) of the model
computeCost(X2, y2, g2)

fig, ax = plt.subplots(figsize=(12,8))
ax.plot(np.arange(iters), cost2, 'r')
ax.set_xlabel('Iterations')
ax.set_ylabel('Cost')
ax.set_title('Error vs. Training Epoch')
plt.show()


 6952
6952


 被折叠的 条评论
为什么被折叠?


