


心累。。。
如果条件允许,还是强烈建议 用 Echarts+html 来实现(表格部分由 html 来弄)。
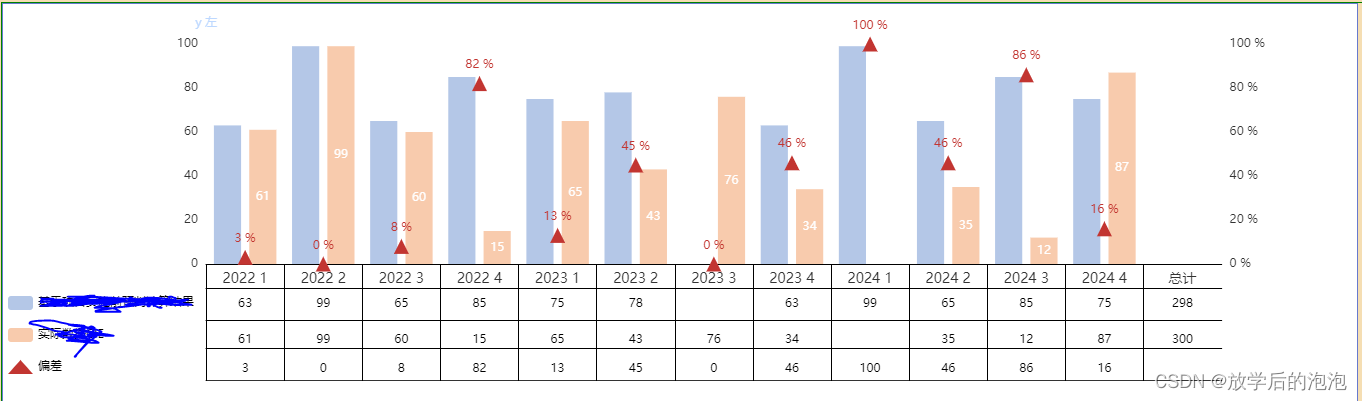
这里是调研阶段,想看看 ECharts 原生能做到什么程度。
先贴上样图:
贴上完整代码:
<!DOCTYPE html>
<html lang="en">

<head>
  <meta charset="UTF-8">
  <link rel="icon" href="/favicon.ico">
  <meta name="viewport" content="width=device-width, initial-scale=1.0">
  <title>Vite App</title>
  <script crossorigin src="tool/jquery-1.9.1.min.js"></script>
  <script crossorigin src="tool/echarts-all4.js"></script>
  <!-- <script crossorigin src="assets/ChartCompoment.js"></script> -->
  <!--    <link rel="stylesheet" href="/assets/index-42ba4135.css">-->
</head>
<style>
  .charts {
    width: 100%;
    display: grid;
    grid-template-columns: repeat(1, minmax(0, 1fr));
    gap: 10px;

    border: 1px green solid;


  }

  .chart {
    width: 90%;
    height: 400px;
    background-color: rgb(255, 255, 255);
    /* border-radius: 10px; */
    /* box-sizing: border-box; */
    /* overflow: hidden; */
    /* border-radius: 16.503px; */
    /* background: linear-gradient(180deg, rgba(128, 251, 222, 0.17) -76.58%, rgba(249, 242, 213, 0.13) 122.06%);
    backdrop-filter: blur(14.250161170959473px); */

    border: 1px rgb(103, 122, 207) solid;
    margin: 0px;
  }
</style>

<body style="background-color: wheat;">


  <div id="demo_report_title">hello world,Rain!</div>


  <div class="charts">
    <div id="chart" class="chart" />
  </div>


  <script type="text/javascript">


    var chartDom = document.getElementById('chart');
    var myChart = echarts.init(chartDom);
    var option = getOption();

    option && myChart.setOption(option);


    function getOption() {

      let blue = [63, 99, 65, 85, 75, 78, '', 63, 99, 65, 85, 75];

      let row2 = blue.concat([298]);
      // 计算统计值
      // r1.push(arraySum(r1));

      let orange = [61, 99, 60, 15, 65, 43, 76, 34, '', 35, 12, 87];

      let row3 = orange.concat([300]);

      // r2.push(arraySum(r2));


      let red = [];
      for (let i = 0; i < blue.length; i++) {
        let r1_e1 = blue[i];
        let r2_e2 = orange[i];
        // if(r1_e1&&r2_e2){
        r2_e2 = r2_e2 ? r2_e2 : 0;
        r1_e1 = r1_e1 ? r1_e1 : 0;

        let cha = 0;
        if (r1_e1) {
          cha = (r2_e2 - r1_e1) / r1_e1;
        }
        if (cha) {

          // 截取两位小数
          cha = cha.toFixed(2);
        }

        // 取绝对值
        cha = Math.abs(cha);

        // 换算为 百分数

        cha = cha * 100;

        red.push(cha)

        // }
      }

      let row4 = red.concat(['']);

      let option = {

        grid: [
          {

          left: "15%",

          top: "10%",

          // right: "0%",

          bottom: "35%",

        },

        //第2个坐标系
        {
          left:'15%',
          top:'10%',
          bottom: "29%",
        },
        //第3个坐标系
        {
          left:'15%',
          top:'10%',
          bottom: "21%",
        },
        //第4个坐标系
        {
          left:'15%',
          top:'10%',
          bottom: "14%",
        },
        //第5个坐标系
        {
          left:'15%',
          top:'10%',
          bottom: "6%",
        }
      ],

        legend: {

          align: "left",

          itemGap: 18,

          orient: "vertical",

          textStyle: { color: "#000" },

          bottom: 25,

          left: 0,

          // data: [ "问题总计", "已整改","整改中", "已整改占比",],

          data: [
            {
              name: '基于项目实施前预判计算结果',
              // icon: 'none',
            },
            {
              name: '实际数据CIE',
              // icon: 'none'
            },
            {
              name: '偏差',
              icon: 'triangle',
            },
          ],

        },

        xAxis: [

          // 第一行 x 轴
          {

            data: [
              "2022 1",

              "2022 2",

              "2022 3",

              "2022 4",

              "2023 1",

              "2023 2",

              "2023 3",

              "2023 4",

              "2024 1",

              "2024 2",

              "2024 3",

              "2024 4",

              "总计",

            ],

            axisLine: {

              show: true, // X 轴轴线

              lineStyle: {

                color: "#000000",

                // width: 0,

              },

            },

            axisTick: {

              show: true, //隐藏X轴刻度

              // alignWithLabel: true, //类目轴中在 boundaryGap 为 true 的时候有效,可以保证刻度线和标签对齐

              length:117,

            },

            axisLabel: {

              show: true,

              textStyle: {

                color: "#333333", //X轴文字颜色

                fontSize: 14,

              },

              interval: 0,
              overflow: 'truncate',


            },

          },

          // 第二行 x 轴
          {

            position: 'bottom',

            offset: 30,
            gridIndex:1,

            axisPointer: {

              type: 'none',

            },

            axisLine: {

              show: true, //隐藏X轴轴线

              lineStyle: {

                color: "#000",

                // width: 0,

              },

            },

            axisLabel: {

              inside: true,

              textStyle: {

                fontSize: '12',

                color: '#000000'

              },

              interval: 0,

            },

            data: row2,


          },

          // 第三行 x 轴
          {

            position: 'bottom',

            offset: 34,

            gridIndex:2,

            axisPointer: {

              type: 'none',

            },

            axisLine: {

              show: true, //隐藏X轴轴线

              lineStyle: {

                color: "#000",

                // width: 0,

              },

            },

            axisLabel: {

              inside: true,

              textStyle: {

                fontSize: '12',

                color: '#000000'

              },

              interval: 0,

            },

            data: row3,

          },

          // 第四行 x 轴
          {

            position: 'bottom',

            offset: 35,

            gridIndex:3,

            axisPointer: {

              type: 'none',

            },

            axisLine: {

              show: true, //隐藏X轴轴线

              lineStyle: {

                color: "#000",

                // width: 0,

              },

            },

            axisLabel: {

              inside: true,

              textStyle: {

                fontSize: '12',

                color: '#000000'

              },

              interval: 0,

            },

            data: row4,

          },

          {
            gridIndex:4,
            offset: 20,
          }
        ],

        yAxis: [

          {

            type: "value",

            name: "y 左",

            nameTextStyle: {

              color: "#BDD8ff",

              fontSize: 12,

            },
            axisLine: {
              show: false,
            }
            ,
            splitLine: {

              show: false,

              lineStyle: {

                // color: "rgba(255, 255, 255, 0.15)",

                type: 'dotted', // dotted 虚线

              },

            },

            axisTick: {

              show: false,

            },

            axisLabel: {

              show: true,

              textStyle: {

                color: "#333333",

                fontSize: 12,

              },

            },

          },

          {

            type: "value",
            position: 'right',

            // name: "y 右",

            // offset: -40,
            nameTextStyle: { //坐标轴名称的文字样式

              color: "#7AB900",

              fontSize: 12,

            },

            splitLine: { //坐标轴在 grid 区域中的分隔线

              show: false,

              lineStyle: {

                width: 1,

                color: "#CED2DB",

              },

            },
            axisLabel: { //坐标轴刻度标签的相关设置

              show: true,

              textStyle: {

                color: "#333333",

                fontSize: 12,

              },
              // 使用字符串模板,模板变量为刻度默认标签 {value}
              formatter: '{value} %',
              // 使用函数模板,函数参数分别为刻度数值(类目),刻度的索引
              // formatter: function (value, index) {
              //   return value + 'kg';
              // }

            },
            axisTick: { //坐标轴刻度相关设置
              show: false,
            },
            axisLine: {
              show: false, //坐标轴轴线相关设置
            },


          },

          {
            gridIndex:1,
            axisLine: {
              show: false, //坐标轴轴线相关设置
            },

          },
          {
            gridIndex:2,
            axisLine: {
              show: false, //坐标轴轴线相关设置
            },

          },
          {
            gridIndex:3,
            axisLine: {
              show: false, //坐标轴轴线相关设置
            },

          },
          {
            gridIndex:4,
            axisLine: {
              show: false, //坐标轴轴线相关设置
            },

          },
        ],

        series: [


          {

            name: "基于项目实施前预判计算结果",

            type: "bar",

            // barWidth: 22,

            itemStyle: {

              color: '#B4C7E7'

            },

            label: {

              show: false,

              position: "top",

              distance: 0,

              color: "#333333",

              // formatter: "{c}" + "%",

            },
            // 与 第二个 x 轴的 data 对应
            data: blue,

          },

          {

            name: "实际数据CIE",

            type: "bar",

            // yAxisIndex: 1,
            label: {

              show: true,

              // position: "top",

              // distance: 0,

              // color: "#333333",

              // formatter: "{c}" + "%",

            },

            itemStyle: {

              color: "#F8CBAD"

            },

            data: orange,

          },

          {

            name: "偏差",

            type: "line",

            lineStyle: {

              color: "rgb(255, 0, 0)",

              width: 0,//线宽为0,就不会显示了

            },

            label: {
              show: true,
              formatter:'{c} %',
            },

            yAxisIndex: 1,

            // showSymbol: false,

            symbolSize: 15,

            symbol: 'triangle',

            data: red,

          },

          ,

          // 背景色
          // {

          //   // name: '背景',

          //   type: "bar",

          //   barWidth: 24,

          //   xAxisIndex: 0,

          //   yAxisIndex: 1,

          //   barGap: "-110%",

          //   data: [100, 100, 100, 100, 100, 100, 100, 100, 100, 100, 100, 100, 100], //背景阴影长度

          //   itemStyle: {

          //     normal: {

          //       color: "rgba(214, 233, 252,0.5)",

          //     },

          //   },

          //   tooltip: {

          //     show: false,

          //   },

          //   zlevel: 9,

          // },

        ],

      };

      return option;
      // ————————————————

      //             版权声明:本文为博主原创文章,遵循 CC 4.0 BY-SA 版权协议,转载请附上原文出处链接和本声明。

      // 原文链接:https://blog.csdn.net/m0_50478723/article/details/132599130
    }


    // 获取整个 URL
    // var url = window.location.href;

    // // 获取 URL 中的参数部分
    // var params = window.location.search;

    // // 示例用法
    // var sceneId = getParamValue('sceneId');


    function arraySum(arr) {
      let sum = 0;
      for (let i = 0; i < arr.length; i++) {
        sum += (arr[i] == '' ? 0 : arr[i]);
      }
      return sum;
    }

    /**
      * 获取指定参数的值
      **/
    function getParamValue(param) {
      var query = window.location.search.substr(1);
      var paramArr = query.split('&');
      for (var i = 0; i < paramArr.length; i++) {
        var pair = paramArr[i].split('=');
        if (pair[0] === param) {
          return decodeURIComponent(pair[1]);
        }
      }
      return null;
    }

  </script>

</body>

</html>


 1849
1849


 被折叠的 条评论
为什么被折叠?
被折叠的 条评论
为什么被折叠?
 到【灌水乐园】发言


