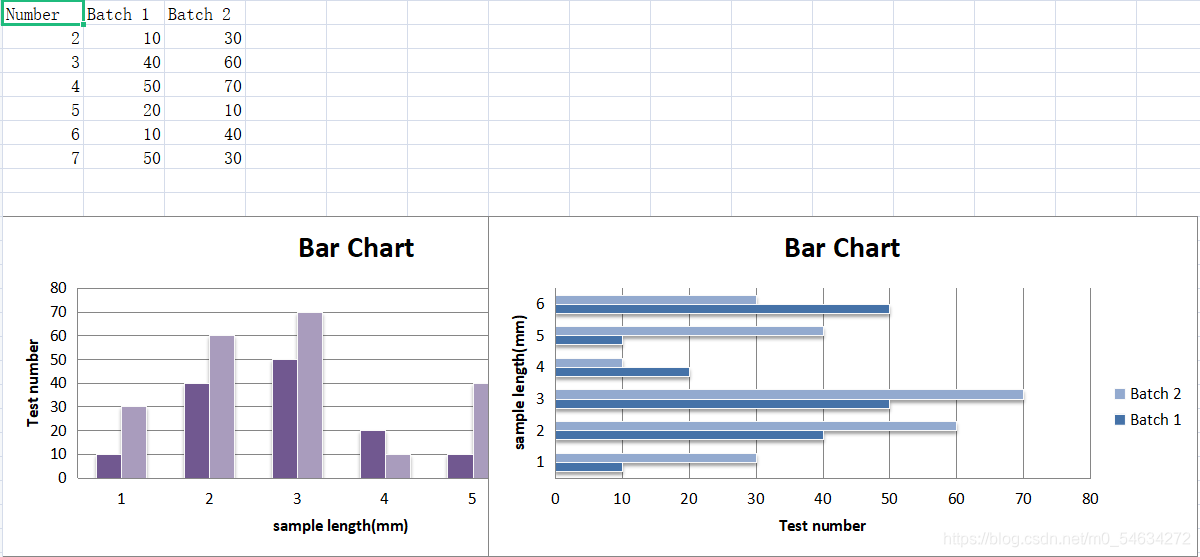
绘制条形图及柱状图
from openpyxl import Workbook
wb = Workbook()
ws = wb.create_sheet()
rows = [
('Number', 'Batch 1', 'Batch 2'),
(2, 10, 30),
(3, 40, 60),
(4, 50, 70),
(5, 20, 10),
(6, 10, 40),
(7, 50, 30),
]
for row in rows:
ws.append(row)
from openpyxl.chart import BarChart, Series, Reference
chart1 = BarChart()
chart1.type = 'col'
chart1.style = 14
chart1.title = 'Bar Chart'
chart1.y_axis.title = 'Test number'
chart1.x_axis.title = 'sample length(mm)'
data = Reference(ws,min_col=2,max_col=3,min_row=1,max_row=7)
cats = Reference(ws,min_col=1,min_row=2,max_row=7)
chart1.add_data(data,titles_from_data=True)
chart1.shape = 3
ws.add_chart(chart1,'A10')
from copy import deepcopy
chart2 = deepcopy(chart1)
chart2.style = 11
chart2.type = 'bar'
ws.add_chart(chart2,'G10')
wb.save('bar.xlsx')
- 效果图

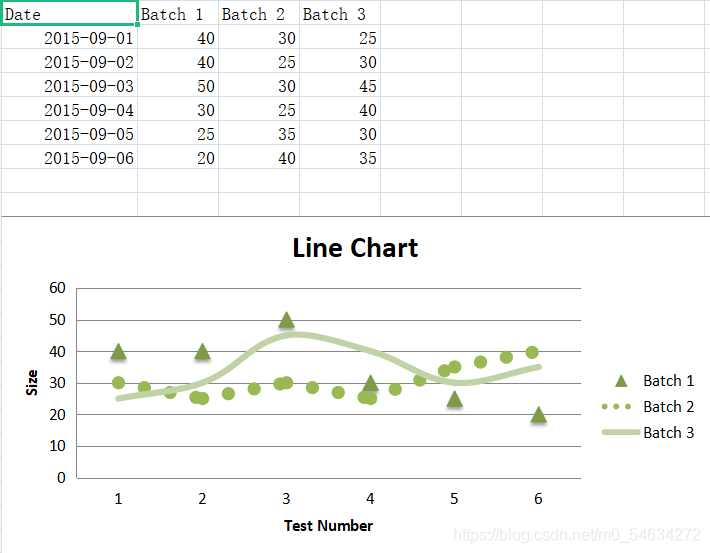
绘制折线图
from openpyxl import Workbook
from datetime import date
wb = Workbook()
ws = wb.active
rows = [
['Date', 'Batch 1', 'Batch 2', 'Batch 3'],
[date(2015,9, 1), 40, 30, 25],
[date(2015,9, 2), 40, 25, 30],
[date(2015,9, 3), 50, 30, 45],
[date(2015,9, 4), 30, 25, 40],
[date(2015,9, 5), 25, 35, 30],
[date(2015,9, 6), 20, 40, 35],
]
for row in rows:
ws.append(row)
from openpyxl.chart import LineChart,Reference
chart1 = LineChart()
chart1.title = 'Line Chart'
chart1.y_axis.title = 'Size'
chart1.x_axis.title = 'Test Number'
chart1.style = 13
data = Reference(ws,min_row=1,max_row=7,min_col=2,max_col=4)
chart1.add_data(data,titles_from_data=True)
s1 = chart1.series[0]
s1.marker.symbol = 'triangle'
s1.marker.graphicalProperties.line.SolidFill = 'FF0000'
s1.marker.graphicalProperties.line.SolidFill = 'FF0000'
s1.graphicalProperties.line.noFill = True
s2 = chart1.series[1]
s2.graphicalProperties.line.SolidFill = '00AAAA'
s2.graphicalProperties.line.dashStyle = 'sysDot'
s2.graphicalProperties.line.width = 100050
s3 = chart1.series[2]
s3.smooth = True
ws.add_chart(chart1,'A10')
wb.save('line.xlsx')
- 效果图

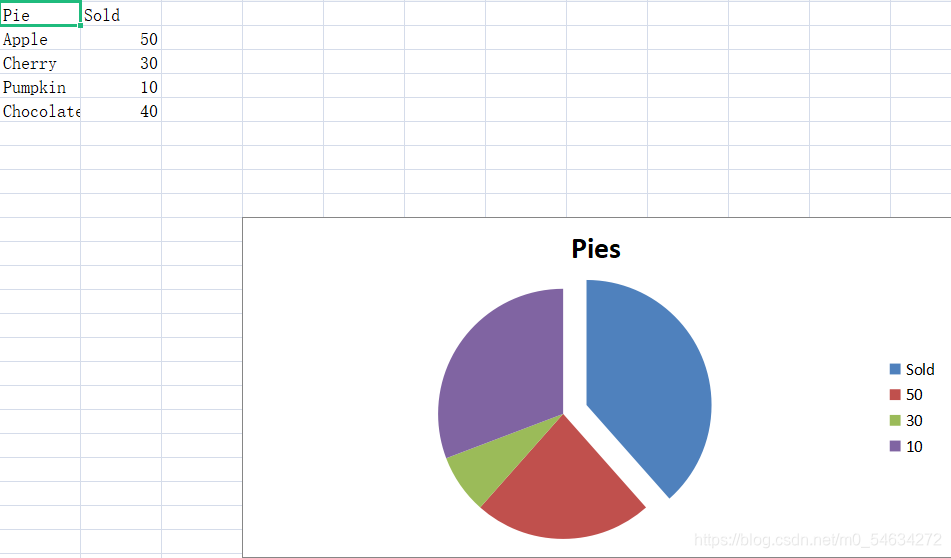
绘制扇形图
from openpyxl import Workbook
wb = Workbook()
ws = wb.active
date =[
['Pie', 'Sold'],
['Apple', 50],
['Cherry', 30],
['Pumpkin', 10],
['Chocolate', 40],
]
for row in date:
ws.append(row)
from openpyxl.chart import PieChart,Reference
pie = PieChart()
lablels = Reference(ws,min_col=2,min_row=1,max_row=5)
data = Reference(ws,min_col=2,min_row=1,max_row=5)
pie.add_data(data,titles_from_data=True)
pie.set_categories(lablels)
pie.title = 'Pies'
from openpyxl.chart.series import DataPoint
slice = DataPoint(idx=0,explosion=20)
pie.series[0].data_points = [slice]
ws.add_chart(pie,'D10')
wb.save('pie.xlsx')
- 效果图


 本文通过实例展示了如何使用openpyxl库在Excel中创建和定制条形图、折线图和扇形图,包括设置图表类型、样式、坐标轴标题和数据呈现方式,适合初学者了解Excel数据可视化。


 326
326

 被折叠的 条评论
为什么被折叠?


