


Plotly+Dash
使用命令行pip直接安装dash
pip install dash
安装包括三部分:
html、dcc、dashtable、plotly。
如果想要兼容Jupiter相关环境,使用:
conda install -c conda-forge -c plotly jupyter-dash
三个私人的开源项目,用于辅助:
xinetzone/dash-xinet:简化 Dash 的使用。

SanstyleLab/plotly-dastsets:存储一些数据集以及展示图片。

xinetzone/sanstyle:处理一些常见任务。
pip install dash-xinet sanstyle
from dash_xinet.server import create_app, run_server
from dash_xinet.utils.nav import create_nav

external_stylesheets = ['https://codepen.io/chriddyp/pen/bWLwgP.css']
app = create_app(__name__, external_stylesheets=external_stylesheets)
Dash 应用使用和运行:
layout = ... # 布局
await run_server(app, layout, port=8050) # 启动应用
关于 sanstyle
可以直接批量修改文件后缀:
rename_suffix(root, old, new)
root
需要修改的跟目录
old
被修改的文件后缀,如 .txt
new
修改后的文件后缀,如 .rst
创建 元素
from sanstyle.display.html import Embed

snippet_url = 'https://dash-tests.herokuapp.com'
figure_n_slider_dash = Embed(snippet_url + '/examples/figure-n-slider',
                   className='w3-pale-blue',
                   height=500)
figure_n_slider_dash
导入 plotly-dastsets
import pandas as pd
from sanstyle.github.file import lfs_url

url = lfs_url('SanstyleLab/plotly-dastsets',
              'simple/usa-agricultural-exports-2011.csv')
df = pd.read_csv(url)
df.head()
再看plotly。
Plotly是一个交互式绘图库,提供了JavaScript、Python和R三种接口。我们使用的是python。
Plotly有三种不同的Python API,可以选择用不同的方法来绘图:
面向对象的API,通过plotly.graph_objects模块的图表对象进行绘制
数据驱动的API,通过构造类似JSON的数据结构进行绘制
高级绘图接口,是对底层绘图方法的包装,即plotly.express模块
面向对象API
使用graph_objects模块进行绘图时,用户需要定义画布对象go.Figure()、样式对象go.Layout()、迹线对象如散点图go.Scatter()、柱状图go.Bar()等,组合后进行渲染。
数据驱动API
Plotly的可视化建立在JSON数据结构之上,trace是一个字典,包含了要绘制的数据和颜色、线性等绘图指令,用于指定一组数据如何呈现;用列表组织多个trace构成了data,即在一张图表中要展示的所有trace;layout也是一个字典,用于设置图表的布局,包括标题、字体等属性,将data和layout组合在一起就构成了一张图表。这种方法直接对应于Plotly的JavaScript实现中的JSON API。
$ conda create -n plotly python=3.7  # 建立名为plotly的虚拟环境
$ conda activate plotly  # 激活虚拟环境
$ pip install plotly          # 不指定版本号
$ pip install plotly==4.14.3  # 指定版本号
$ conda install -c plotly=4.14.3
$ conda install -c plotly plotly-orca==1.2.1 psutil requests
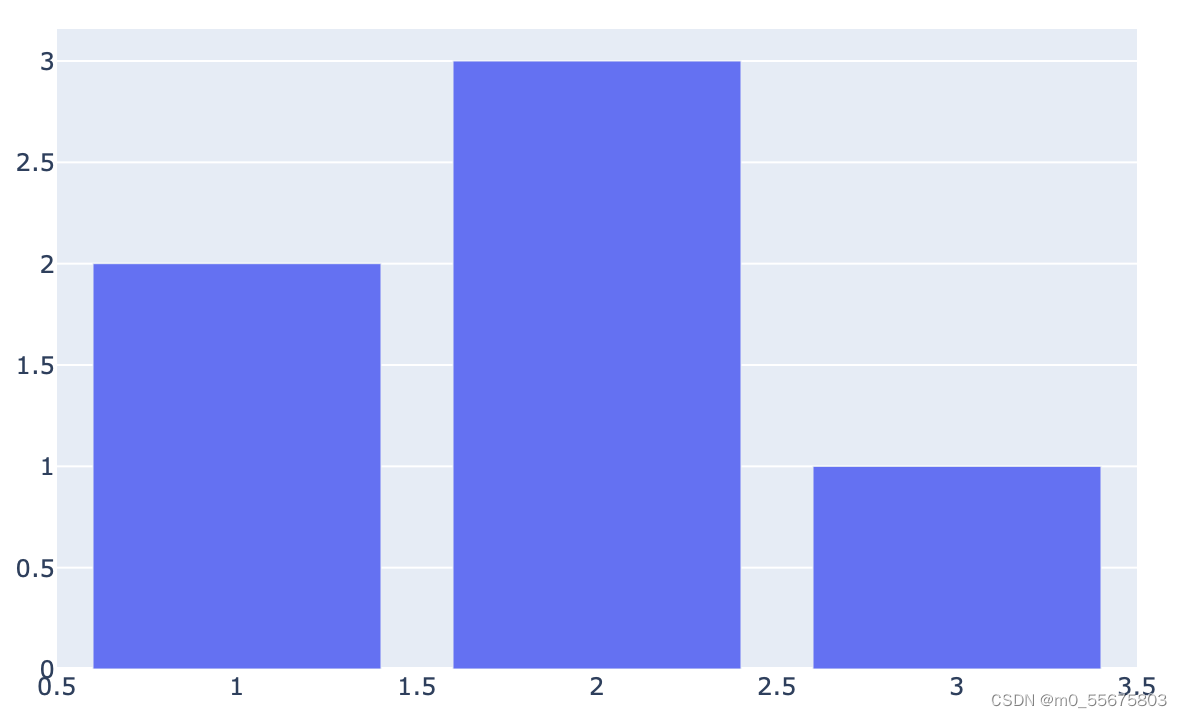
import plotly.graph_objects as go
fig = go.Figure(data=go.Bar(x=[1, 2, 3], y=[2, 3, 1]))
fig.show()
我们来看具体的绘图步骤。
导入
import warnings
import pandas as pd
import plotly.express as px
import plotly.graph_objs as go

warnings.filterwarnings('ignore')
# china_history
#   国内累计确诊折线图
def china_confirm(df):
    df0 = df[['date', 'confirm']].reset_index()
    df0['date'] = df0['date'].dt.date
    df0 = df0.sort_values('date', ascending=False)
    fig = px.line(
        data_frame=df0,
        x='date',
        y='confirm',
        title='国内确诊折线图',
        height=900
    )
    fig.update_layout({
        # 'xaxis_dtick': 1,
        'xaxis_title': '日期',
        'yaxis_title': '数量',
    })
    return fig
#   国内新增确诊折线图
def china_confirm_add(df):
    df0 = df[['date', 'confirm_add']].reset_index()
    df0['date'] = df0['date'].dt.date
    df0 = df0.sort_values('date', ascending=False)
    fig = px.line(
        data_frame=df0,
        x='date',
        y='confirm_add',
        title='国内新增确诊折线图',
        height=900
    )
    fig.update_layout({
        # 'xaxis_dtick': 1,
        'xaxis_title': '日期',
        'yaxis_title': '数量',
    })
    return fig
#   国内累计治愈折线图
def china_heal(df):
    df0 = df[['date', 'heal']].reset_index()
    df0['date'] = df0['date'].dt.date
    df0 = df0.sort_values('date', ascending=False)
    fig = px.line(
        data_frame=df0,
        x='date',
        y='heal',
        title='国内累计治愈折线图',
        height=900
    )
    fig.update_layout({
        # 'xaxis_dtick': 1,
        'xaxis_title': '日期',
        'yaxis_title': '数量',
    })
    return fig
#   国内新增治愈折线图
def china_heal_add(df):
    df0 = df[['date', 'heal_add']].reset_index()
    df0['date'] = df0['date'].dt.date
    df0 = df0.sort_values('date', ascending=False)
    fig = px.line(
        data_frame=df0,
        x='date',
        y='heal_add',
        title='国内新增治愈折线图',
        height=900
    )
    fig.update_layout({
        # 'xaxis_dtick': 1,
        'xaxis_title': '日期',
        'yaxis_title': '数量',
    })
    return fig
#   国内累计死亡折线图
def china_dead(df):
    df0 = df[['date', 'dead']].reset_index()
    df0['date'] = df0['date'].dt.date
    df0 = df0.sort_values('date', ascending=False)
    fig = px.line(
        data_frame=df0,
        x='date',
        y='dead',
        title='国内累计死亡折线图',
        height=900
    )
    fig.update_layout({
        # 'xaxis_dtick': 1,
        'xaxis_title': '日期',
        'yaxis_title': '数量',
    })
    return fig
#   国内新增死亡折线图
def china_dead_add(df):
    df0 = df[['date', 'dead_add']].reset_index()
    df0['date'] = df0['date'].dt.date
    df0 = df0.sort_values('date', ascending=False)
    fig = px.line(
        data_frame=df0,
        x='date',
        y='dead_add',
        title='国内新增死亡折线图',
        height=900
    )
    fig.update_layout({
        # 'xaxis_dtick': 1,
        'xaxis_title': '日期',
        'yaxis_title': '数量',
    })
    return fig
#  国内累计疑似折线图
def china_suspect(df):
    df0 = df[['date', 'suspect']].reset_index()
    df0['date'] = df0['date'].dt.date
    df0 = df0.sort_values('date', ascending=False)
    fig = px.line(
        data_frame=df0,
        x='date',
        y='suspect',
        title='国内累计疑似折线图',
        height=900
    )
    fig.update_layout({
        # 'xaxis_dtick': 1,
        'xaxis_title': '日期',
        'yaxis_title': '数量',
    })
    return fig
#   国内新增疑似折线图
def china_suspect_add(df):
    df0 = df[['date', 'suspect_add']].reset_index()
    df0['date'] = df0['date'].dt.date
    df0 = df0.sort_values('date', ascending=False)
    fig = px.line(
        data_frame=df0,
        x='date',
        y='suspect_add',
        title='国内新增疑似折线图',
        height=900
    )
    fig.update_layout({
        # 'xaxis_dtick': 1,
        'xaxis_title': '日期',
        'yaxis_title': '数量',
    })
    return fig
# owid-covid-data

# 各国 总病例折线图
def country_total_cases(df, country_name):
    df0 = df[['date', 'total_cases']].reset_index()
    df0['date'] = df0['date'].dt.date
    df0 = df0.sort_values('date', ascending=False)
    fig = px.line(
        data_frame=df0,
        x='date',
        y='total_cases',
        title=country_name + '总病例折线图',
        height=900
    )
    fig.update_layout({
        # 'xaxis_dtick': 1,
        'xaxis_title': '日期',
        'yaxis_title': '数量',
    })
    return fig
# 各国    新病例折线图
def country_new_cases(df, country_name):
    df0 = df[['date', 'new_cases']].reset_index()
    df0['date'] = df0['date'].dt.date
    df0 = df0.sort_values('date', ascending=False)
    fig = px.line(
        data_frame=df0,
        x='date',
        y='new_cases',
        title=country_name + '新增病例折线图',
        height=900
    )
    fig.update_layout({
        # 'xaxis_dtick': 1,
        'xaxis_title': '日期',
        'yaxis_title': '数量',
    })
    return fig
# 各国 总死亡折线图
def country_total_deaths(df, country_name):
    df0 = df[['date', 'total_deaths']].reset_index()
    df0['date'] = df0['date'].dt.date
    df0 = df0.sort_values('date', ascending=False)
    fig = px.line(
        data_frame=df0,
        x='date',
        y='total_deaths',
        title=country_name + '总死亡折线图',
        height=900
    )
    fig.update_layout({
        # 'xaxis_dtick': 1,
        'xaxis_title': '日期',
        'yaxis_title': '数量',
    })
    return fig
# 各国    新增死亡折线图
def country_new_deaths(df, country_name):
    df0 = df[['date', 'new_deaths']].reset_index()
    df0['date'] = df0['date'].dt.date
    df0 = df0.sort_values('date', ascending=False)
    fig = px.line(
        data_frame=df0,
        x='date',
        y='new_deaths',
        title=country_name + '新增死亡折线图',
        height=900
    )
    fig.update_layout({
        # 'xaxis_dtick': 1,
        'xaxis_title': '日期',
        'yaxis_title': '数量',
    })
    return fig
# 各国    单位病例折线图
def country_total_cases_per_million(df, country_name):
    df0 = df[['date', 'total_cases_per_million']].reset_index()
    df0['date'] = df0['date'].dt.date
    df0 = df0.sort_values('date', ascending=False)
    fig = px.line(
        data_frame=df0,
        x='date',
        y='total_cases_per_million',
        title=country_name + '单位病例折线图',
        height=900
    )
    fig.update_layout({
        # 'xaxis_dtick': 1,
        'xaxis_title': '日期',
        'yaxis_title': '数量',
    })
    return fig
# 各国    单位新增病例折线图
def country_new_cases_per_million(df, country_name):
    df0 = df[['date', 'new_cases_per_million']].reset_index()
    df0['date'] = df0['date'].dt.date
    df0 = df0.sort_values('date', ascending=False)
    fig = px.line(
        data_frame=df0,
        x='date',
        y='new_cases_per_million',
        title=country_name + '单位新增病例折线图',
        height=900
    )
    fig.update_layout({
        # 'xaxis_dtick': 1,
        'xaxis_title': '日期',
        'yaxis_title': '数量',
    })
    return fig
# 各国    单位总死亡折线图
def country_total_deaths_per_million(df, country_name):
    df0 = df[['date', 'total_deaths_per_million']].reset_index()
    df0['date'] = df0['date'].dt.date
    df0 = df0.sort_values('date', ascending=False)
    fig = px.line(
        data_frame=df0,
        x='date',
        y='total_deaths_per_million',
        title=country_name + '单位总死亡折线图',
        height=900
    )
    fig.update_layout({
        # 'xaxis_dtick': 1,
        'xaxis_title': '日期',
        'yaxis_title': '数量',
    })
    return fig
# 各国    单位新增死亡折线图
def country_new_deaths_per_million(df, country_name):
    df0 = df[['date', 'new_deaths_per_million']].reset_index()
    df0['date'] = df0['date'].dt.date
    df0 = df0.sort_values('date', ascending=False)
    fig = px.line(
        data_frame=df0,
        x='date',
        y='new_deaths_per_million',
        title=country_name + '单位新增死亡折线图',
        height=900
    )
    fig.update_layout({
        # 'xaxis_dtick': 1,
        'xaxis_title': '日期',
        'yaxis_title': '数量',
    })
    return fig
# 各国    病毒扩散速率折线图
def country_reproduction_rate(df, country_name):
    df0 = df[['date', 'reproduction_rate']].reset_index()
    df0['date'] = df0['date'].dt.date
    df0 = df0.sort_values('date', ascending=False)
    fig = px.line(
        data_frame=df0,
        x='date',
        y='reproduction_rate',
        title=country_name + '病毒扩散速率折线图',
        height=900
    )
    fig.update_layout({
        # 'xaxis_dtick': 1,
        'xaxis_title': '日期',
        'yaxis_title': '数量',
    })
    return fig
# 各国    重症患者数量折线图
def country_icu_patients(df, country_name):
    df0 = df[['date', 'icu_patients']].reset_index()
    df0['date'] = df0['date'].dt.date
    df0 = df0.sort_values('date', ascending=False)
    fig = px.line(
        data_frame=df0,
        x='date',
        y='icu_patients',
        title=country_name + '重症患者数量折线图',
        height=900
    )
    fig.update_layout({
        # 'xaxis_dtick': 1,
        'xaxis_title': '日期',
        'yaxis_title': '数量',
    })
    return fig
# 各国    单位重症患者数量折线图
def country_icu_patients_per_million(df, country_name):
    df0 = df[['date', 'icu_patients_per_million']].reset_index()
    df0['date'] = df0['date'].dt.date
    df0 = df0.sort_values('date', ascending=False)
    fig = px.line(
        data_frame=df0,
        x='date',
        y='icu_patients_per_million',
        title=country_name + '单位重症患者数量折线图',
        height=900
    )
    fig.update_layout({
        # 'xaxis_dtick': 1,
        'xaxis_title': '日期',
        'yaxis_title': '数量',
    })
    return fig
# 各国    核酸检测数量折线图
def country_total_tests(df, country_name):
    df0 = df[['date', 'icu_patients_per_million']].reset_index()
    df0['date'] = df0['date'].dt.date
    df0 = df0.sort_values('date', ascending=False)
    fig = px.line(
        data_frame=df0,
        x='date',
        y='icu_patients_per_million',
        title=country_name + '单位重症患者数量折线图',
        height=900
    )
    fig.update_layout({
        # 'xaxis_dtick': 1,
        'xaxis_title': '日期',
        'yaxis_title': '数量',
    })
    return fig
# 各国    新增核酸检测数量折线图
def country_new_tests(df, country_name):
    df0 = df[['date', 'new_tests']].reset_index()
    df0['date'] = df0['date'].dt.date
    df0 = df0.sort_values('date', ascending=False)
    fig = px.line(
        data_frame=df0,
        x='date',
        y='new_tests',
        title=country_name + '新增核酸检测数量折线图',
        height=900
    )
    fig.update_layout({
        # 'xaxis_dtick': 1,
        'xaxis_title': '日期',
        'yaxis_title': '数量',
    })
    return fig
# 各国    单位核酸检测数量折线图
def country_total_tests_per_thousand(df, country_name):
    df0 = df[['date', 'total_tests_per_thousand']].reset_index()
    df0['date'] = df0['date'].dt.date
    df0 = df0.sort_values('date', ascending=False)
    fig = px.line(
        data_frame=df0,
        x='date',
        y='total_tests_per_thousand',
        title=country_name + '单位核酸检测数量折线图',
        height=900
    )
    fig.update_layout({
        # 'xaxis_dtick': 1,
        'xaxis_title': '日期',
        'yaxis_title': '数量',
    })
    return fig
# 各国    单位新增核酸检测数量折线图
def country_new_tests_per_thousand(df, country_name):
    df0 = df[['date', 'new_tests_per_thousand']].reset_index()
    df0['date'] = df0['date'].dt.date
    df0 = df0.sort_values('date', ascending=False)
    fig = px.line(
        data_frame=df0,
        x='date',
        y='new_tests_per_thousand',
        title=country_name + '单位新增核酸检测数量折线图',
        height=900
    )
    fig.update_layout({
        # 'xaxis_dtick': 1,
        'xaxis_title': '日期',
        'yaxis_title': '数量',
    })
    return fig
# 各国    阳性率折线图
def country_positive_rate(df, country_name):
    df0 = df[['date', 'positive_rate']].reset_index()
    df0['date'] = df0['date'].dt.date
    df0 = df0.sort_values('date', ascending=False)
    fig = px.line(
        data_frame=df0,
        x='date',
        y='positive_rate',
        title=country_name + '阳性率折线图',
        height=900
    )
    fig.update_layout({
        # 'xaxis_dtick': 1,
        'xaxis_title': '日期',
        'yaxis_title': '数量',
    })
    return fig
# 各国    疫苗接种总量图
def country_total_vaccinations(df, country_name):
    df0 = df[['date', 'total_vaccinations']].reset_index()
    df0['date'] = df0['date'].dt.date
    df0 = df0.sort_values('date', ascending=False)
    fig = px.line(
        data_frame=df0,
        x='date',
        y='total_vaccinations',
        title=country_name + '疫苗接种总量图',
        height=900
    )
    fig.update_layout({
        # 'xaxis_dtick': 1,
        'xaxis_title': '日期',
        'yaxis_title': '数量',
    })
    return fig
# 各国    接种过疫苗人数
def country_people_vaccinated(df, country_name):
    df0 = df[['date', 'people_vaccinated']].reset_index()
    df0['date'] = df0['date'].dt.date
    df0 = df0.sort_values('date', ascending=False)
    fig = px.line(
        data_frame=df0,
        x='date',
        y='people_vaccinated',
        title=country_name + '接种过疫苗人数',
        height=900
    )
    fig.update_layout({
        # 'xaxis_dtick': 1,
        'xaxis_title': '日期',
        'yaxis_title': '数量',
    })
    return fig
# 各国    全程接种疫苗人数
def country_people_fully_vaccinated(df, country_name):
    df0 = df[['date', 'people_fully_vaccinated']].reset_index()
    df0['date'] = df0['date'].dt.date
    df0 = df0.sort_values('date', ascending=False)
    fig = px.line(
        data_frame=df0,
        x='date',
        y='people_fully_vaccinated',
        title=country_name + '全程接种疫苗人数',
        height=900
    )
    fig.update_layout({
        # 'xaxis_dtick': 1,
        'xaxis_title': '日期',
        'yaxis_title': '数量',
    })
    return fig
# 各国    新增接种疫苗数
def country_new_vaccinations(df, country_name):
    df0 = df[['date', 'new_vaccinations']].reset_index()
    df0['date'] = df0['date'].dt.date
    df0 = df0.sort_values('date', ascending=False)
    fig = px.line(
        data_frame=df0,
        x='date',
        y='new_vaccinations',
        title=country_name + '新增接种疫苗数',
        height=900
    )
    fig.update_layout({
        # 'xaxis_dtick': 1,
        'xaxis_title': '日期',
        'yaxis_title': '数量',
    })
    return fig
# 各国    单位总接种疫苗数
def country_total_vaccinations_per_hundred(df, country_name):
    df0 = df[['date', 'total_vaccinations_per_hundred']].reset_index()
    df0['date'] = df0['date'].dt.date
    df0 = df0.sort_values('date', ascending=False)
    fig = px.line(
        data_frame=df0,
        x='date',
        y='total_vaccinations_per_hundred',
        title=country_name + '单位总接种疫苗数',
        height=900
    )
    fig.update_layout({
        # 'xaxis_dtick': 1,
        'xaxis_title': '日期',
        'yaxis_title': '数量',
    })
    return fig
# 各国    单位接种疫苗人数
def country_people_vaccinated_per_hundred(df, country_name):
    df0 = df[['date', 'people_vaccinated_per_hundred']].reset_index()
    df0['date'] = df0['date'].dt.date
    df0 = df0.sort_values('date', ascending=False)
    fig = px.line(
        data_frame=df0,
        x='date',
        y='people_vaccinated_per_hundred',
        title=country_name + '单位接种疫苗人数',
        height=900
    )
    fig.update_layout({
        # 'xaxis_dtick': 1,
        'xaxis_title': '日期',
        'yaxis_title': '数量',
    })
    return fig
# 各国    单位全程接种疫苗人数
def country_people_fully_vaccinated_per_hundred(df, country_name):
    df0 = df[['date', 'people_fully_vaccinated_per_hundred']].reset_index()
    df0['date'] = df0['date'].dt.date
    df0 = df0.sort_values('date', ascending=False)
    fig = px.line(
        data_frame=df0,
        x='date',
        y='people_fully_vaccinated_per_hundred',
        title=country_name + '单位全程接种疫苗人数',
        height=900
    )
    fig.update_layout({
        # 'xaxis_dtick': 1,
        'xaxis_title': '日期',
        'yaxis_title': '数量',
    })

    return fig
# 中国各省份
# 各省    确诊人数
def province_confirm(df, province_name):
    df0 = df[['date', 'confirm']].reset_index()
    df0['date'] = df0['date'].dt.date
    df0 = df0.sort_values('date', ascending=False)
    fig = px.line(
        data_frame=df0,
        x='date',
        y='confirm',
        title=province_name + '确诊人数',
        height=900
    )
    fig.update_layout({
        # 'xaxis_dtick': 1,
        'xaxis_title': '日期',
        'yaxis_title': '数量',
    })
    return fig
# 各省    死亡人数
def province_dead(df, province_name):
    df0 = df[['date', 'dead']].reset_index()
    df0['date'] = df0['date'].dt.date
    df0 = df0.sort_values('date', ascending=False)
    fig = px.line(
        data_frame=df0,
        x='date',
        y='dead',
        title=province_name + '死亡人数',
        height=900
    )
    fig.update_layout({
        # 'xaxis_dtick': 1,
        'xaxis_title': '日期',
        'yaxis_title': '数量',
    })
    return fig
# 各省    治愈人数
def province_heal(df, province_name):
    df0 = df[['date', 'heal']].reset_index()
    df0['date'] = df0['date'].dt.date
    df0 = df0.sort_values('date', ascending=False)
    fig = px.line(
        data_frame=df0,
        x='date',
        y='heal',
        title=province_name + '治愈人数',
        height=900
    )
    fig.update_layout({
        # 'xaxis_dtick': 1,
        'xaxis_title': '日期',
        'yaxis_title': '数量',
    })
    return fig
# 各省    新增确诊人数
def province_confirm_add(df, province_name):
    df0 = df[['date', 'confirm_add']].reset_index()
    df0['date'] = df0['date'].dt.date
    df0 = df0.sort_values('date', ascending=False)
    fig = px.line(
        data_frame=df0,
        x='date',
        y='confirm_add',
        title=province_name + '新增确诊人数',
        height=900
    )
    fig.update_layout({
        # 'xaxis_dtick': 1,
        'xaxis_title': '日期',
        'yaxis_title': '数量',
    })
    return fig
# 各省    新增治愈人数
def province_heal_add(df, province_name):
    df0 = df[['date', 'heal_add']].reset_index()
    df0['date'] = df0['date'].dt.date
    df0 = df0.sort_values('date', ascending=False)
    fig = px.line(
        data_frame=df0,
        x='date',
        y='heal_add',
        title=province_name + '新增治愈人数',
        height=900
    )
    fig.update_layout({
        # 'xaxis_dtick': 1,
        'xaxis_title': '日期',
        'yaxis_title': '数量',
    })
    return fig
# 各省    新增死亡人数
def province_dead_add(df, province_name):
    df0 = df[['date', 'dead_add']].reset_index()
    df0['date'] = df0['date'].dt.date
    df0 = df0.sort_values('date', ascending=False)
    fig = px.line(
        data_frame=df0,
        x='date',
        y='dead_add',
        title=province_name + '新增死亡人数',
        height=900
    )
    fig.update_layout({
        # 'xaxis_dtick': 1,
        'xaxis_title': '日期',
        'yaxis_title': '数量',
    })
    return fig
一小段用于格式化的代码
# 原始数据档中的日期格式
format1 = '%Y-%m-%d'
format2 = '%Y/%m/%d'


# 日期格式化
def date_process_df1(df):
    df['date'] = pd.to_datetime(df['date'], format=format1)
    return df

def date_process_df2(df):
    df['date'] = pd.to_datetime(df['date'], format=format2)
    return df


 1万+
1万+


 被折叠的 条评论
为什么被折叠?
被折叠的 条评论
为什么被折叠?
 到【灌水乐园】发言


