


目录
Survey Methodology:
● The 2021 Kaggle DS & ML Survey received 25,973 usable responses from participants in 171 different countries and territories.
● You can find the full list of questions and answer choices in the file "kaggle_survey_2021_answer_choices.pdf".
● Responses to multiple choice questions (only a single choice can be selected) were recorded in individual columns. Responses to multiple selection questions (multiple choices can be selected) were split into multiple columns (with one column per answer choice).
● To ensure response quality, we excluded respondents that were flagged by our survey system as “Spam” or "Duplicate. We also dropped responses from respondents that spent less than 2 minutes completing the survey, as well as responses from respondents that selected fewer than 15 answer choices in total.
● To protect the respondents’ privacy, free-form text responses were not included in the public survey dataset, and the order of the rows was shuffled (responses are not displayed in chronological order). Likewise, if a country or territory received less than 50 respondents, we grouped them into a group named “Other” for the sake of anonymity.
● An invitation to participate in the survey was sent to the entire Kaggle community (anyone opted-in to the Kaggle Email List). The survey was also promoted on the Kaggle website (via both banners and popups) as well as on the Kaggle Twitter channel.
● The survey was live from 09/01/2021 to 10/04/2021. We allowed respondents to complete the survey at any time during that window.
● The survey data was released under a CC 2.0 license: https://creativecommons.org/licenses/by/2.0/
import numpy as np
import pandas as pd
import matplotlib.pyplot as plt
import plotly.express as px
import plotly.io as pio
pio.templates.default='gridon'
import plotly.graph_objects as go
一、读取和加载数据
# 读取数据
# skiprows=1 表示读取的时候跳过第一行
df = pd.read_csv('../kaggle2021survey/kaggle-survey-2021/kaggle_survey_2021_responses.csv',skiprows=1)
# 简单查看一下数据
df.head()
# 25973条数据,369列
df.info()
# 为了显示方便,将一些国家的名字改成缩写,inplace=True 表示直接对源数据进行更改
df[df.columns[3]].replace({'United Kingdom of Great Britain and Northern Ireland':'UK',
                           'Iran, Islamic Republic of...':'Iran',
                           'United Arab Emirates':'UAE',
                           'United States of America':'USA',
                           'Viet Nam':'Vietnam'}, inplace=True)

# 为了方便分析,把列分段进行操作,先分析前7列的数据,并把列名重新命名一下
df_seven = df[df.columns[:7]]
df_seven = df_seven.rename(columns={'What is your age (# years)?':'age',
         'What is your gender? - Selected Choice':'gender',
        'In which country do you currently reside?':'country',
         'What is the highest level of formal education that you have attained or plan to attain within the next 2 years?':'education',
         'Select the title most similar to your current role (or most recent title if retired): - Selected Choice':'job',
         'For how many years have you been writing code and/or programming?':'code_age'
})

df_seven
二、分析
1.国家
1.1 参与问卷调查的国家有哪些
# 统计有哪些国家的kagglers参与了问卷调查
print(f"List of countries:\n{np.sort(df_seven[df_seven.columns[3]].unique())}\n")
List of countries:
['Algeria' 'Argentina' 'Australia' 'Austria' 'Bangladesh' 'Belarus'
'Belgium' 'Brazil' 'Canada' 'Chile' 'China' 'Colombia' 'Czech Republic'
'Denmark' 'Ecuador' 'Egypt' 'Ethiopia' 'France' 'Germany' 'Ghana'
'Greece' 'Hong Kong (S.A.R.)' 'I do not wish to disclose my location'
'India' 'Indonesia' 'Iran' 'Iraq' 'Ireland' 'Israel' 'Italy' 'Japan'
'Kazakhstan' 'Kenya' 'Malaysia' 'Mexico' 'Morocco' 'Nepal' 'Netherlands'
'Nigeria' 'Norway' 'Other' 'Pakistan' 'Peru' 'Philippines' 'Poland'
'Portugal' 'Romania' 'Russia' 'Saudi Arabia' 'Singapore' 'South Africa'
'South Korea' 'Spain' 'Sri Lanka' 'Sweden' 'Switzerland' 'Taiwan'
'Thailand' 'Tunisia' 'Turkey' 'UAE' 'UK' 'USA' 'Uganda' 'Ukraine'
'Vietnam']1.2 参与问卷调查的人员国家分布情况
# 统计每个国家的参与人数
country_group = df_seven.groupby('country').count().reset_index()
country_group['count']=country_group['age']
country_group = country_group[['country','count']]

# 参与人数的地理分布情况
fig = px.choropleth(country_group, locations="country",
                    locationmode='country names', color='count',
                    hover_name="country", range_color=[1,5000],
                    color_continuous_scale="peach",
                    title = '参与问卷的kagglers的国家分布情况')
# fig.update(layout_coloraxis_showscale=False)
fig.show()
1.3 参与调查问卷人数排名前十的国家有哪些
# 参与人数排名前十的国家
fig = px.bar(country_group.sort_values('count',ascending=False)[:10][::-1],
x='count', y='country',
title='参与问卷的kagglers排名前十的国家', text='count', height=1000, orientation='h')
fig.update_layout(uniformtext_minsize=10, uniformtext_mode='hide')
fig.show()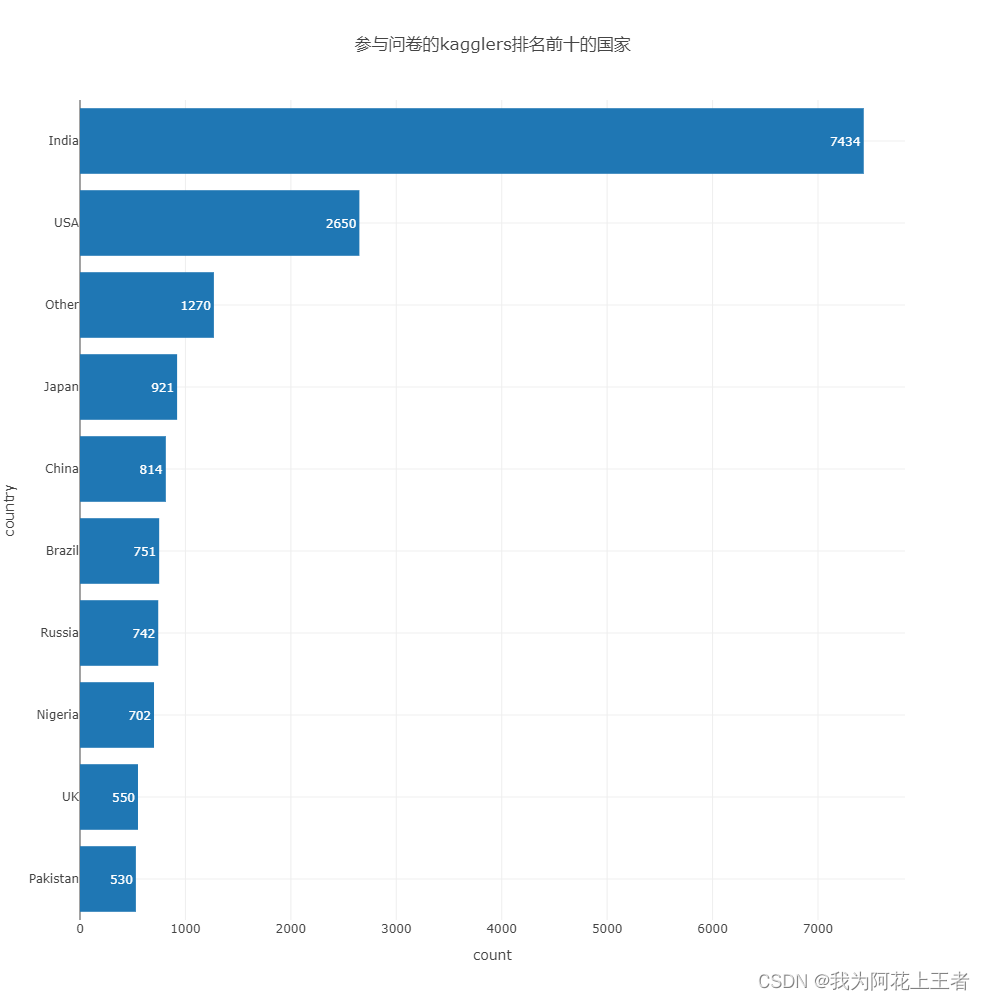 参与人数最多的国家是印度,其次是美国、日本和中国。
2.年龄
2.1 参与调查问卷的人员年龄分布情况
fig = px.pie(df_seven, df_seven.columns[1], title='kagglers的年龄分布情况', hole=0.6)
fig.update_traces(textinfo='percent+label')
fig.update_layout(uniformtext_minsize=10, uniformtext_mode='hide')
fig.show()
可以发现小于30岁的kagglers占了56%。
2.2 参与调查问卷的中国的kagglers年龄分布情况
country = 'China'
title = f"{country} 的kagglers年龄分布情况"
fig = px.pie(df_seven[df_seven[df_seven.columns[3]]==country], df_seven.columns[1], title=title, hole=0.6)

# 更新显示样式,默认的是只显示percent
fig.update_traces(textinfo='percent+label')
fig.update_layout(uniformtext_minsize=10, uniformtext_mode='hide')
fig.show()
2.3 中国的kagglers年龄分布情况与其他国家对比
# 添加新的一列,将中国和其他国家区分开,使用np.where()方法
df_seven['country_agg'] = np.where(df_seven['country']=='China',country,'Others')
df_country = df_seven[df_seven.country_agg==country][df_seven.columns[1]].value_counts(normalize=True).sort_index()
df_others = df_seven[df_seven.country_agg=='Others'][df_seven.columns[1]].value_counts(normalize=True).sort_index()

# 保证China和Others的index一致,如果缺少了就补上
for index in df_others.index:
    if index not in df_country.index:
        df_country[index] = 0
df_country.sort_index(inplace=True)

fig = go.Figure(data=[
    go.Bar(name='Others', x=df_others.index, y=df_others.values*100),
    go.Bar(name=country, x=df_others.index, y=df_country.values*100)

])


# 改变柱状图的样式
fig.update_layout(
    barmode='group',
    title=f'中国的kagglers年龄分布情况与其他国家对比',
    xaxis_title='Age',
    yaxis_title='Percentage of respondents',
)

fig.show()
中国有更多的年轻人参与了Kaggle的调查问卷
3.性别
# 看一下性别组成
df_seven[df_seven.columns[2]].value_counts() 
3.1 参加调查问卷的人数性别分布情况
这里发现除了男和女,还有其他不同的回答,我们将除了男女的回答统一设置为Others_Gender
df_seven[df_seven.columns[2]].replace(
{
    'Prefer not to say':'Others_Gender',
    'Nonbinary':'Others_Gender',
    'Prefer to self-describe':'Others_Gender'
}
,inplace=True)

# 以饼状图的形式给出kagglers的性别组成
fig = px.pie(df_seven, df_seven.columns[2], title=f"所有kagglers的性别分布", hole=0.6)
fig.update_traces(textinfo='percent+label')
fig.update_layout(uniformtext_minsize=10, uniformtext_mode='hide')
fig.show()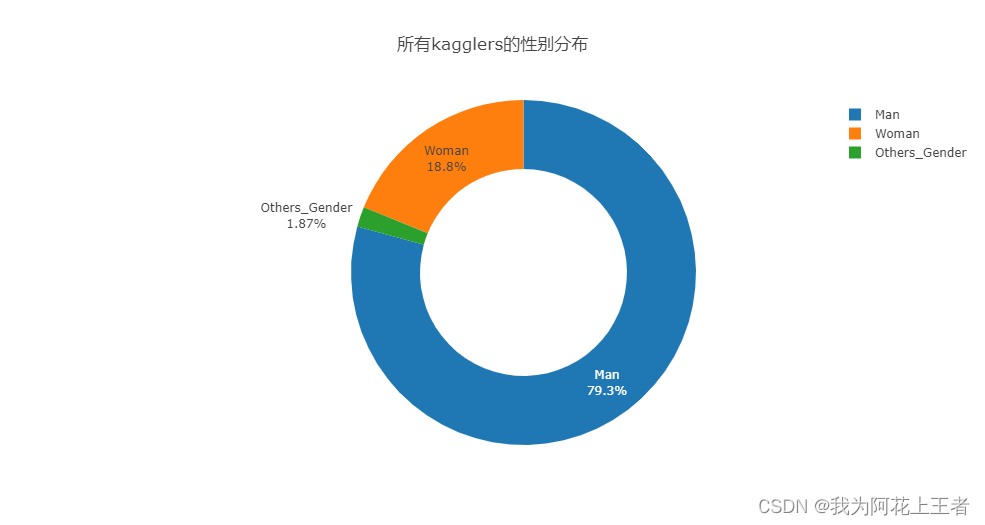
3.2 中国Kagglers的性别组成与其他国家对比
df_country_gender = df_seven[df_seven.country_agg==country].iloc[:,2].value_counts(normalize=True).sort_values(ascending=False)
df_other_platform = df_seven[df_seven.country_agg=='Others'].iloc[:,2].value_counts(normalize=True).sort_values(ascending=False)

fig = go.Figure(data=[
    go.Bar(name='Others', x=df_other_platform.index, y=df_other_platform.values*100),
    go.Bar(name=country, x=df_country_gender.index, y=df_country_gender.values*100)
])
# 改变样式
fig.update_layout(
    title=f'中国Kagglers的性别组成与其他国家对比',
    xaxis_title=None,
    yaxis_title='Percentage',
)
fig.show()
从上图可以看出,每个国家的额参与者都是男多女少,男生数量是女生的4倍多。
4. 学历
# 查看一下学历组成
df_seven[df_seven.columns[4]].value_counts()
4.1 参与调查问卷的人员的学历分布情况
# 参与调查问卷的人员的学历分布情况
fig = px.pie(df_seven, df_seven.columns[4],
             title="kagglers的学历分布情况", hole=0.6)
fig.update_traces(textinfo='percent+label')
fig.update_layout(uniformtext_minsize=10, uniformtext_mode='hide')
fig.show()
4.2 中国kagglers的学历分布情况
# 中国kagglers的学历分布
fig = px.pie(df_seven[df_seven.iloc[:,3]==country], df_seven.columns[4], title=f"中国kagglers的学历分布", hole=0.6)
fig.update_traces(textinfo='percent+label')
fig.update_layout(uniformtext_minsize=10, uniformtext_mode='hide', showlegend=False)
fig.show()
以上分析可以得出,参与调查问卷的人员的学历大部分集中在学士学位和硕士学位,受教育程度偏高。
5. 职业
# 查看一下职业组成
df_seven[df_seven.columns[5]].value_counts()
5.1 kagglers的职业分布情况
fig = px.pie(df_seven, df_seven.columns[5], title='kagglers的职业分布情况', hole=0.6)
fig.update_traces(textinfo='percent+label')
fig.update_layout(uniformtext_minsize=10, uniformtext_mode='hide', showlegend=False)
fig.show()
5.2 中国的kagglers的职业分布情况
fig = px.pie(df_seven[df_seven.iloc[:,3]==country], df_seven.columns[5], title=f"中国的kagglers的职业分布情况", hole=0.6)
fig.update_traces(textinfo='percent+label')
fig.update_layout(uniformtext_minsize=10, uniformtext_mode='hide')
fig.show()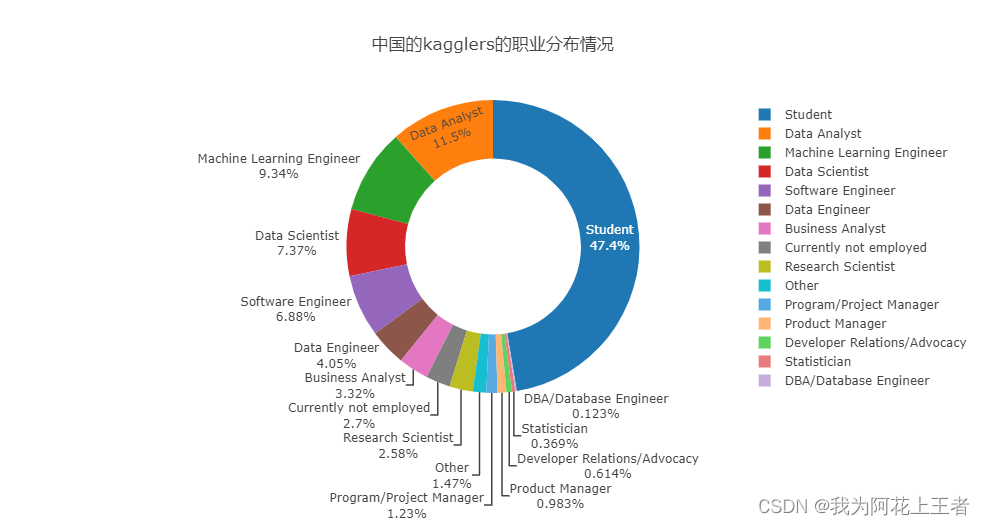 以上分析可以看出,参与调查问卷的学生占大多数,这种状况在中国更明显。其次是数据分析师。
6.编程经验
# 编程经验组成
df_seven[df_seven.columns[6]].value_counts() 
6.1 中国的kagglers的编程经验与其他国家对比
# 为了便于分析,将‘I have never written code’数据改为0
df_seven[df_seven.columns[6]].replace("I have never written code","0 years",inplace=True)

# 中国
df_country_ProExp = df_seven[df_seven[df_seven.columns[3]]==country][df_seven.columns[6]].value_counts(normalize=True).sort_values()

# 其他国家
df_others_ProExp = df_seven[df_seven[df_seven.columns[3]]!=country][df.columns[6]].value_counts(normalize=True).sort_values()

fig = go.Figure(data = [go.Bar(name="others", x = df_others_ProExp.values*100, y = df_country_ProExp.index, orientation='h'),
                        go.Bar(name="China", x = df_country_ProExp.values*100, y = df_others_ProExp.index, orientation='h')
                       ])
fig.update_layout(
    title=f'中国的kagglers的编程经验与其他国家对比',
    xaxis_title='Percentage',
    yaxis_title='Programming Experience',
    margin=dict(l=100)
)
fig.show()
以上分析可以看出,参与调查问卷的中国人,他们的编程经验大多集中在1-3年和3-5年之间,但是5-10年及以上的人数占比却较于其他国家少。其他国家从事编程相对来说要比中国早,中国目前学习编程的人数在增加。


 518
518


 被折叠的 条评论
为什么被折叠?
被折叠的 条评论
为什么被折叠?
 到【灌水乐园】发言


