


前言
系列专栏:机器学习:高级应用与实践【项目实战100+】【2024】✨︎
在本专栏中不仅包含一些适合初学者的最新机器学习项目,每个项目都处理一组不同的问题,包括监督和无监督学习、分类、回归和聚类,而且涉及创建深度学习模型、处理非结构化数据以及指导复杂的模型,如卷积神经网络、门控循环单元、大型语言模型和强化学习模型
我们提出了一种数据挖掘方法来预测人类的葡萄酒口味偏好,该方法基于认证步骤中易于获得的分析测试。考虑了一个大型数据集(与该领域的其他研究相比)。在同时执行变量和模型选择的计算高效程序下应用了五种回归技术。随机森林与梯度提升树取得了可喜的结果,优于多元回归和神经网络方法。这种模型有助于支持酿酒师的品酒评估和提高葡萄酒产量。此外,类似的技术可以通过对于市场的消费者口味进行建模来帮助进行目标营销。
目录
1. 相关库和数据集
1.1 相关库介绍
Python 库使我们能够非常轻松地处理数据并使用一行代码执行典型和复杂的任务。
Pandas– 该库有助于以 2D 数组格式加载数据框,并具有多种功能,可一次性执行分析任务。Numpy– Numpy 数组速度非常快,可以在很短的时间内执行大型计算。Matplotlib/Seaborn– 此库用于绘制可视化效果,用于展现数据之间的相互关系。Sklearn– 包含多个库,这些库具有预实现的功能,用于执行从数据预处理到模型开发和评估的任务。
import numpy as np
import pandas as pd
import seaborn as sns
import matplotlib.pyplot as plt
from matplotlib.colors import ListedColormap

from sklearn.preprocessing import MinMaxScaler
from sklearn.model_selection import train_test_split
from sklearn.metrics import accuracy_score, confusion_matrix, roc_auc_score

from sklearn.neighbors import KNeighborsClassifier
from sklearn.naive_bayes import GaussianNB
from sklearn.svm import SVC
from sklearn.ensemble import RandomForestClassifier
from sklearn.ensemble import GradientBoostingClassifier
1.2 数据集介绍
我们使用互联网上免费提供的葡萄酒质量数据集。该数据集具有影响葡萄酒质量的基本特征。通过使用几个机器学习模型,我们将预测葡萄酒的质量。
| Feature | Explain |
|---|---|
| fixed acidity | most acids involved with wine or fixed or nonvolatile |
| volatile acidity | the amount of acetic acid in wine |
| citric acid | the amount of citric acid in wine |
| residual sugar | the amount of sugar remaining after fermentation stops |
| chlorides | the amount of salt in the wine. |
| free sulfur dioxide | the amount of free sulfur dioxide in the wine(those available to react and thus exhibit both germicidal and antioxidant properties) |
| total sulfur dioxide | amount of free and bound forms of SO2 |
| density | the measurement of how tightly a material is packed together |
| PH | describes how acidic or basic a wine is on a scale from 0 (very acidic) to 14 (very basic); most wines are between 3-4 |
| Alcohol | the percent alcohol content of the wine |
| quality | output variable (based on sensory data, score between 3 and 8) |
1.2.1 加载数据
# Read in white wine data
# df = pd.read_csv("http://archive.ics.uci.edu/ml/machine-learning-databases/wine-quality/winequality-white.csv", sep =';')

# Read in red wine data
# df = pd.read_csv("http://archive.ics.uci.edu/ml/machine-learning-databases/wine-quality/winequality-red.csv", sep =';')
df = pd.read_csv('winequality-red.csv', sep =';')
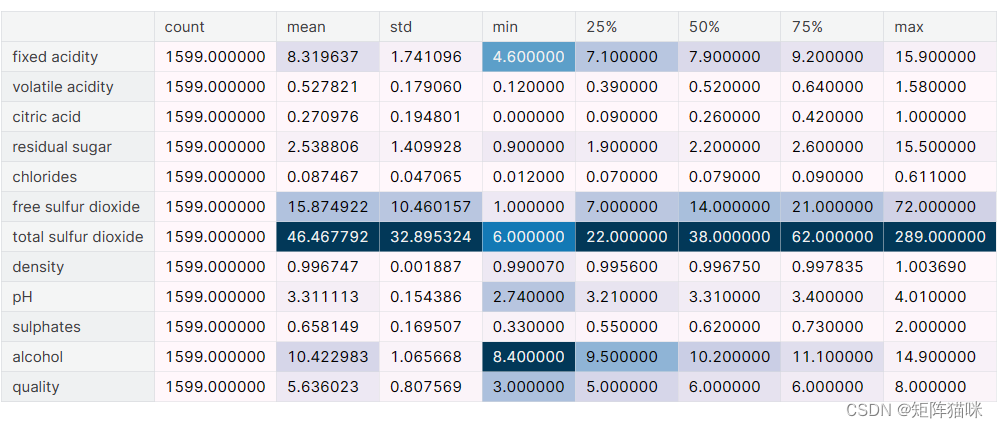
1.2.2 描述统计
.describe()生成描述性统计信息。描述性统计包括总结数据集分布的中心趋势、分散度和形状的统计,不包括NaN值。
分析数字序列和对象序列,以及混合数据类型的DataFrame列集。
# Describe `df`
df.describe().T.style.background_gradient(axis=0)
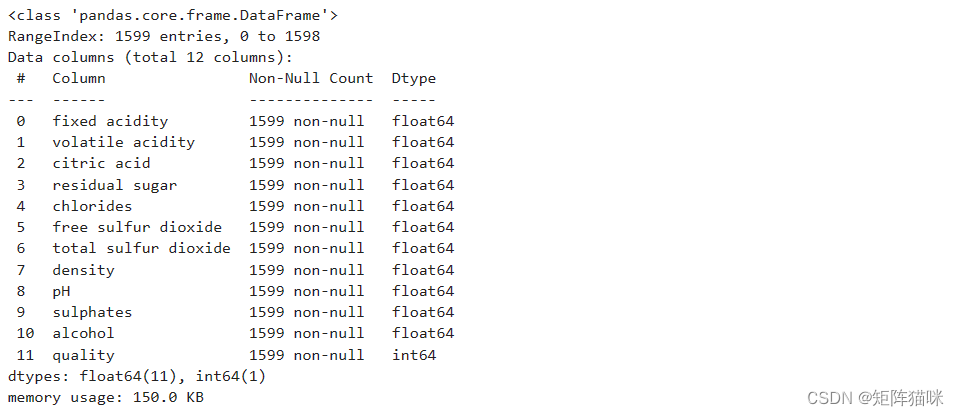
1.2.3 数据信息
.info()方法打印有关DataFrame的信息,包括索引dtype和列、非null值以及内存使用情况。
df.info()
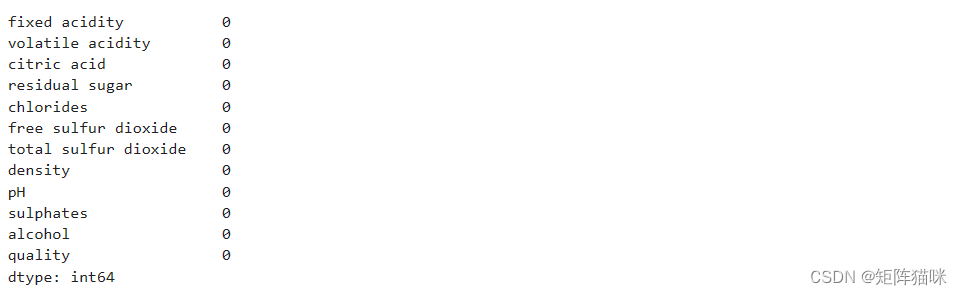
2. 探索性数据分析
EDA是一种使用视觉技术分析数据的方法。它用于发现趋势和模式,或借助统计摘要和图形表示来检查假设。现在,让我们检查数据集列中的空值数。
df.isnull().sum()
2.1 特征分布(堆叠直方图)
让我们绘制堆叠直方图,直观显示数据集列中连续值的分布情况。
sns.set_theme(style="white")
long_df = df.melt(var_name='category', value_name='value')

# Initialize the figure with a logarithmic x axis
fig, axes = plt.subplots(nrows=4, ncols=3, figsize=(30, 24))
axes = axes.ravel()  # 将多维数组展平为一维数组

# 计算每行每列应该绘制的列索引
for i, ax in enumerate(axes[:len(df.columns)]):
    row, col = divmod(i, 3)
    sns.histplot(data=df, x=df.columns[i], ax=ax, hue="quality", stat='frequency', multiple='stack',palette=sns.color_palette(n_colors=6))
    ax.set_title(df.columns[i])  # 设置子图标题
    ax.set_xlabel('Value')  # 设置x轴标签

# 隐藏超出数据范围的子图
for ax in axes[len(df.columns):]:
    ax.axis('off')

plt.tight_layout()
plt.show()

2.1 特征相关性(热力图)
sns.heatmap(df.corr(), annot=True, fmt='.1f', linewidth=0.25, annot_kws={"fontsize": 8}, cmap='Purples', square=True)
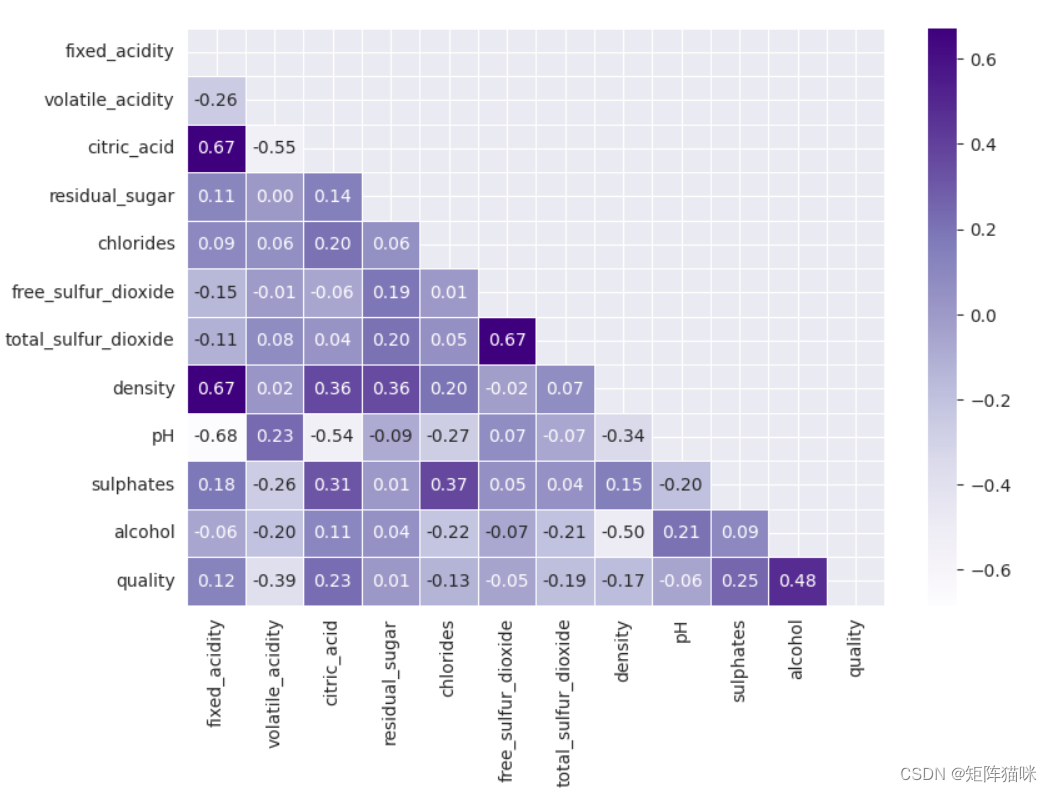
从上面的热图中,我们可以得出结论,“总二氧化硫”和“游离二氧化硫”是高度相关的特征
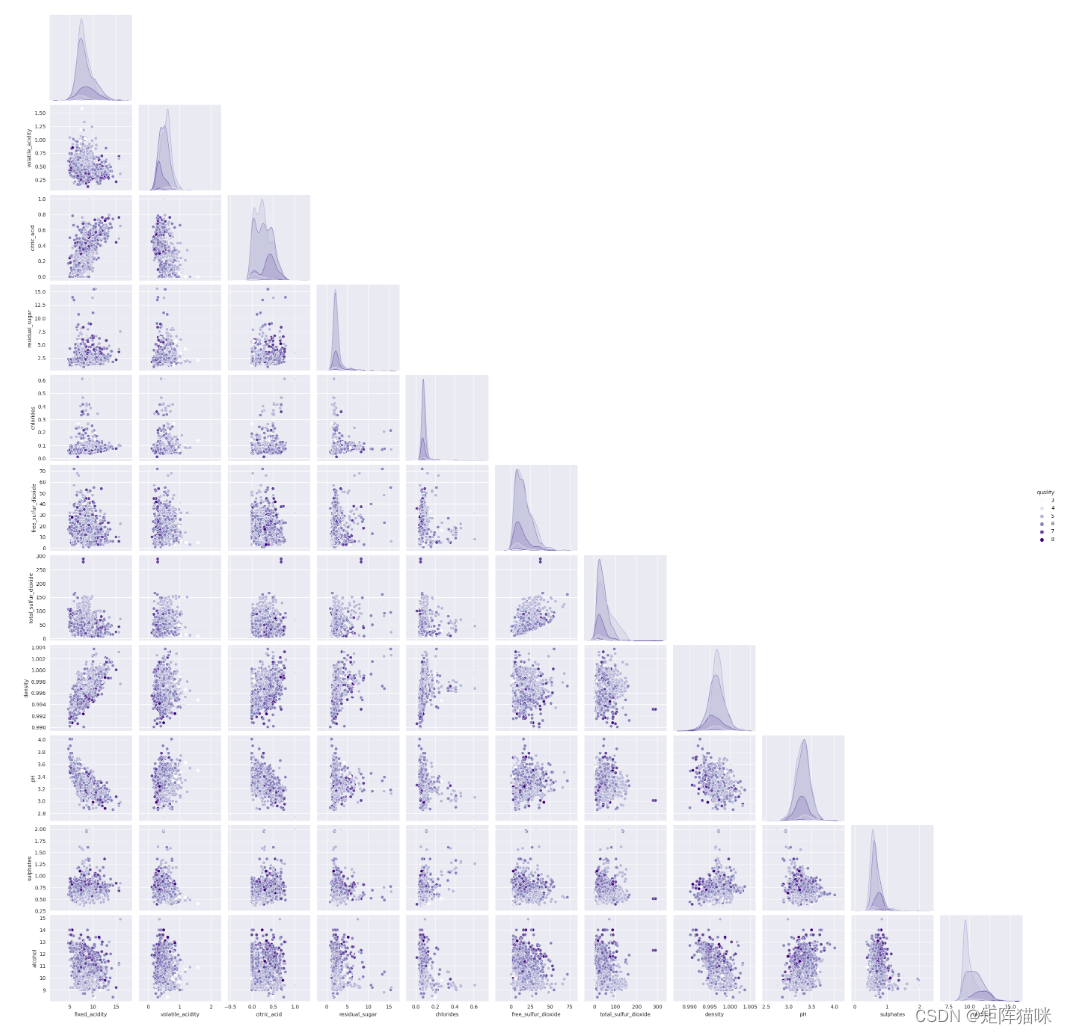
sns.pairplot(df, hue='quality', corner = True, palette='Purples')
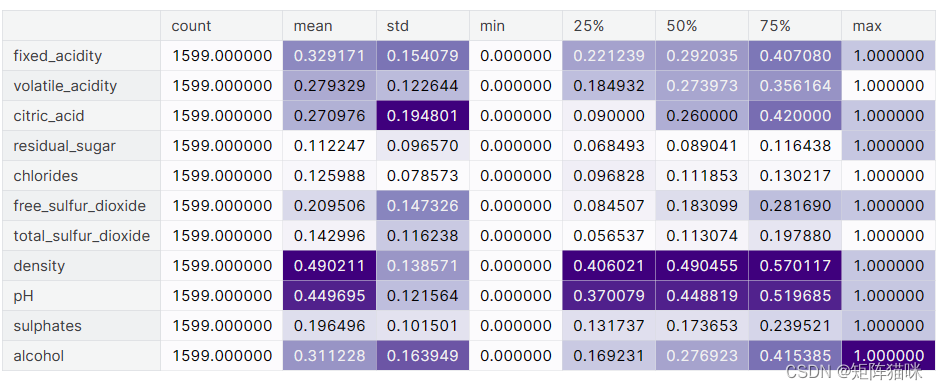
2.1 特征缩放(归一化)
MinMaxScaler 是 scikit-learn(一个流行的 Python 机器学习库)中的一个实用工具,用于特征缩放。它通过对每个特征进行最小-最大缩放(也称为归一化)来将特征值转换到一个指定的范围,通常是 [0, 1]。 最小-最大缩放是一种常用的特征预处理技术,特别是在使用那些基于距离的算法(如 k-最近邻、支持向量机、神经网络等)时。这是因为不同的特征可能具有不同的量纲或单位,这可能会导致某些特征在算法中占据主导地位。通过缩放,可以确保所有特征都在相同的范围内,从而避免这种情况。
MinMaxScaler 的主要功能是:
对每个特征进行缩放,使其值在 [0, 1] 范围内。 它是无参数的,这意味着它不需要估计任何参数(如均值和标准差)。 它是可逆的,意味着你可以从缩放后的数据恢复到原始数据。
# Create X from DataFrame and y as Target
X_temp = df.drop(columns='quality', axis=1)
scaler = MinMaxScaler(feature_range=(0, 1)).fit_transform(X_temp)
features = pd.DataFrame(scaler, columns=X_temp.columns)

df['best quality'] = [1 if x > 5 else 0 for x in df.quality]
target = df['best quality']

features.describe().T.style.background_gradient(axis=0, cmap='Purples')
3. 数据建模(分类)
3.1 数据准备(拆分为训练集和测试集)
让我们准备好用于训练的数据,并将其分为训练数据和验证数据,这样我们就能根据用例选择性能最佳的模型。我们将训练一些最先进的机器学习分类模型,然后使用验证数据从中选出最佳模型。
# Splitting the data set for training and validating
X_train, X_val,\
	Y_train, Y_val = train_test_split(features, target,
									test_size=0.2,
									random_state=10)
X_train.shape, X_val.shape
((1279, 11), (320, 11))
3.2 模型构建(KNN、GaussianNB、SVC、RF、DBDT)
models = [KNeighborsClassifier(), GaussianNB(), SVC(kernel='rbf'),\
          GradientBoostingClassifier(), RandomForestClassifier()]

# 循环遍历每个分类器
for i in range(len(models)):
	models[i].fit(X_train, Y_train)

	print(f'{models[i]} : ')

	train_preds = models[i].predict(X_train)
	print('Training Accuracy : ', accuracy_score(Y_train, train_preds))

	val_preds = models[i].predict(X_val)
	print('Validation Accuracy : ', accuracy_score(Y_val, val_preds))
	print()
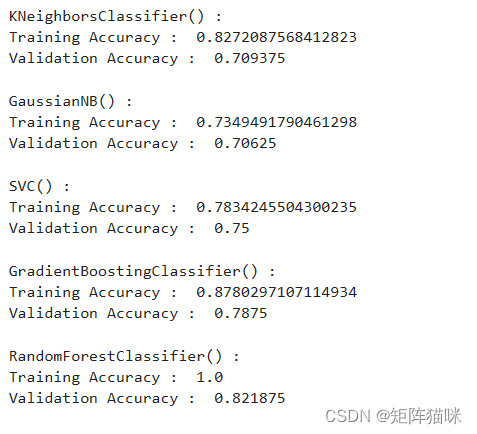
4. 模型评估
从上述精度中,我们可以说随机森林分类器在验证数据上表现更好,验证数据和训练数据之间的差异较小。让我们使用随机森林模型绘制验证数据的混淆矩阵。
models = [KNeighborsClassifier(), GaussianNB(), SVC(kernel='rbf'),\
          GradientBoostingClassifier(), RandomForestClassifier()]

# 循环遍历每个分类器
for i in range(len(models)):
    # 训练分类器
    models[i].fit(X_train, Y_train)

    # 在验证集上进行预测
    val_preds = models[i].predict(X_val)

    # 显示混淆矩阵
    metrics.ConfusionMatrixDisplay.from_estimator(
        models[i], X_val, Y_val,
        cmap=sns.cubehelix_palette(dark=.20, light=.95, as_cmap=True))

    plt.title(f'Confusion Matrix for {models[i].__class__.__name__}')
    plt.show()
    print(f'{models[i].__class__.__name__} : ')
    print(metrics.classification_report(
    Y_val, models[i].predict(X_val)))


 2万+
2万+


 被折叠的 条评论
为什么被折叠?
被折叠的 条评论
为什么被折叠?
 到【灌水乐园】发言


