


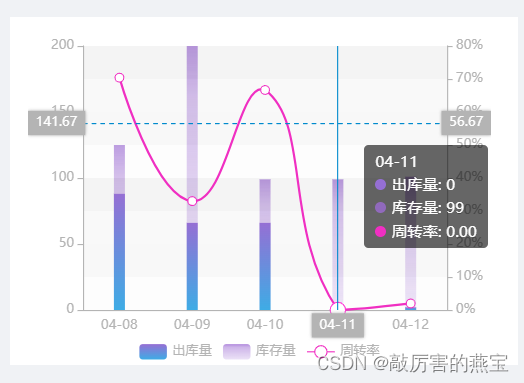
示例图:
实现代码:
BarLineChart.vue
<!-- 库存周转率 -->
<template>
<div :class="className" :style="{height:height,width:width}"/>
</template>
<script >
import * as echarts from 'echarts'
require('echarts/theme/macarons') // echarts theme
import resize from './mixins/resize'
import {graphic} from "echarts/lib/export";
export default {
mixins: [resize],
props: {
className: {
type: String,
default: 'chart'
},
width: {
type: String,
default: '98%'
},
height: {
type: String,
default: '300px'
},
autoResize: {
type: Boolean,
default: true
},
Data: {
type: Object,
required: true
}
},
data() {
return {
chart: null,
percentage:0,
}
},
created() {
this.getPercentage();
},
mounted() {
this.$nextTick(() => {
this.initChart();
})
},
beforeDestroy() {
if (!this.chart) {
return
}
this.chart.dispose()
this.chart = null
},
methods: {
getPercentage(){
this.percentage=this.Data.outBound.map((outBound,index)=>{
const inventory=this.Data.inventory[index];
return(outBound/inventory*100).toFixed(2);
})},
initChart(){
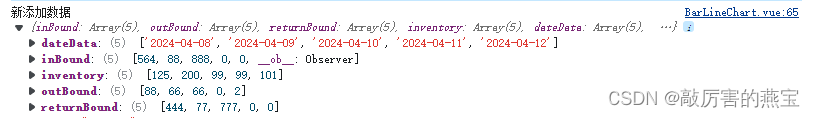
console.log("新添加数据", this.Data)
this.chart = echarts.init(this.$el, 'macarons')
this.setOptions(this.Data)
},
setOptions(){
this.chart.setOption({
tooltip: {
trigger: "axis",
backgroundColor: "rgba(0,0,0,.6)",
borderColor: "rgba(147, 235, 248, .8)",
textStyle: {
color: "#FFF",
},
axisPointer: {
type: 'cross'
},
padding: [5, 10],
},
legend: {
data: ["出库量", "库存量","周转率"],
textStyle: {
color: "#B4B4B4",
},
// top: "0",
bottom:"0",
},
grid: {
left: "50px",
right: "40px",
bottom: "50px",
top: "10px",
},
xAxis: {
data: this.Data.dateData.map(n=>n.substr(-5)),
axisLine: {
lineStyle: {
color: "#B4B4B4",
},
},
axisTick: {
show: false,
},
},
yAxis: [
{
splitLine: { show: false },
axisLine: {
lineStyle: {
color: "#B4B4B4",
},
},
axisLabel: {
formatter: "{value}",
},
},
{
splitLine: { show: false },
axisLine: {
lineStyle: {
color: "#B4B4B4",
},
},
axisLabel: {
formatter: "{value}% ",
},
},
],
series: [
{
name: "出库量",
type: "bar",
barWidth: 10,
itemStyle: {
borderRadius: 5,
color: new graphic.LinearGradient(0, 0, 0, 1, [
{ offset: 0, color: "#956FD4" },
{ offset: 1, color: "#3EACE5" }
]),
},
data: this.Data.outBound,
},
{
name: "库存量",
type: "bar",
barGap: "-100%",
barWidth: 10,
itemStyle: {
borderRadius: 5,
color: new graphic.LinearGradient(0, 0, 0, 1, [
{ offset: 0, color: "rgba(156,107,211,0.8)" },
{ offset: 0.2, color: "rgba(156,107,211,0.5)" },
{ offset: 1, color: "rgba(156,107,211,0.2)" },
]),
},
z: -12,
data: this.Data.inventory,
},
{
name: "周转率",
type: "line",
smooth: true,
showAllSymbol: true,
symbol: "emptyCircle",
symbolSize: 8,
yAxisIndex: 1,
itemStyle: {
color: "#F02FC2",
},
data: this.percentage,
},
],
})
}
},
}
</script>
<style scoped lang="scss"></style>
数据参考:
父页面:index.vue调用BarLineChart.vue
<el-col :xs="24" :sm="24" :lg="8">
        <div class="chart-wrapper">
          <bar-line-chart :data="lineChartData" v-if="!isLoading1"/>
        </div>
      </el-col>
注意引用
import BarLineChart from "./dashboard/BarLineChart"


 2631
2631


 被折叠的 条评论
为什么被折叠?
被折叠的 条评论
为什么被折叠?
 到【灌水乐园】发言


