


🤵♂️ 个人主页:@艾派森的个人主页
✍🏻作者简介:Python学习者
🐋 希望大家多多支持,我们一起进步!😄
如果文章对你有帮助的话,
欢迎评论 💬点赞👍🏻 收藏 📂加关注+
目录
1.项目背景
随着电子游戏行业的蓬勃发展,市场数据呈现爆炸性增长,为理解市场动态、玩家偏好和竞争态势提供了丰富的信息源。在这个数据驱动的时代,企业越来越依赖于精准的数据分析来制定市场策略和产品规划。因此,对视频游戏销量数据集进行可视分析显得尤为重要。
通过可视化技术,我们能够将复杂的销售数据转化为直观、易于理解的图表和图像,揭示数据背后的规律和趋势。这种分析方式不仅能够帮助游戏企业了解市场需求和玩家偏好,优化产品设计,还能帮助他们预测市场趋势,提前布局新兴市场,从而在激烈的市场竞争中保持领先地位。
此外,视频游戏销量数据集的可视分析还具有重要的社会和经济意义。游戏作为一种文化现象,已经渗透到人们生活的方方面面。通过研究游戏销量数据,我们可以更深入地了解游戏在社会文化中的地位和作用,为相关政策制定和监管提供科学依据。同时,该研究还能为游戏教育和游戏治疗等领域提供有价值的参考。
2.数据集介绍
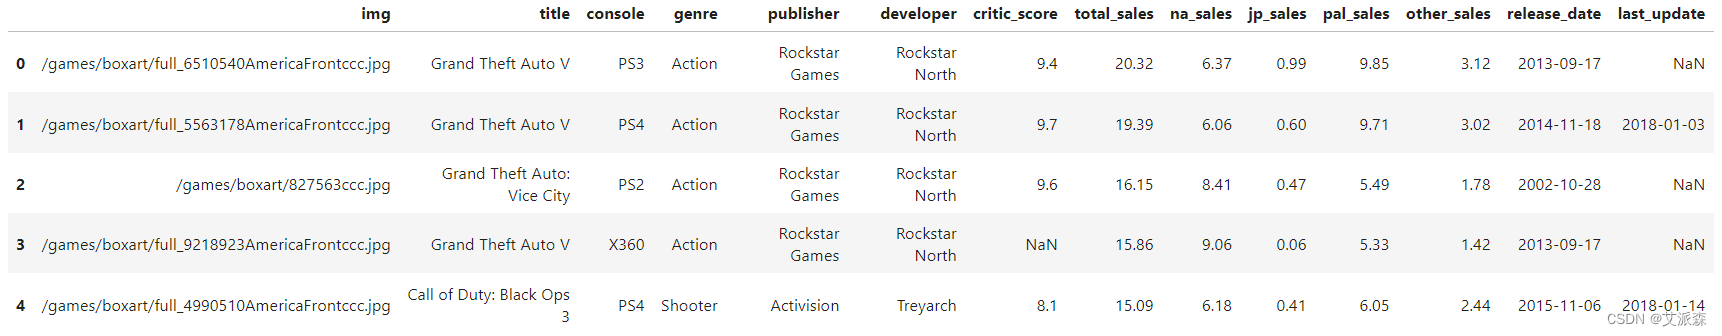
本实验数据集来源于Kaggle,原始数据集共有64016条,14个变量,各变量含义如下:
img是vgchartz.com网站上游戏封面图片的URL(类型:字符串)。
title是游戏的名称(类型:字符串)。
console是指游戏为(类型:字符串)发布的控制台。
genre是指游戏的类型(类型:字符串)。
publisher是游戏的供应商(类型:字符串)
developer是游戏的开发商(类型:字符串)
critic_score是指Metacritic评分(0-10范围)(实数)。
total_sales是指在全球百万拷贝的总销售额。
na_sales是指北美地区以百万位数的销售额。
jp_sale是指日本地区销售额的百万位数。
pal_sales是指欧洲/非洲地区以百万位数的销售额。
other_sales是指销量达到百万的其他产品。
release_date是指游戏发布的日期(类型:日期和时间)。
last_update是指最新数据更新的日期(类型:日期和时间)。
3.技术工具
Python版本:3.9
代码编辑器:jupyter notebook
4.导入数据
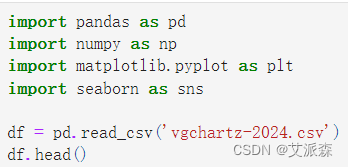
导入数据分析第三方库并导入数据
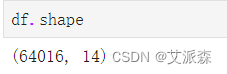
查看数据大小
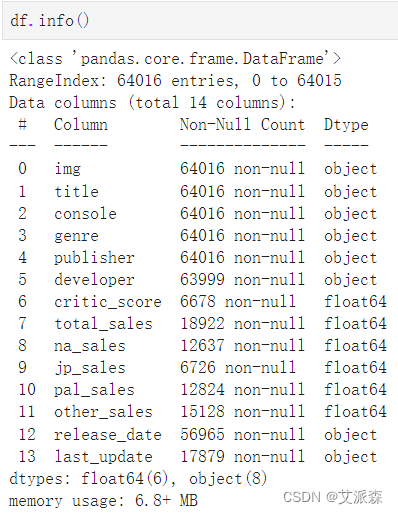
查看数据基本信息
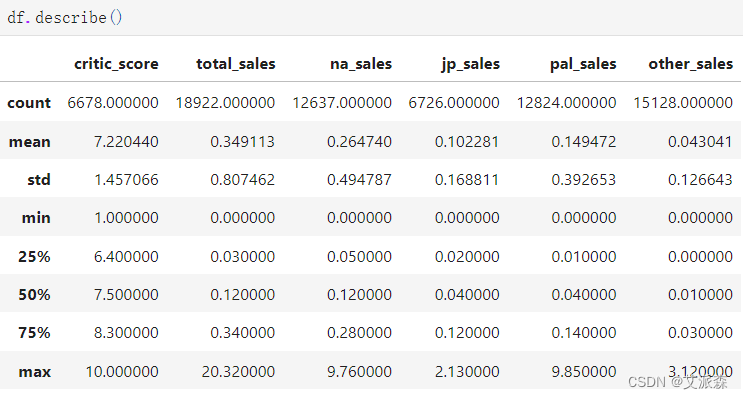
查看数值型变量的描述性统计
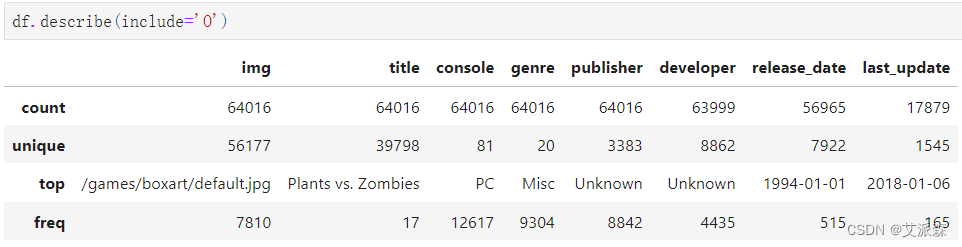
查看非数值型变量的描述性统计
5.数据可视化


源代码
import pandas as pd
import numpy as np
import matplotlib.pyplot as plt
import seaborn as sns
df = pd.read_csv('vgchartz-2024.csv')
df.head()
df.shape
df.info()
df.describe()
df.describe(include='O')
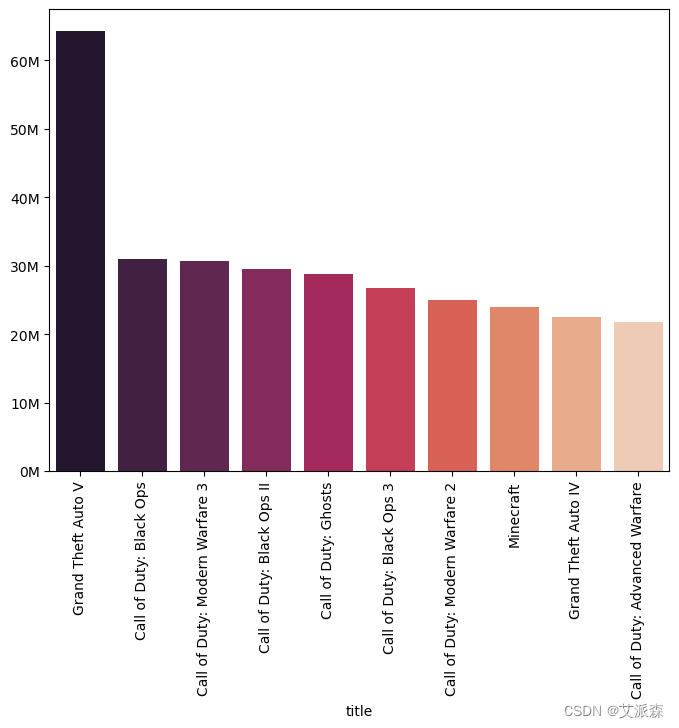
# 最畅销游戏
top_selling_games=df.groupby('title')['total_sales'].sum().sort_values(ascending=False).head(10)
plt.figure(figsize=(8,6))
ax=sns.barplot(data=df,x=top_selling_games.index,y=top_selling_games.values,palette='rocket')
plt.gca().yaxis.set_major_formatter(plt.FuncFormatter(lambda x, _: f'{x:.0f}M'))
plt.xticks(rotation=90)
plt.show()
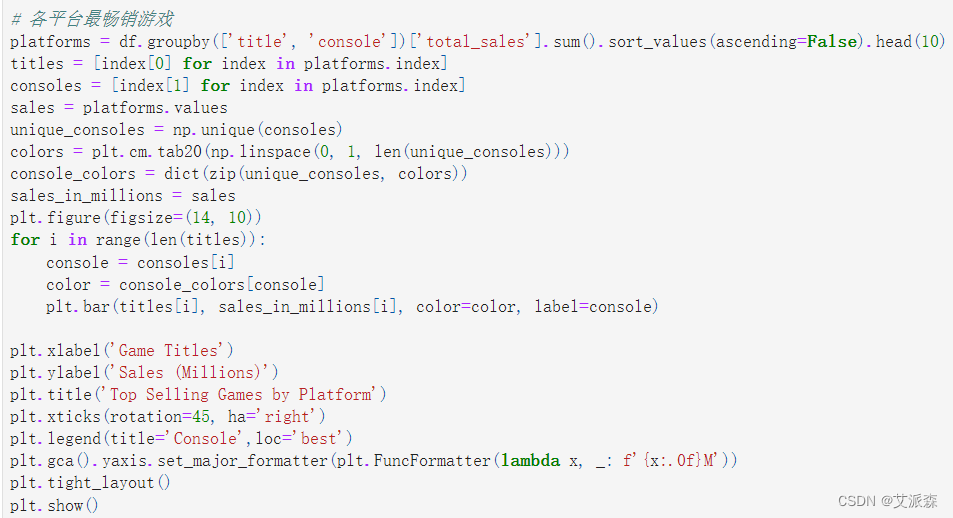
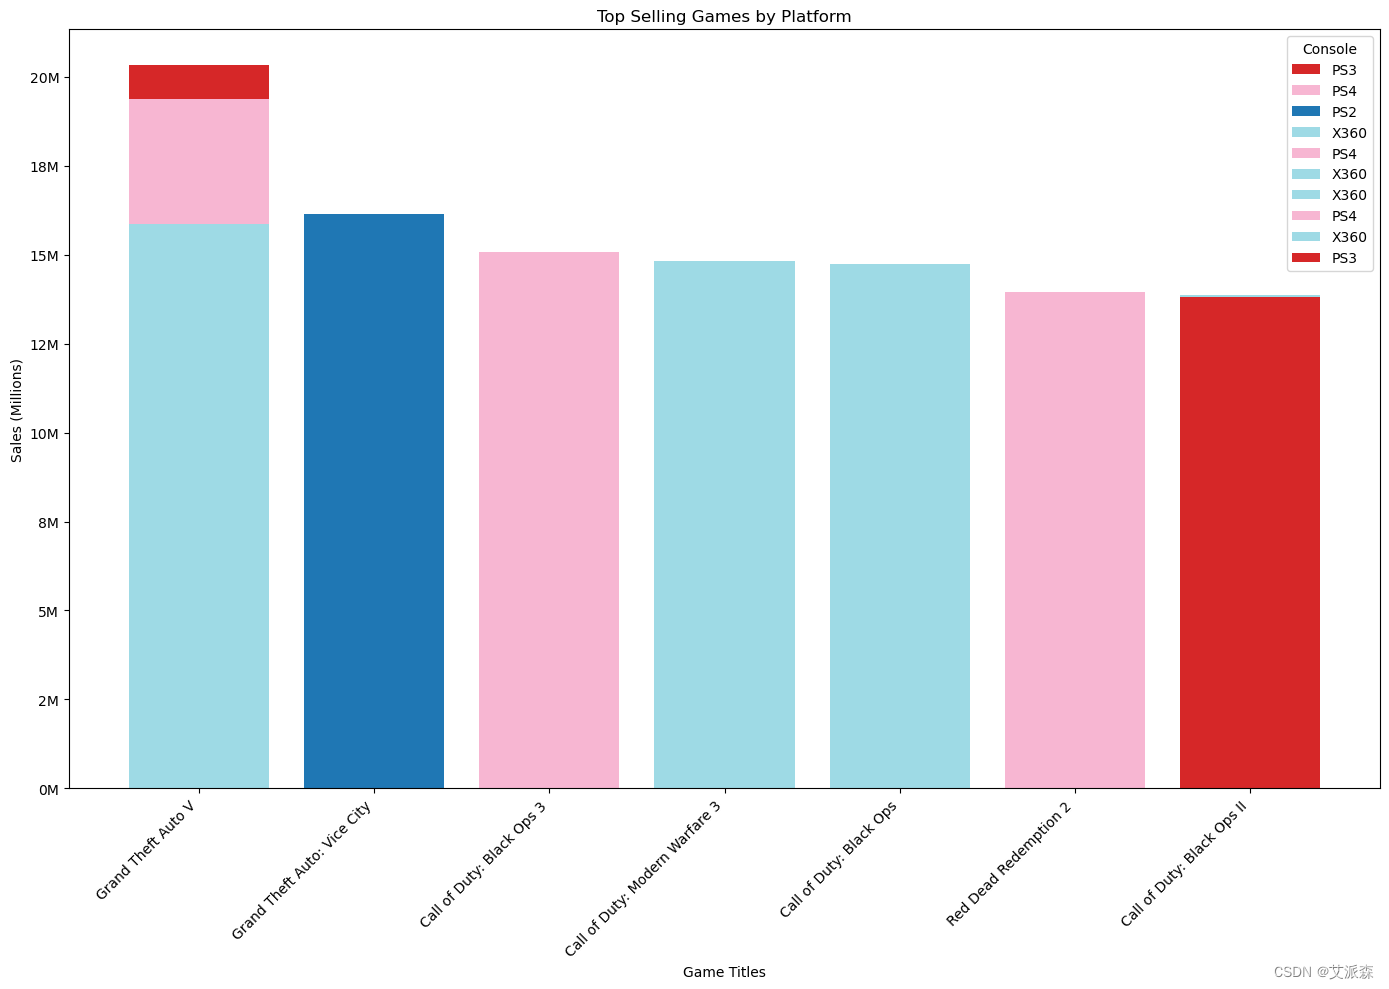
# 各平台最畅销游戏
platforms = df.groupby(['title', 'console'])['total_sales'].sum().sort_values(ascending=False).head(10)
titles = [index[0] for index in platforms.index]
consoles = [index[1] for index in platforms.index]
sales = platforms.values
unique_consoles = np.unique(consoles)
colors = plt.cm.tab20(np.linspace(0, 1, len(unique_consoles)))
console_colors = dict(zip(unique_consoles, colors))
sales_in_millions = sales
plt.figure(figsize=(14, 10))
for i in range(len(titles)):
console = consoles[i]
color = console_colors[console]
plt.bar(titles[i], sales_in_millions[i], color=color, label=console)
plt.xlabel('Game Titles')
plt.ylabel('Sales (Millions)')
plt.title('Top Selling Games by Platform')
plt.xticks(rotation=45, ha='right')
plt.legend(title='Console',loc='best')
plt.gca().yaxis.set_major_formatter(plt.FuncFormatter(lambda x, _: f'{x:.0f}M'))
plt.tight_layout()
plt.show()
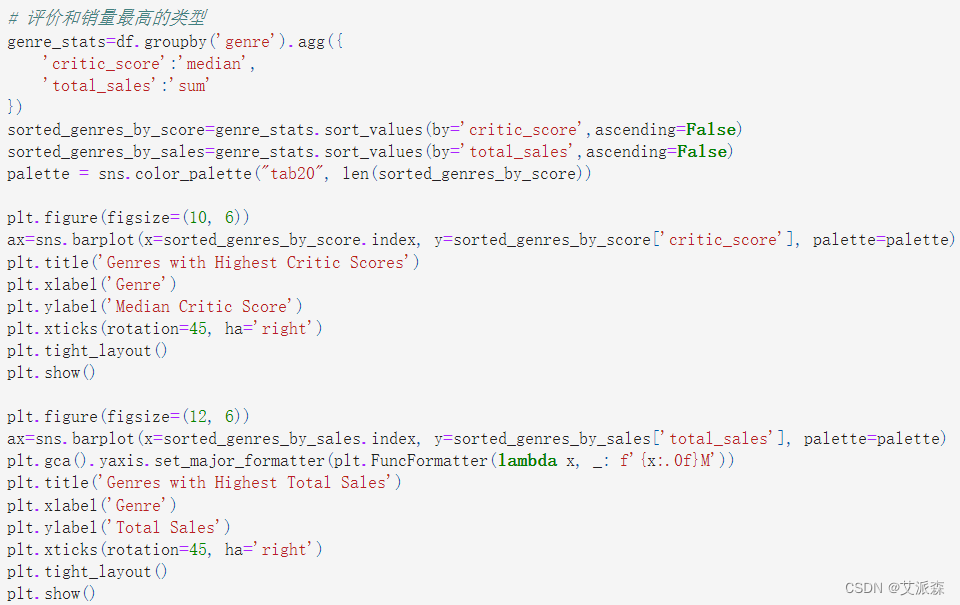
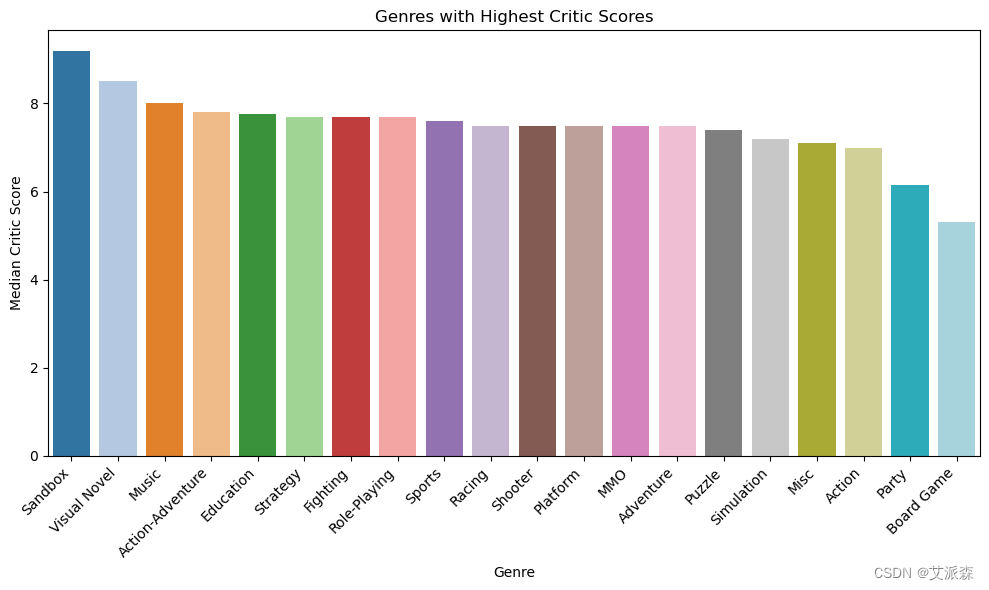
# 评价和销量最高的类型
genre_stats=df.groupby('genre').agg({
'critic_score':'median',
'total_sales':'sum'
})
sorted_genres_by_score=genre_stats.sort_values(by='critic_score',ascending=False)
sorted_genres_by_sales=genre_stats.sort_values(by='total_sales',ascending=False)
palette = sns.color_palette("tab20", len(sorted_genres_by_score))
plt.figure(figsize=(10, 6))
ax=sns.barplot(x=sorted_genres_by_score.index, y=sorted_genres_by_score['critic_score'], palette=palette)
plt.title('Genres with Highest Critic Scores')
plt.xlabel('Genre')
plt.ylabel('Median Critic Score')
plt.xticks(rotation=45, ha='right')
plt.tight_layout()
plt.show()
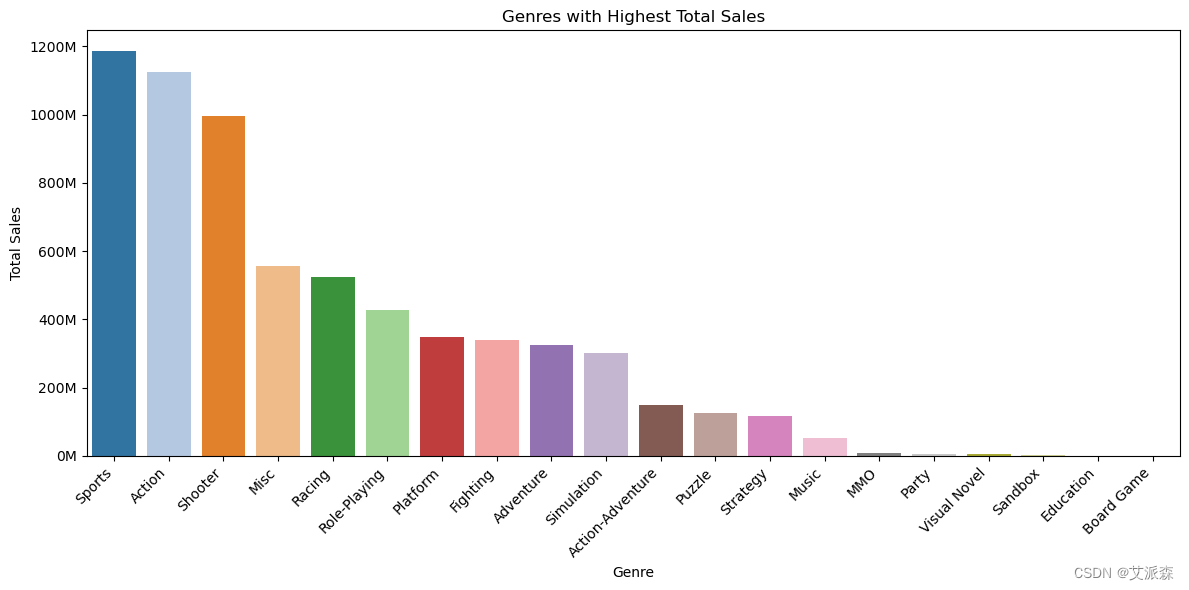
plt.figure(figsize=(12, 6))
ax=sns.barplot(x=sorted_genres_by_sales.index, y=sorted_genres_by_sales['total_sales'], palette=palette)
plt.gca().yaxis.set_major_formatter(plt.FuncFormatter(lambda x, _: f'{x:.0f}M'))
plt.title('Genres with Highest Total Sales')
plt.xlabel('Genre')
plt.ylabel('Total Sales')
plt.xticks(rotation=45, ha='right')
plt.tight_layout()
plt.show()
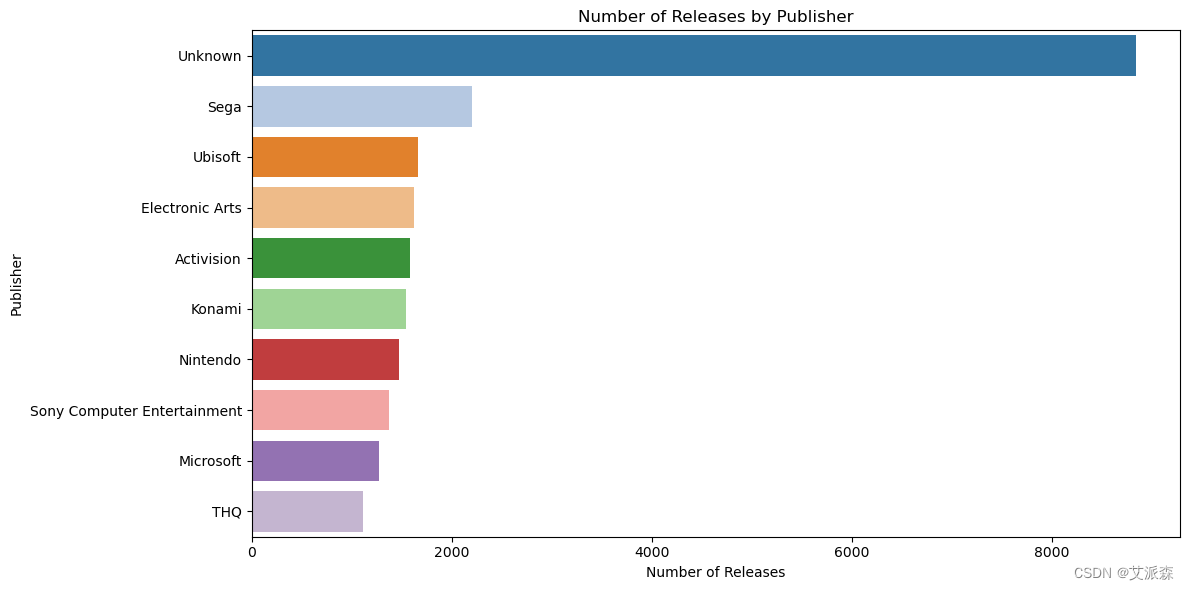
# 发行产品最多的发行商及其销售业绩
publisher_stats = df.groupby('publisher').agg({
'title': 'count',
'total_sales': 'sum'
}).reset_index()
# 按发布数量对发布者进行排序
sorted_publishers_by_num = publisher_stats.sort_values(by='title', ascending=False).head(10)
sorted_publishers_by_sales = publisher_stats.sort_values(by='total_sales', ascending=False).head(10)
palette = sns.color_palette("tab20", len(sorted_genres_by_score))
plt.figure(figsize=(12, 6))
ax=sns.barplot(x='title', y='publisher', data=sorted_publishers_by_num, palette=palette)
plt.title('Number of Releases by Publisher')
plt.xlabel('Number of Releases')
plt.ylabel('Publisher')
plt.tight_layout()
plt.show()
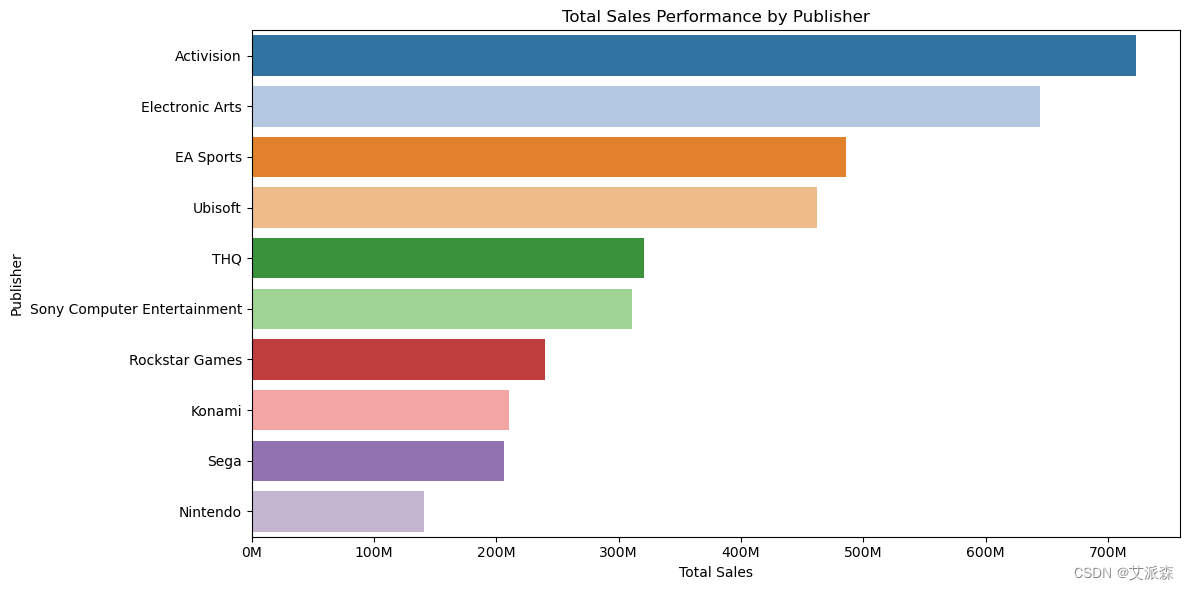
# 按出版商绘制销售业绩图
plt.figure(figsize=(12, 6))
ax=sns.barplot(x='total_sales', y='publisher', data=sorted_publishers_by_sales, palette=palette)
plt.gca().xaxis.set_major_formatter(plt.FuncFormatter(lambda x, _: f'{x:.0f}M'))
plt.title('Total Sales Performance by Publisher')
plt.xlabel('Total Sales')
plt.ylabel('Publisher')
plt.tight_layout()
plt.show()
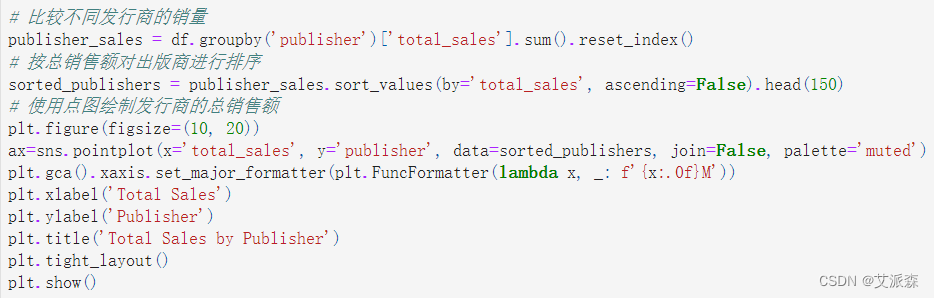
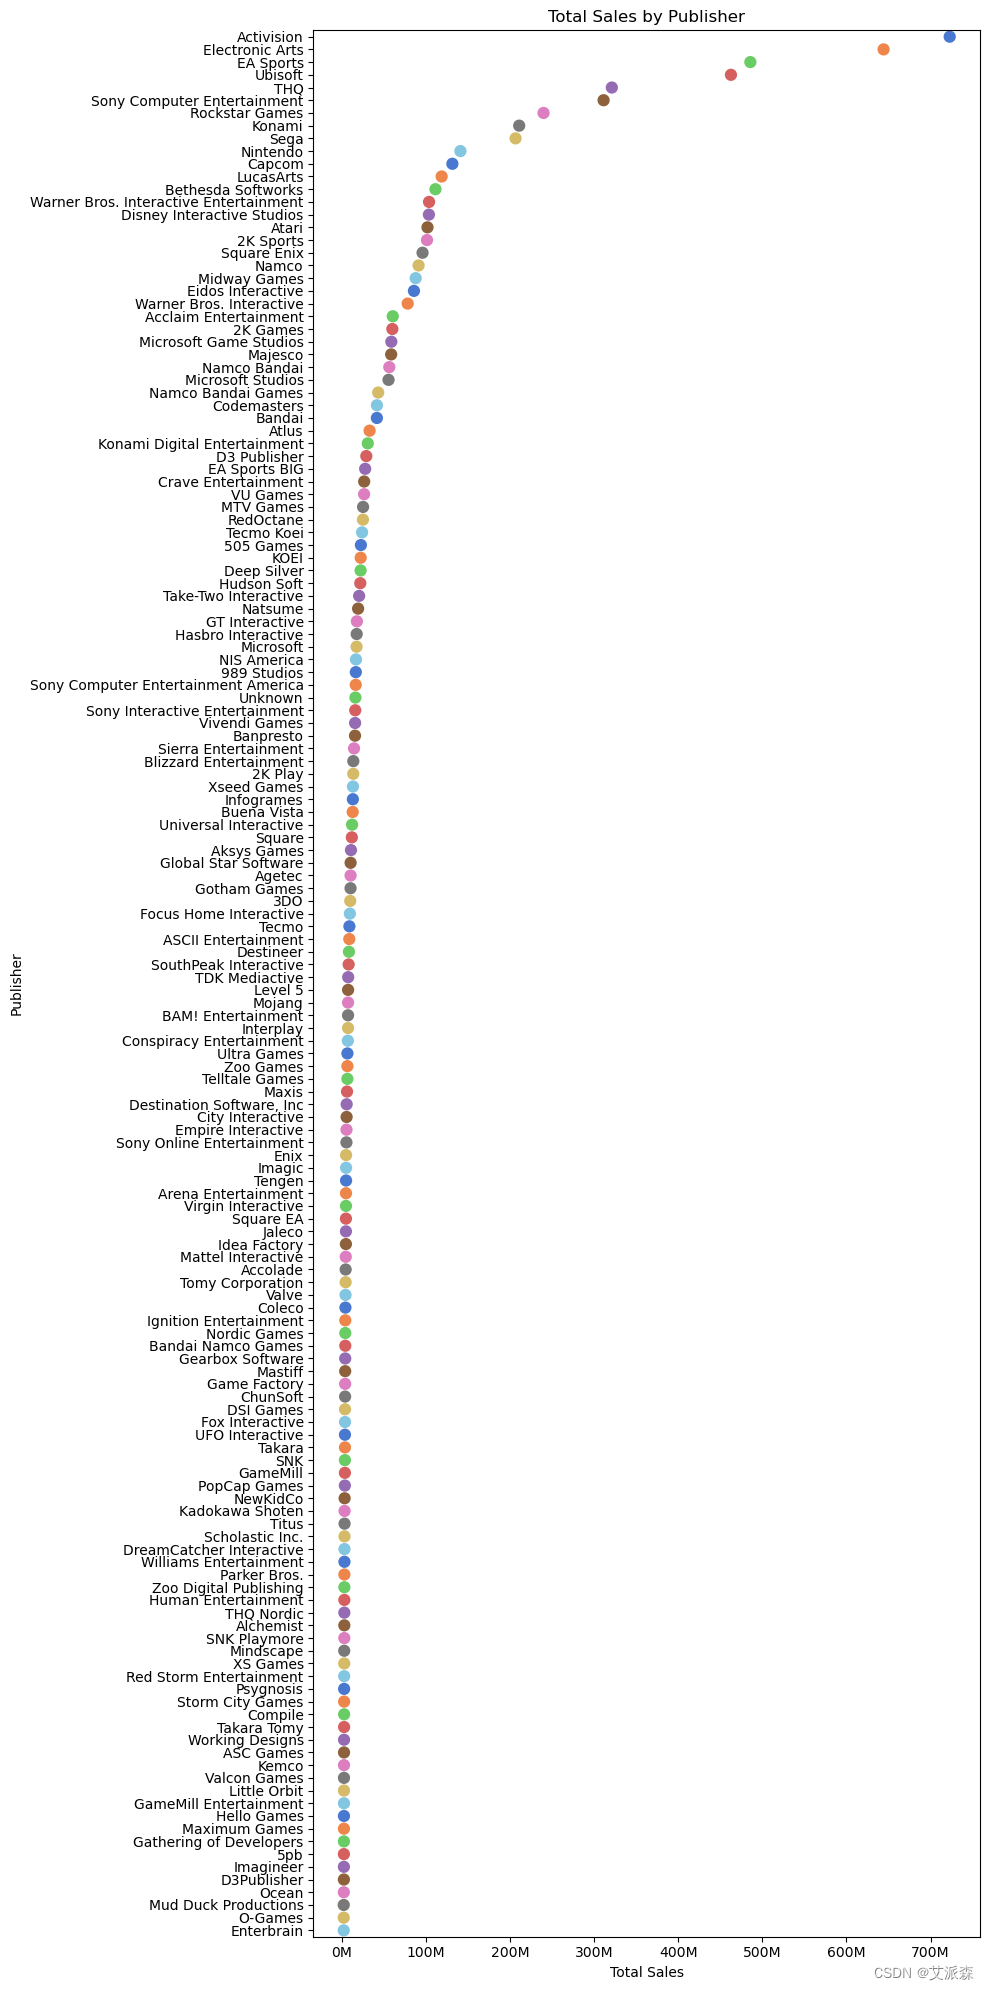
# 比较不同发行商的销量
publisher_sales = df.groupby('publisher')['total_sales'].sum().reset_index()
# 按总销售额对出版商进行排序
sorted_publishers = publisher_sales.sort_values(by='total_sales', ascending=False).head(150)
# 使用点图绘制发行商的总销售额
plt.figure(figsize=(10, 20))
ax=sns.pointplot(x='total_sales', y='publisher', data=sorted_publishers, join=False, palette='muted')
plt.gca().xaxis.set_major_formatter(plt.FuncFormatter(lambda x, _: f'{x:.0f}M'))
plt.xlabel('Total Sales')
plt.ylabel('Publisher')
plt.title('Total Sales by Publisher')
plt.tight_layout()
plt.show()
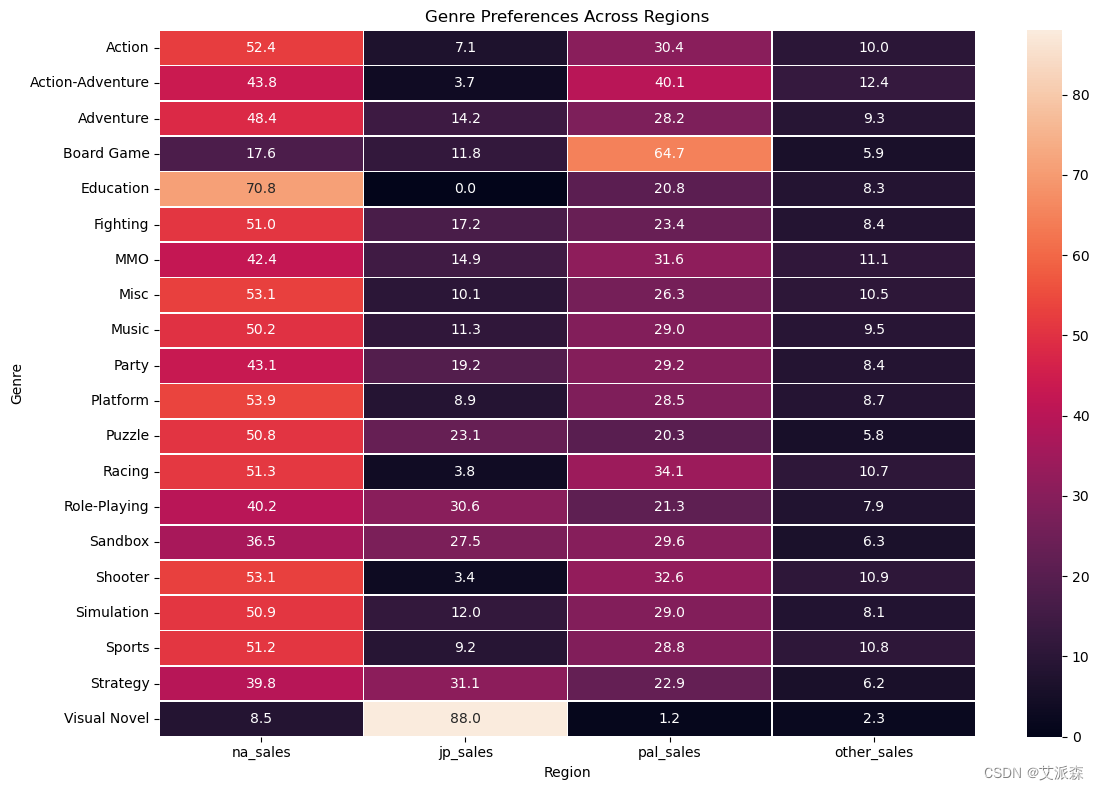
# 分析不同地区的类型偏好
genre_sales = df.groupby('genre')[['na_sales', 'jp_sales', 'pal_sales', 'other_sales']].sum()
genre_sales_normalized = genre_sales.div(genre_sales.sum(axis=1), axis=0) * 100
plt.figure(figsize=(12, 8))
sns.heatmap(genre_sales_normalized, cmap='rocket', annot=True, fmt='.1f', linewidths=.5)
plt.title('Genre Preferences Across Regions')
plt.xlabel('Region')
plt.ylabel('Genre')
plt.tight_layout()
plt.show()
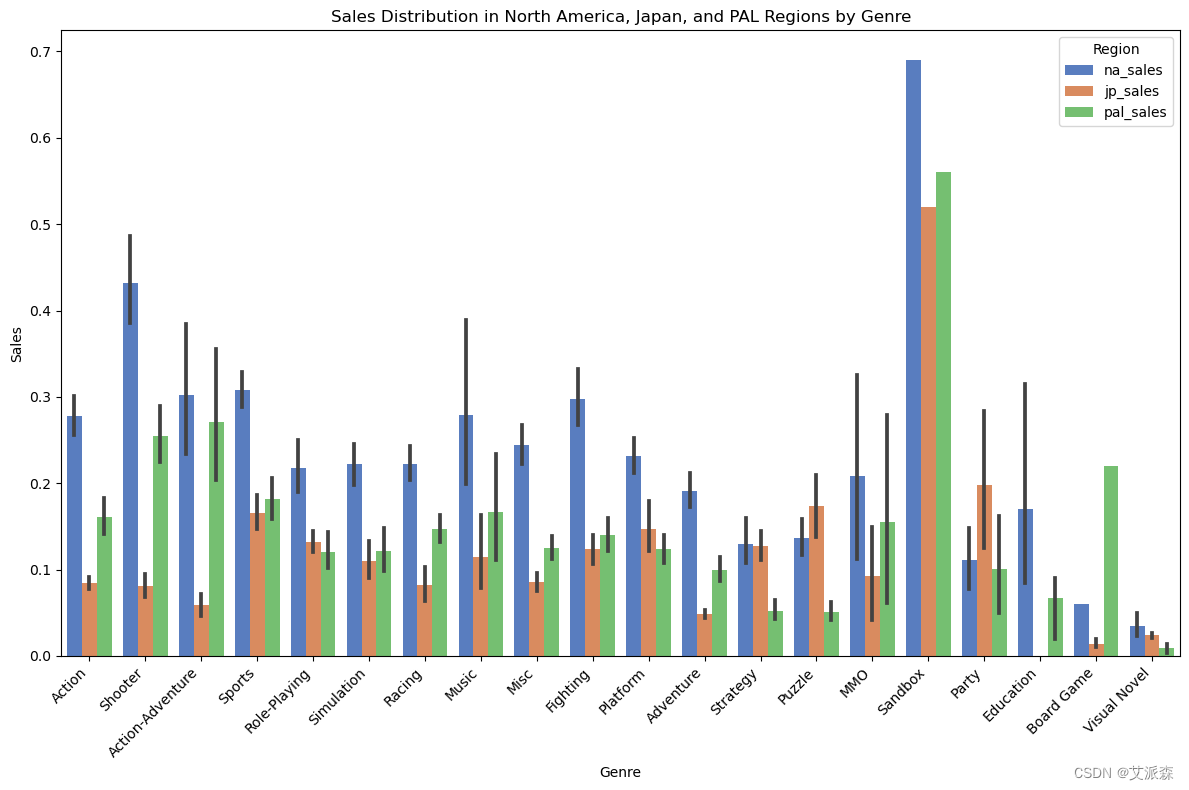
# 检查北美,日本和PAL地区的销售分布
sales_data = df[['genre', 'na_sales', 'jp_sales', 'pal_sales']]
sales_data_melted = sales_data.melt(id_vars='genre', var_name='region', value_name='sales')
plt.figure(figsize=(12, 8))
sns.barplot(data=sales_data_melted, x='genre', y='sales', hue='region', palette='muted')
plt.title('Sales Distribution in North America, Japan, and PAL Regions by Genre')
plt.xlabel('Genre')
plt.ylabel('Sales')
plt.xticks(rotation=45, ha='right')
plt.legend(title='Region', loc='upper right')
plt.tight_layout()
plt.show()
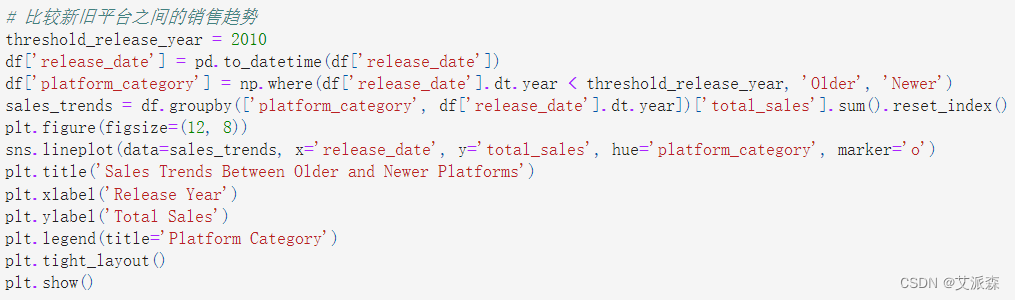
# 比较新旧平台之间的销售趋势
threshold_release_year = 2010
df['release_date'] = pd.to_datetime(df['release_date'])
df['platform_category'] = np.where(df['release_date'].dt.year < threshold_release_year, 'Older', 'Newer')
sales_trends = df.groupby(['platform_category', df['release_date'].dt.year])['total_sales'].sum().reset_index()
plt.figure(figsize=(12, 8))
sns.lineplot(data=sales_trends, x='release_date', y='total_sales', hue='platform_category', marker='o')
plt.title('Sales Trends Between Older and Newer Platforms')
plt.xlabel('Release Year')
plt.ylabel('Total Sales')
plt.legend(title='Platform Category')
plt.tight_layout()
plt.show()
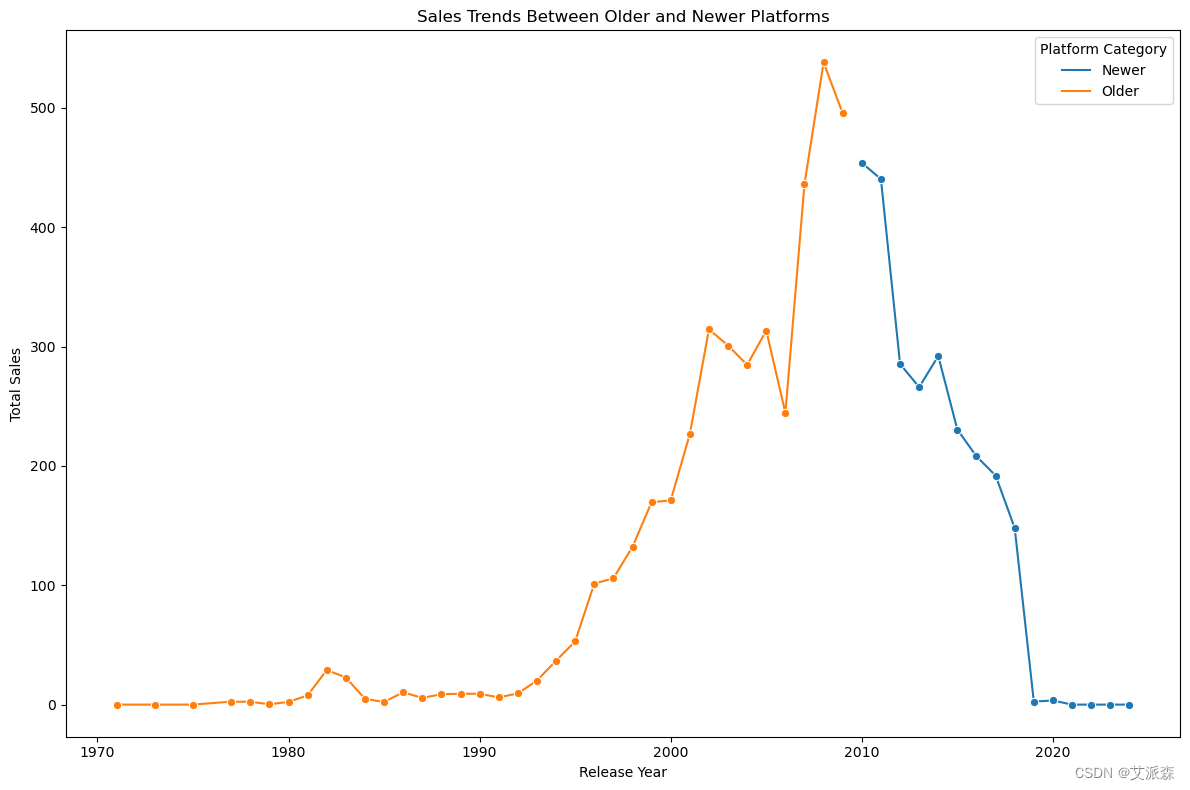
# 每款游戏平均销量最高的平台
average_sales_per_game = df.groupby('console')['total_sales'].mean().sort_values(ascending=False).head(20)
plt.figure(figsize=(10, 8))
sns.barplot(x=average_sales_per_game.values, y=average_sales_per_game.index, palette='viridis')
plt.xlabel('Average Sales per Game')
plt.ylabel('Platform')
plt.title('Average Sales per Game by Platform')
plt.tight_layout()
plt.show()
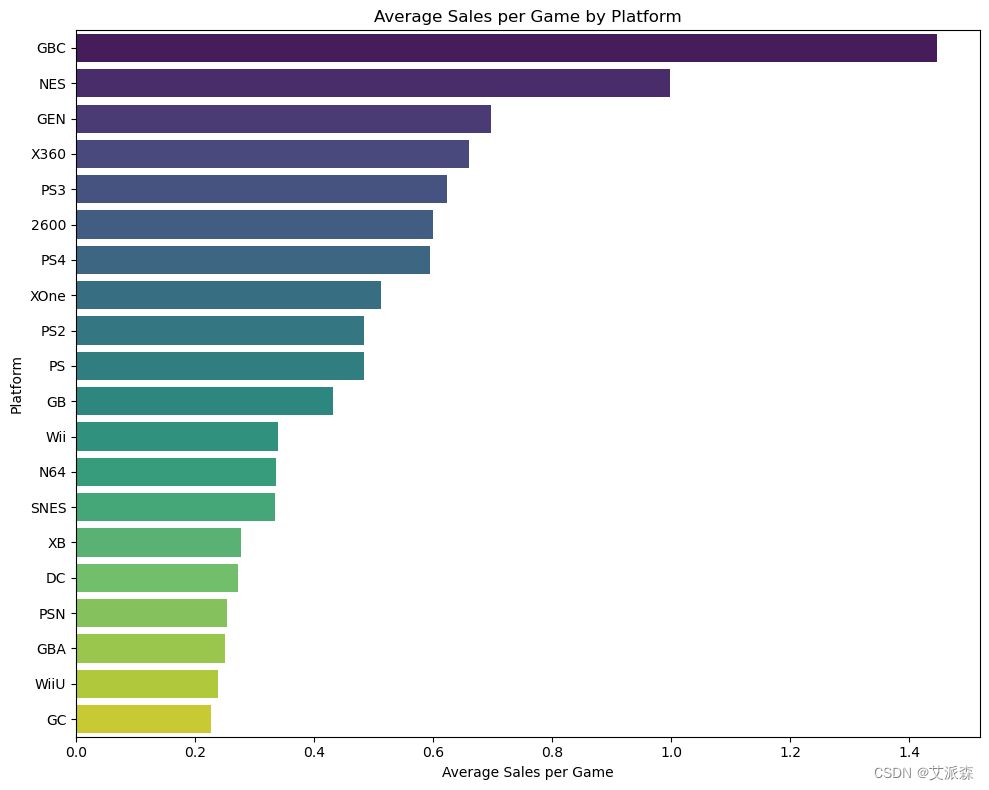
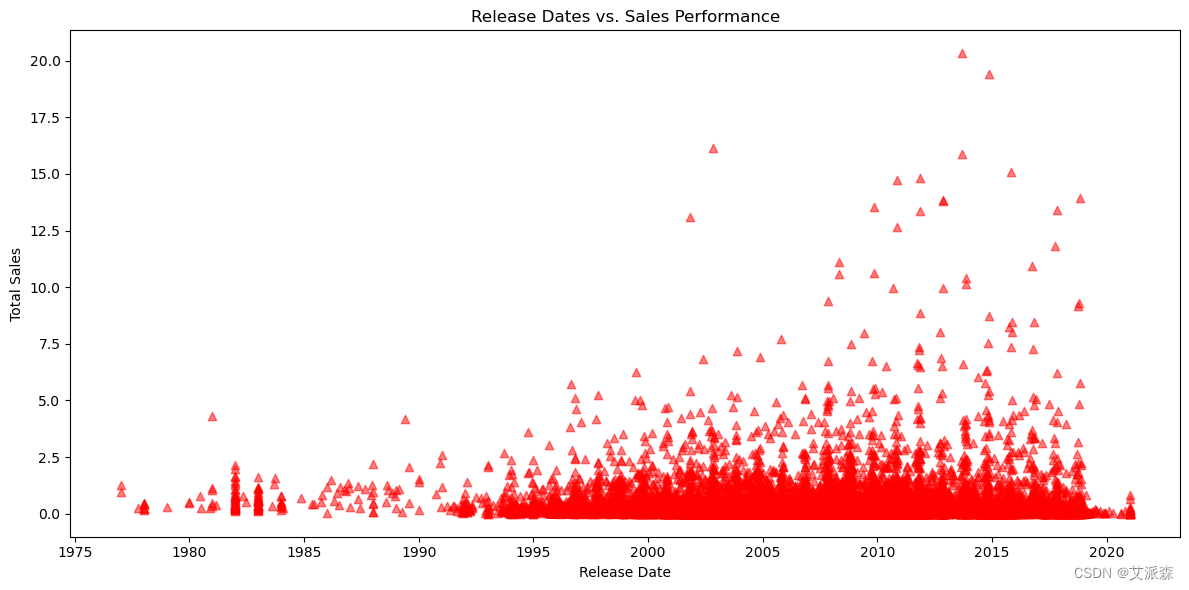
# 发行日期及影响
df['release_date'] = pd.to_datetime(df['release_date'])
plt.figure(figsize=(12, 6))
plt.scatter(df['release_date'], df['total_sales'], alpha=0.5,c='r',marker='^')
plt.title('Release Dates vs. Sales Performance')
plt.xlabel('Release Date')
plt.ylabel('Total Sales')
plt.tight_layout()
plt.show()
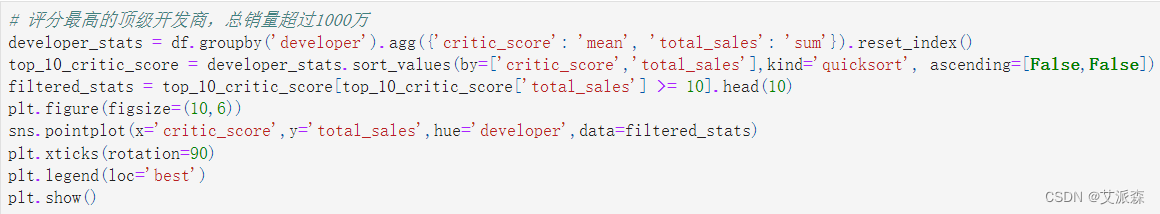
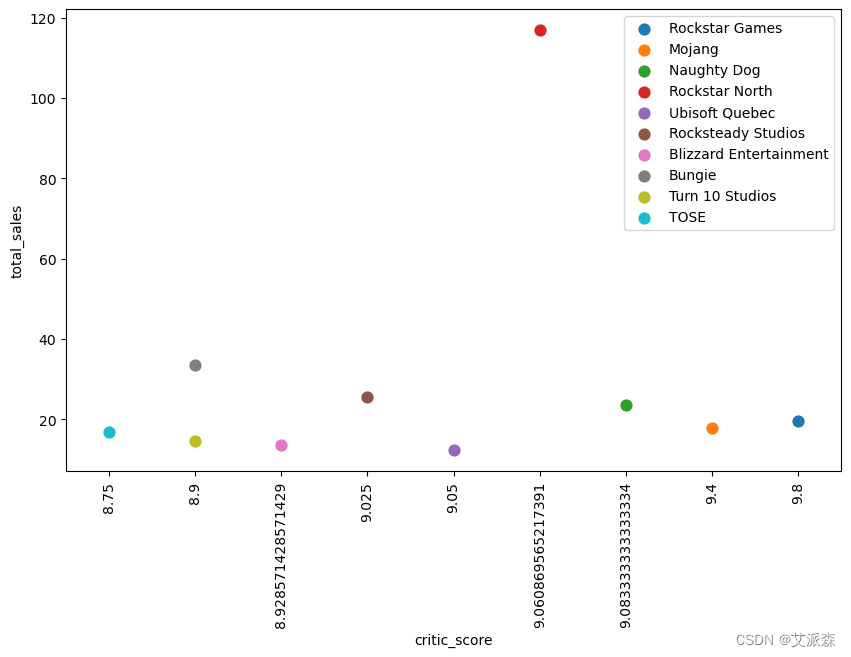
# 评分最高的顶级开发商,总销量超过1000万
developer_stats = df.groupby('developer').agg({'critic_score': 'mean', 'total_sales': 'sum'}).reset_index()
top_10_critic_score = developer_stats.sort_values(by=['critic_score','total_sales'],kind='quicksort', ascending=[False,False])
filtered_stats = top_10_critic_score[top_10_critic_score['total_sales'] >= 10].head(10)
plt.figure(figsize=(10,6))
sns.pointplot(x='critic_score',y='total_sales',hue='developer',data=filtered_stats)
plt.xticks(rotation=90)
plt.legend(loc='best')
plt.show()
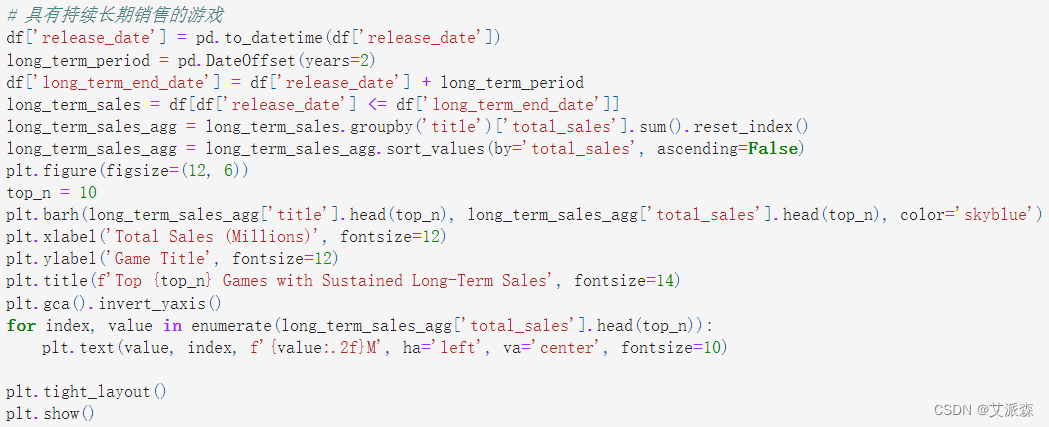
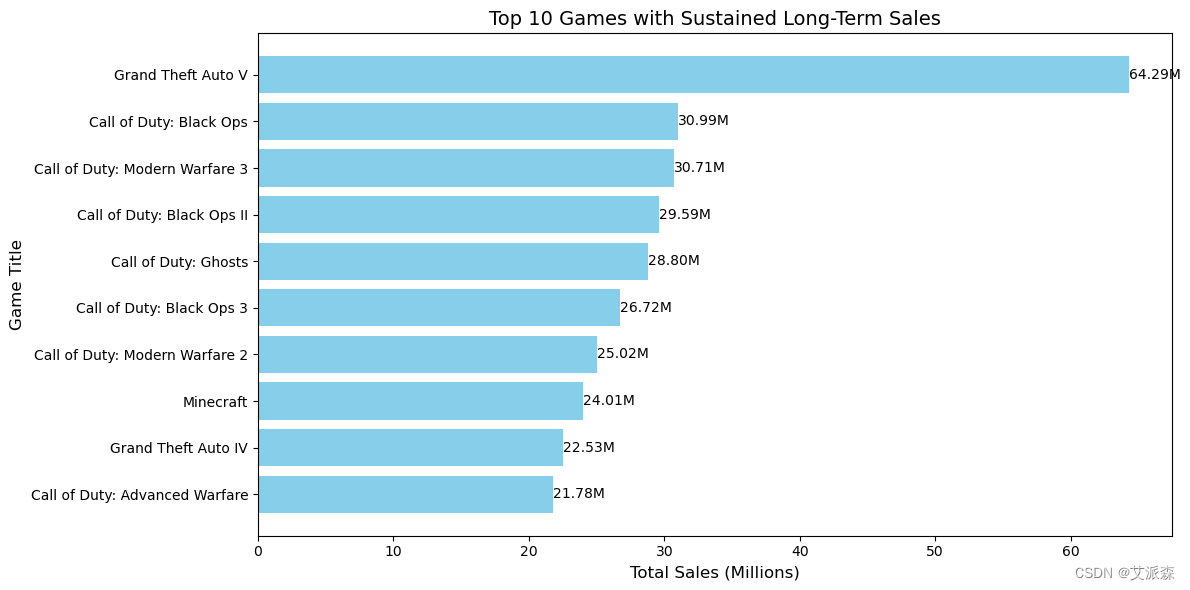
# 具有持续长期销售的游戏
df['release_date'] = pd.to_datetime(df['release_date'])
long_term_period = pd.DateOffset(years=2)
df['long_term_end_date'] = df['release_date'] + long_term_period
long_term_sales = df[df['release_date'] <= df['long_term_end_date']]
long_term_sales_agg = long_term_sales.groupby('title')['total_sales'].sum().reset_index()
long_term_sales_agg = long_term_sales_agg.sort_values(by='total_sales', ascending=False)
plt.figure(figsize=(12, 6))
top_n = 10
plt.barh(long_term_sales_agg['title'].head(top_n), long_term_sales_agg['total_sales'].head(top_n), color='skyblue')
plt.xlabel('Total Sales (Millions)', fontsize=12)
plt.ylabel('Game Title', fontsize=12)
plt.title(f'Top {top_n} Games with Sustained Long-Term Sales', fontsize=14)
plt.gca().invert_yaxis()
for index, value in enumerate(long_term_sales_agg['total_sales'].head(top_n)):
plt.text(value, index, f'{value:.2f}M', ha='left', va='center', fontsize=10)
plt.tight_layout()
plt.show()
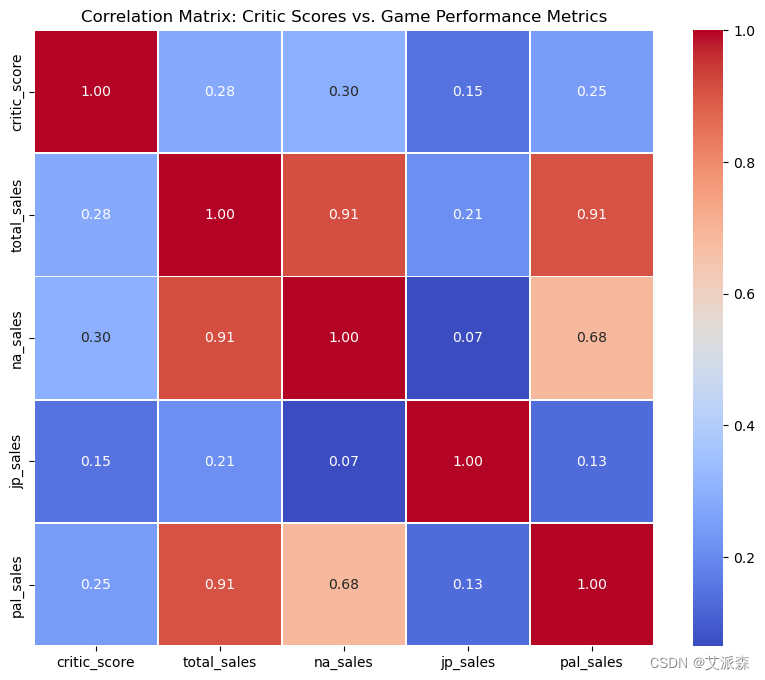
# 评论者评论对游戏表现的影响
df['release_date'] = pd.to_datetime(df['release_date'])
df['last_update'] = pd.to_datetime(df['last_update'])
correlation_matrix = df[['critic_score', 'total_sales', 'na_sales', 'jp_sales', 'pal_sales']].corr()
plt.figure(figsize=(10, 8))
sns.heatmap(correlation_matrix, annot=True, cmap='coolwarm', fmt=".2f", linewidths=.5)
plt.title('Correlation Matrix: Critic Scores vs. Game Performance Metrics')
plt.show()
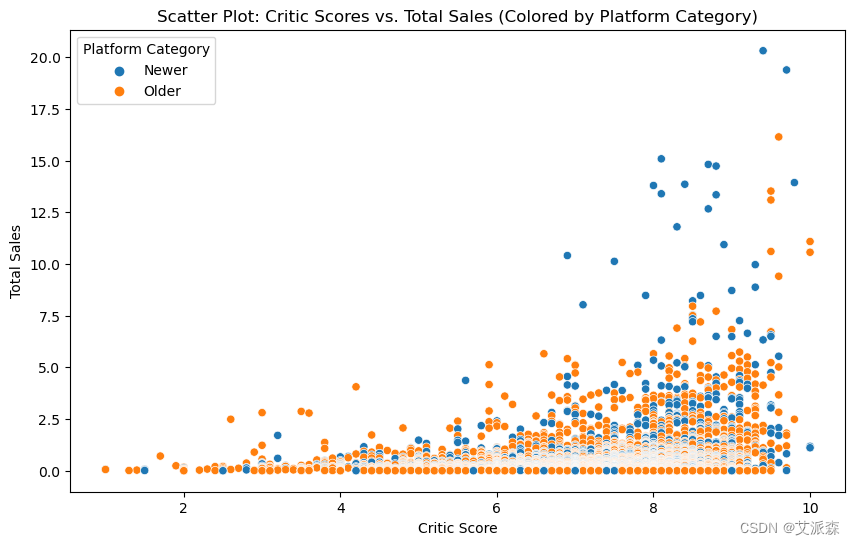
plt.figure(figsize=(10, 6))
sns.scatterplot(data=df, x='critic_score', y='total_sales', hue='platform_category')
plt.title('Scatter Plot: Critic Scores vs. Total Sales (Colored by Platform Category)')
plt.xlabel('Critic Score')
plt.ylabel('Total Sales')
plt.legend(title='Platform Category')
plt.show()
# 按类型分类的影评人评分
df_filtered_scores_genre = df[['critic_score', 'genre']].dropna()
plt.figure(figsize=(14, 8))
sns.boxplot(x='genre', y='critic_score', data=df_filtered_scores_genre, palette='pastel')
plt.title('Critic Scores by Genre')
plt.xlabel('Genre')
plt.ylabel('Critic Scores')
plt.xticks(rotation=45, ha='right')
plt.show()
资料获取,更多粉丝福利,关注下方公众号获取


 1万+
1万+

 被折叠的 条评论
为什么被折叠?
被折叠的 条评论
为什么被折叠?
 到【灌水乐园】发言


