


Special Plots(P3)
Logarithm Plots (对数图)
往图中添加网格,使用命令:set(gca,'XGrid','on');
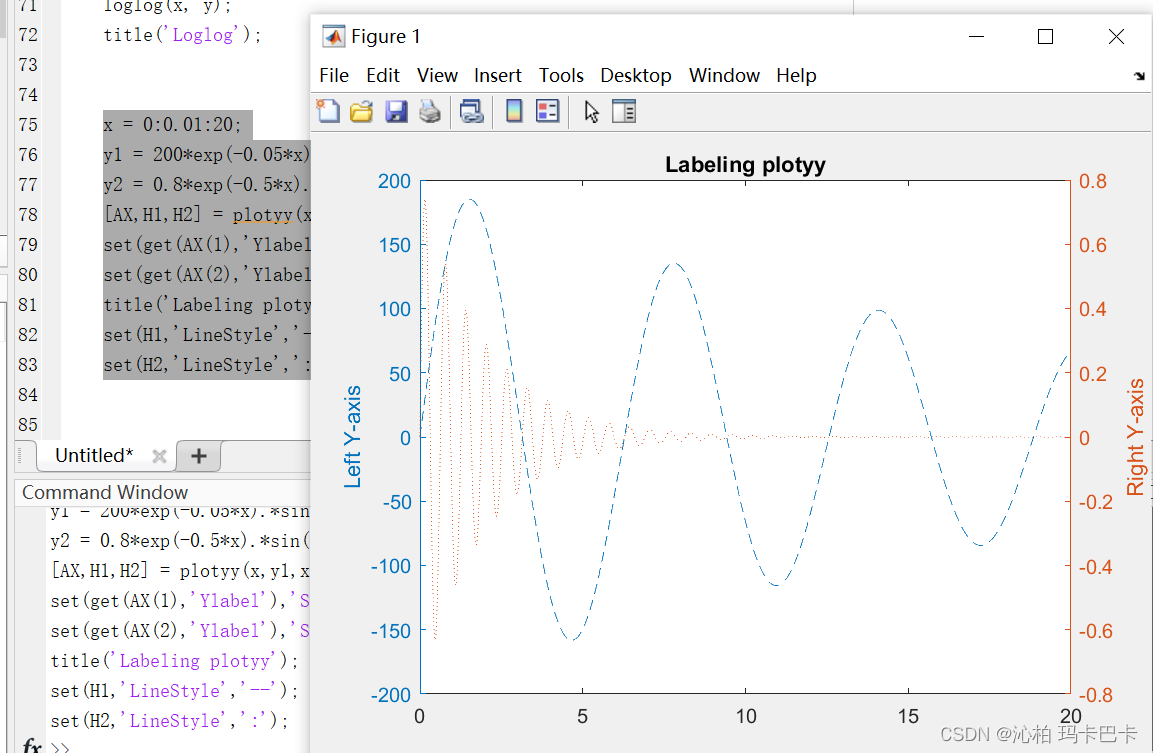
plotyy() 两个因变量
Histogram 统计图 (整体 )
Bar Charts 柱状图(单独)3D
Stacked and Horizontal Bar Charts 堆叠条形图和水平条形图
Pie Charts 饼状图
Polar Chart 极坐标图
Stairs and Stem Charts 楼梯和茎干图 ·
Boxplot and Error Bar 箱线图和误差线
fill() 用fill 来填充颜色,一些文字内容
Color Space 有编码对照颜色
Visualizing Data as An Image:将数据可视化为图像:imagesc()
Color Bar and Scheme 色条与配色
colorbar; 显示色条 colormap([Name]); 热图
Built-in Colormaps内置色彩映射表
3D Plots`
plot3() 三维
More 3D Line Plots
Principles for 3D Surface Plots 由x,y,z 组成的三维空间里,三
 最低0.47元/天 解锁文章


 3494
3494


 被折叠的 条评论
为什么被折叠?
被折叠的 条评论
为什么被折叠?
 到【灌水乐园】发言


