


目录
中国地图数据可视化以及34个省级行政区地图显示,包括23个省、5个自治区、4个直辖市、2个特别行政区。(均可缩放、动态)。
iii.使用ECharts图表库中的echarts.on方法来监听点击事件
一、首先搭建一个Vue3项目:
电脑上安装node.js
网址:https://nodejs.org/zh-cn/
全局安装vue脚手架
npm i @vue/cli -g
查看node版本:npm -v
查看脚手架版本: npm -V
二、创建vue项目
Vue create 项目名称
把cmd的路径切换到指定路径下 vue create 项目名
i.选择项目配置模板,选择第三项自主选择项目所需的配置

ii.选择项目配置选项 勾选所需要的模块
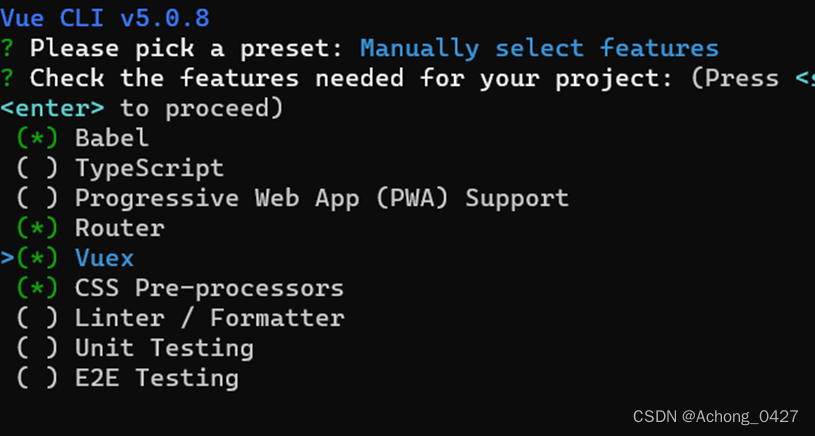
iii.选择想要开始项目的Vue.js版本 选择 3.x

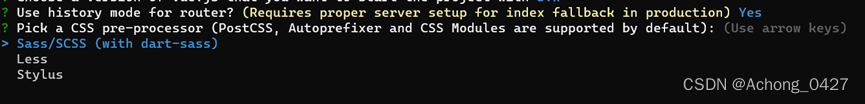
iv.是否用history模式来创建路由 直接回车默认项目
v.选择CSS 预处理类型 选择Sass/Scss
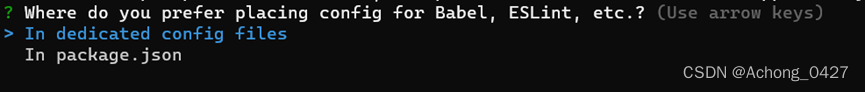
vi.项目的配置文件 (1.独立文件 2.package.json中)
vii.是否保存配置当做后续项目的可选配置,选择不保存(enter回车确认开始创建)

三、运行项目
i.把cmd的路径切换到项目名下
ii.npm run serve 启动项目
四、初始化项目
i.删除src文件夹下的cpmponents文件夹下的Helloword.vue文件。
ii.删除vuews下的两个.vue文件。
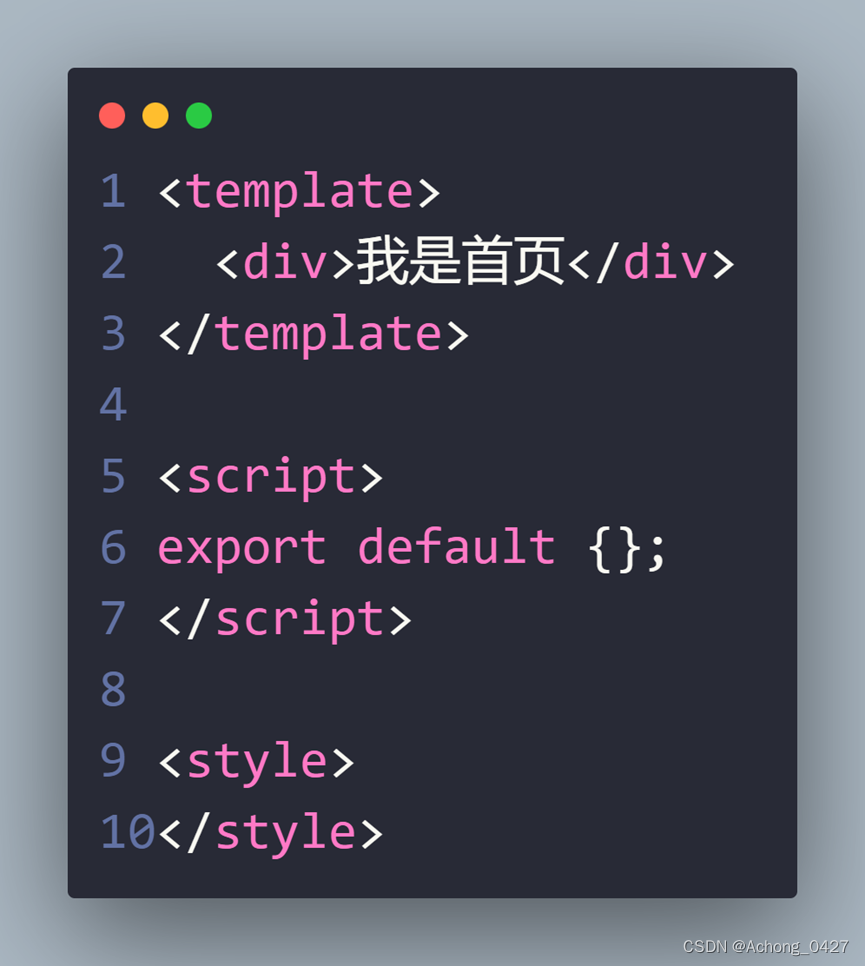
iii.在views中新建页面文件 homePage.vue文件。
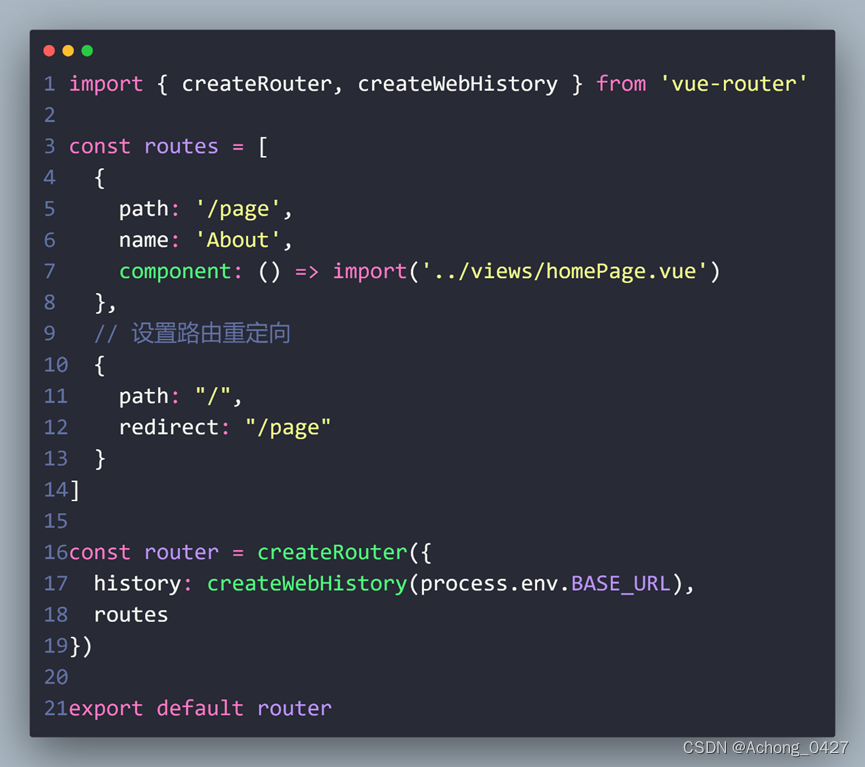
iv.修改router下的index.js配置路由文件。
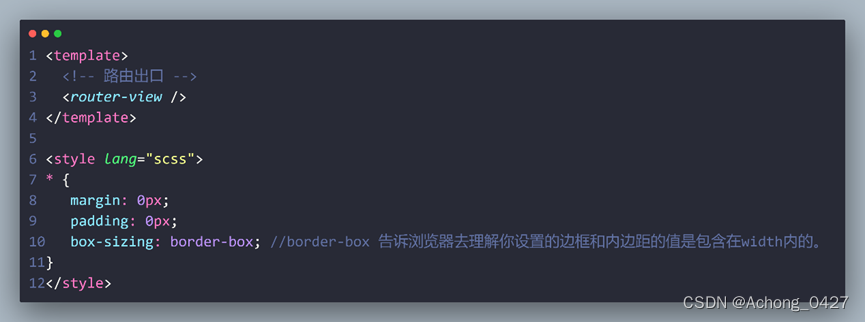
v.修改根组件默认显示内容与初始化项目样式
五、项目基本结构有:
-
中国地图数据可视化以及34个省级行政区地图显示,包括23个省、5个自治区、4个直辖市、2个特别行政区。(均可缩放、动态)。
-
世界汉化地图数据可视化(可缩放,动态)。
-
Echarts框架中的一些常用图表用于数据可视化。
-
用到的技术栈
i. vue3.0+vue-router4.0+axios
ii. flex布局
iii.SCSS
iv. rem屏幕适配
v. echarts5.0
vi.Element Plus/icons-vue
六、技术栈分析:
1、flexible.js:
i.npm i -S lib-flexible 进行下载
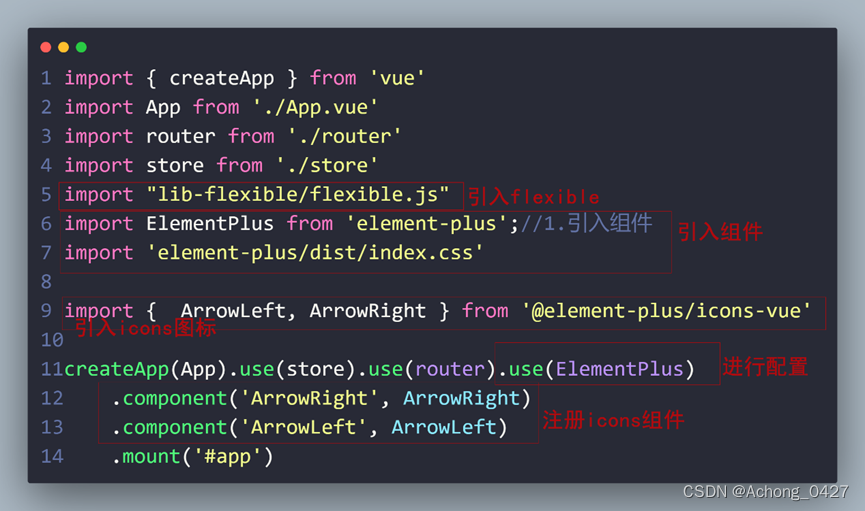
ii.在main.js中进行配置:
iii.修改flexible配置:
默认情况下只会在540px分辨率一下生效所以需要根据我们的项目分辨率进行调整。
在node_module/lib-flexible/flexible.js中修改代码如下:
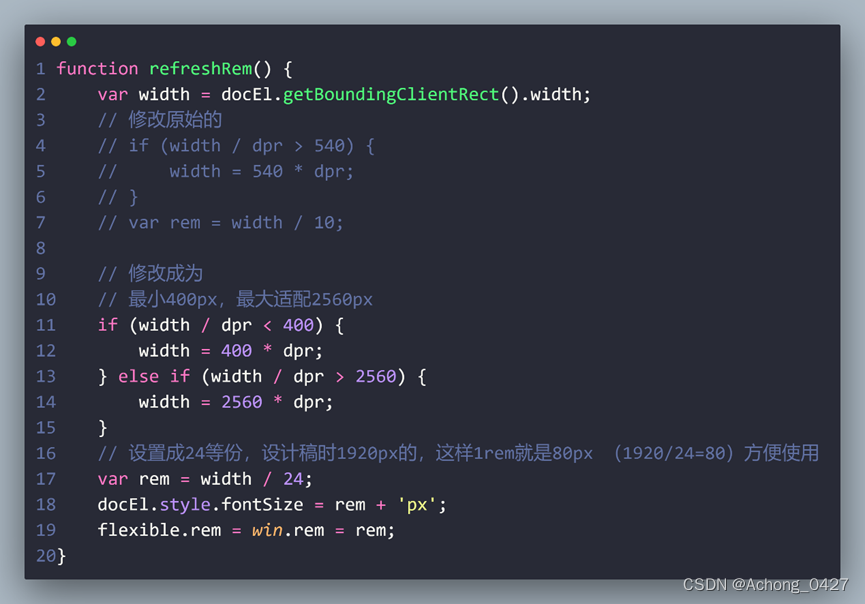
重启项目打开浏览器调试器,在浏览器大小改变的时候在html根节点上会自动设置一个font-size。
配置cssrem插件:在vscode扩展中搜索cssrem插件最新名字叫px to rem & rpx 安装到vscode中点击右下角设置修改Root Font Size(基准font-size) 配置项为80即可:

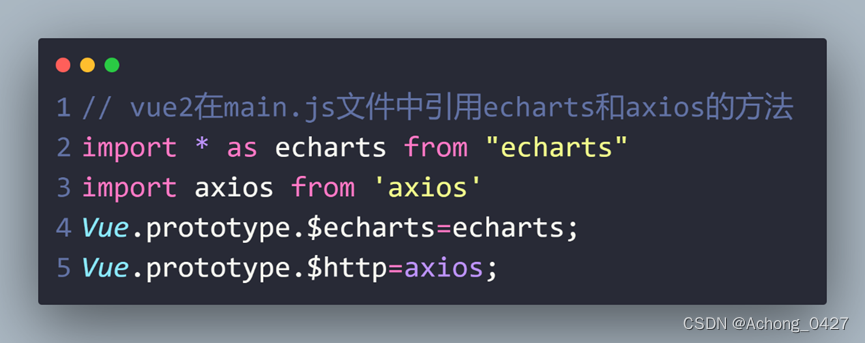
2、全局设置Echarts和axios
i.下载 npm install --save echarts
ii.下载 npm install --save axios
iii.Vue2.0中通过在main.js中引用echarts和axios,但在vue3.0中就不一样了,vue3中使用provide/inject依赖注入,将替代vue2中在原型链上挂载一些属性。


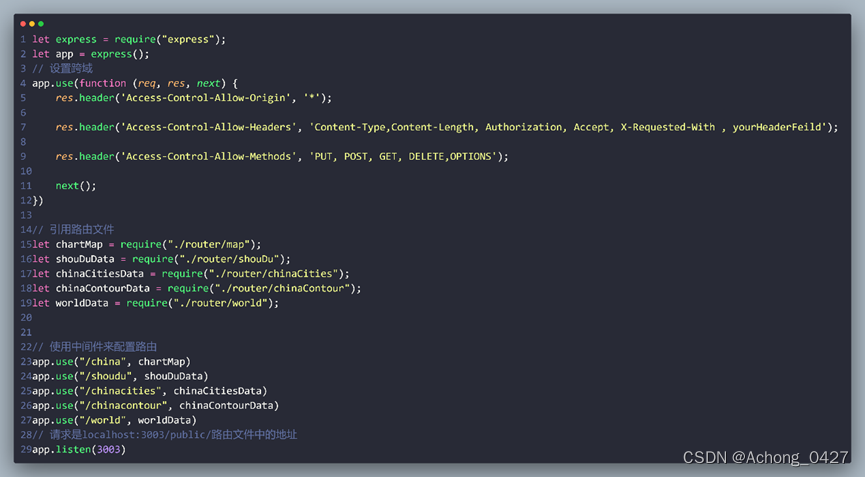
3、后台接口创建express
i.下载 npm install express
初始化:npm i
启动: node app.js

ii.在server文件夹下创建public文件夹用来容纳数据,引用并且把数据返回给前台。
iii.创建一个文件夹 server 在其中创建app.js与router文件夹容来容纳代码。
iv.在router下创建文件分别容纳对应的接口
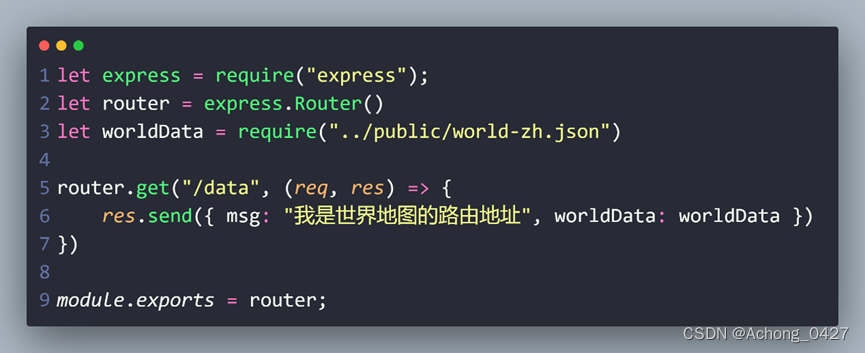
v.在app.js下引用使用刚才创建的内容
七、项目中的部分代码
1.中国地图代码
<template>
  <div>
    <div id="china"></div>
  </div>
</template>

<script>
import axios from "axios";
//在后代中引入inject
import { inject, onMounted, reactive } from "vue";
import { useRouter } from "vue-router";
export default {
  setup() {
    let $echarts = inject("echarts");
    let chinaData = reactive({});
    // 设置数据请求方法 不要忘了return
    async function getState() {
      chinaData = await axios.get("/china/data");
    }
    let router = useRouter();
    onMounted(() => {
      getState().then(() => {
        let echarts = $echarts.init(document.getElementById("china"));
        $echarts.registerMap("chinaMap", chinaData.data.chinaData);
        echarts.setOption({
          geo: {
            map: "chinaMap",
            // roam: true,
            zoom: 1.2,
            // color: "#0099ff",
            label: {
              //地图上显示文字提示信息
              show: true,
              color: "#fff",
              // areaColor: "#0099ff",
              // backgroundColor: "#0099ff",

              fontSize: 10, //字体大小
            },
            // center: [108.956239, 34.268309],
            itemStyle: {
              areaColor: "#0099ff",
            },
            emphasis: {
              focus: "self",
              itemStyle: {
                areaColor: "#fff",
                borderColor: "#00ffff",
                shadowColor: "rgba(230,130,70,0.5)",
                shadowBlur: 30,
              },
            },
          },
          title: {
            text: "城市销量",
            left: "center",
            textStyle: {
              color: "#fff",
              fontSize: 20,
              textShadowBlur: 10,
              textShadowColor: "#33ffff",
            },
          },
          tooltip: {
            trigger: "item",
          },
          // visualMap: {
          //   type: "continuous",
          //   min: 100,
          //   max: 5000,
          //   calculable: true,
          //   inRange: {
          //     color: ["#50a3ba", "#eac736", "#d94e5d"],
          //   },
          //   textStyle: {
          //     color: "#fff",
          //   },
          // },
          series: [
            {
              type: "effectScatter",
              symbolSize: 30,
              coordinateSystem: "geo",
              data: [
                { name: "呼和浩特", value: [111.652017, 40.861428] },
                // { name: "上海", value: [121.48, 31.22, 8675] },
                // { name: "深圳", value: [114.07, 22.62, 2461] },
                // { name: "广州", value: [113.23, 23.16, 187] },
              ],
              rippleEffect: {
                //涟漪特效相关配置。
                number: 2, //波纹的数量。
                scale: 4, //动画中波纹的最大缩放比例
              },

              itemStyle: {
                color: "#f99",
              },
            }, // 也可以绘制点效果
            {
              symbolSize: 10,
              type: "effectScatter",
              coordinateSystem: "geo",  series坐标系类型

              data: [
                { name: "桂林市", value: [110.193673, 25.244837] },
                { name: "成都市", value: [104.077344, 30.582476] },
                { name: "拉萨市", value: [91.180183, 29.660491] },
                { name: "丽江市", value: [100.237061, 26.861173] },
                { name: "深圳市", value: [114.001167, 22.681125] },
                { name: "湛江市", value: [110.363254, 21.276185] },
                { name: "上海", value: [121.481115, 31.238893] },
              ],
              rippleEffect: {
                number: 2,
                scale: 5,
              },
              itemStyle: {
                color: "#f00",
              },
            },
          ],
        });
        echarts.on("click", function (params) {
          if (params.componentType === "geo") {
            if (params.componentIndex === 0) {
              var clickedProvince = params.name;
              console.log(clickedProvince);
              if (provinceRoutes.hasOwnProperty(clickedProvince)) {
                router.push({ name: provinceRoutes[clickedProvince] });
              }
            }
          }
        });
        const provinceRoutes = {
          广东: "guangdong",
          广西: "guangxi",
          安徽: "anhui",
          新疆: "xinjiang",
          西藏: "xizang",
          内蒙古: "neimenggu",
          宁夏: "ningxia",
          青海: "qinghai",
          甘肃: "gansu",
          四川: "sichuan",
          重庆: "chongqing",
          云南: "yunnan",
          贵州: "guizhou",
          陕西: "shanxi",
          山西: "shanx",
          湖南: "hunan",
          湖北: "hubei",
          河南: "henan",
          河北: "hebei",
          山东: "shandong",
          北京: "beijing",
          天津: "tianjin",
          江西: "jiangxi",
          福建: "fujian",
          台湾: "taiwan",
          香港: "xianggang",
          澳门: "aomen",
          海南: "hainan",
          浙江: "zhejiang",
          上海: "shanghai",
          江苏: "jiangsu",
          辽宁: "liaoning",
          吉林: "jilin",
          黑龙江: "heilongjiang",
        };
      });
    });
    return {
      getState,
      chinaData,
    };
  },
};
</script>

<style lang="scss">
#china {
  height: 10rem;
}
</style>
2.图表一代码
<template>
  <div>
    <div class="chart" id="onechart">图表的容器</div>
  </div>
</template>

<script>
import { inject, onMounted } from "vue";
export default {
  setup() {
    let $echarts = inject("echarts");
    onMounted(() => {
      let echarts = $echarts.init(document.getElementById("onechart"));
      echarts.setOption({
        title: {
          text: "图表1",
          left: "center",
          textStyle: {
            color: "#fff",
            fontSize: 20,
            textShadowBlur: 10,
            textShadowColor: "#33ffff",
          },
        },
        tooltip: {
          trigger: "axis",
        },
        grid: {
          left: "1%",
          right: "10%",
          top: "9%",
          bottom: "1%",
          containLabel: "true",
        },
        toolbox: {
          iconStyle: {
            // color: "#fff",
            borderColor: "#fff",
          },
          show: true,
          feature: {
            // dataZoom: {
            //   yAxisIndex: "none",
            // },
            dataView: { readOnly: false },
            magicType: { type: ["line"] },
            restore: {},
            saveAsImage: {},
          },
        },
        xAxis: {
          type: "value",
          axisLine: {
            lineStyle: {
              color: "#fff",
            },
          },
        },
        yAxis: {
          type: "category",
          axisLine: {
            lineStyle: {
              color: "#fff",
            },
          },
          data: [
            "洗碗机",
            "空调",
            "烤箱",
            "微波炉",
            "电视机",
            "洗衣机",
            "冰箱",
          ],
        },
        series: {
          type: "bar",

          data: [1827, 342, 541, 1347, 2431, 876, 1578],
          itemStyle: {
            barBorderRadius: [0, 30, 30, 0],
            color: new $echarts.graphic.LinearGradient(0, 0, 1, 0, [
              {
                offset: 0,
                color: "#005eaa",
              },
              {
                offset: 0.5,
                color: "#339ca8",
              },
              {
                offset: 1,
                color: "#cda819",
              },
            ]),
          },
        },
      });
    });
  },
};
</script>

<style lang="scss">
#onechart {
  height: 5.125rem;
}
</style>
3.周销图代码
<template>
  <div>
    <div id="echarttwo"></div>
  </div>
</template>

<script>
import { inject, onMounted } from "vue";
export default {
  setup() {
    let $echarts = inject("echarts");
    onMounted(() => {
      let echarts = $echarts.init(document.getElementById("echarttwo"));
      echarts.setOption({
        color: ["#80FFA5", "#00DDFF", "#37A2FF", "#FF0087", "#FFBF00"],
        title: {
          text: "周销图",

          left: "center",
          textStyle: {
            color: "#fff",
            fontSize: 20,
            textShadowBlur: 10,
            textShadowColor: "#33ffff",
          },
        },
        tooltip: {
          trigger: "axis",
          axisPointer: {
            type: "cross",
            label: {
              backgroundColor: "#6a7985",
            },
          },
        },
        legend: {
          top: "9%",
          data: ["服装", "数码", "家电", "家居", "日化"],
        },
        toolbox: {
          iconStyle: {
            // color: "#fff",
            borderColor: "#fff",
          },
          show: true,
          feature: {
            // dataZoom: {
            //   yAxisIndex: "none",
            // },
            dataView: { readOnly: false },
            magicType: { type: ["bar"] },
            restore: {},
            saveAsImage: {},
          },
        },
        grid: {
          top: "25%",
          left: "1%",
          right: "4%",
          bottom: "1%",
          containLabel: true,
        },
        xAxis: [
          {
            type: "category",
            boundaryGap: false,
            data: [
              "星期一",
              "星期二",
              "星期三",
              "星期四",
              "星期五",
              "星期六",
              "星期天",
            ],
            axisLine: {
              lineStyle: {
                color: "#fff",
              },
            },
          },
        ],
        yAxis: [
          {
            type: "value",
            axisLine: {
              lineStyle: {
                color: "#fff",
              },
            },
          },
        ],
        series: [
          {
            name: "服装",
            type: "line",
            stack: "Total",
            smooth: true,
            lineStyle: {
              width: 0,
            },
            showSymbol: false,
            areaStyle: {
              opacity: 0.8,
              color: new $echarts.graphic.LinearGradient(0, 0, 0, 1, [
                {
                  offset: 0,
                  color: "rgb(128, 255, 165)",
                },
                {
                  offset: 1,
                  color: "rgb(1, 191, 236)",
                },
              ]),
            },
            emphasis: {
              focus: "series",
            },
            data: [140, 232, 101, 264, 90, 340, 250],
          },
          {
            name: "数码",
            type: "line",
            stack: "Total",
            smooth: true,
            lineStyle: {
              width: 0,
            },
            showSymbol: false,
            areaStyle: {
              opacity: 0.8,
              color: new $echarts.graphic.LinearGradient(0, 0, 0, 1, [
                {
                  offset: 0,
                  color: "rgb(0, 221, 255)",
                },
                {
                  offset: 1,
                  color: "rgb(77, 119, 255)",
                },
              ]),
            },
            emphasis: {
              focus: "series",
            },
            data: [120, 282, 111, 234, 220, 340, 310],
          },
          {
            name: "家电",
            type: "line",
            stack: "Total",
            smooth: true,
            lineStyle: {
              width: 0,
            },
            showSymbol: false,
            areaStyle: {
              opacity: 0.8,
              color: new $echarts.graphic.LinearGradient(0, 0, 0, 1, [
                {
                  offset: 0,
                  color: "rgb(55, 162, 255)",
                },
                {
                  offset: 1,
                  color: "rgb(116, 21, 219)",
                },
              ]),
            },
            emphasis: {
              focus: "series",
            },
            data: [320, 132, 201, 334, 190, 130, 220],
          },
          {
            name: "家居",
            type: "line",
            stack: "Total",
            smooth: true,
            lineStyle: {
              width: 0,
            },
            showSymbol: false,
            areaStyle: {
              opacity: 0.8,
              color: new $echarts.graphic.LinearGradient(0, 0, 0, 1, [
                {
                  offset: 0,
                  color: "rgb(255, 0, 135)",
                },
                {
                  offset: 1,
                  color: "rgb(135, 0, 157)",
                },
              ]),
            },
            emphasis: {
              focus: "series",
            },
            data: [220, 402, 231, 134, 190, 230, 120],
          },
          {
            name: "日化",
            type: "line",
            stack: "Total",
            smooth: true,
            lineStyle: {
              width: 0,
            },
            showSymbol: false,
            label: {
              show: true,
              position: "top",
            },
            areaStyle: {
              opacity: 0.8,
              color: new $echarts.graphic.LinearGradient(0, 0, 0, 1, [
                {
                  offset: 0,
                  color: "rgb(255, 191, 0)",
                },
                {
                  offset: 1,
                  color: "rgb(224, 62, 76)",
                },
              ]),
            },
            emphasis: {
              focus: "series",
            },
            data: [220, 302, 181, 234, 210, 290, 150],
          },
        ],
      });
    });
  },
};
</script>

<style>
#echarttwo {
  height: 5.125rem;
}
</style>
4.库存统计代码
<template>
  <div>
    <div id="echartthree"></div>
  </div>
</template>

<script>
import { inject, onMounted } from "vue";
export default {
  setup() {
    let $echarts = inject("echarts");
    onMounted(() => {
      let echarts = $echarts.init(document.getElementById("echartthree"));
      echarts.setOption({
        title: {
          text: "库存统计",
          left: "center",
          textStyle: {
            color: "#fff",
            fontSize: 20,
            textShadowBlur: 10,
            textShadowColor: "#33ffff",
          },
        },
        toolbox: {
          iconStyle: {
            // color: "#fff",
            borderColor: "#fff",
          },
          show: true,
          feature: {
            // dataZoom: {
            //   yAxisIndex: "none",
            // },
            dataView: { readOnly: false },
            restore: {},
            saveAsImage: {},
          },
        },

        legend: {
          orient: "horizontal",
          // width: ".1rem",
          // itemGap: "0.01rem",
          top: "bottom",
        },
        tooltip: {
          show: true,
        },
        series: {
          type: "pie",
          data: [
            { value: 567, name: "服饰" },
            { value: 123, name: "数码" },
            { value: 324, name: "家电" },
            { value: 89, name: "家居" },
            { value: 453, name: "日化" },
            { value: 767, name: "熟食" },
          ],
          roseType: "area",
          center: ["50%", "45%"],
          radius: [10, 100],
          itemStyle: {
            borderRadius: 10,
          },
        },
      });
    });
  },
};
</script>

<style>
#echartthree {
  height: 5.125rem;
}
</style>
5.库存统计图代码
<template>
  <div>
    <div id="echartfour"></div>
  </div>
</template>

<script>
import { inject, onMounted } from "vue";
export default {
  setup() {
    let $echarts = inject("echarts");
    onMounted(() => {
      let echarts = $echarts.init(document.getElementById("echartfour"));
      echarts.setOption({
        title: {
          text: "库存统计图",
          left: "center",
          textStyle: {
            color: "#fff",
            fontSize: 20,
            textShadowBlur: 10,
            textShadowColor: "#33ffff",
          },
        },
        toolbox: {
          iconStyle: {
            // color: "#fff",
            borderColor: "#fff",
          },
          show: true,
          feature: {
            // dataZoom: {
            //   yAxisIndex: "none",
            // },
            dataView: { readOnly: false },
            magicType: { type: ["line"] },
            restore: {},
            saveAsImage: {},
          },
        },
        tooltip: {
          type: "axis",
        },
        grid: {
          left: "1%",
          bottom: "1%",
          right: "3%",
          containLabel: "true",
        },
        legend: {
          top: "10%",
        },
        xAxis: {
          type: "category",
          data: [
            "星期一",
            "星期二",
            "星期三",
            "星期四",
            "星期五",
            "星期六",
            "星期天",
          ],
          axisLine: {
            lineStyle: {
              color: "#fff",
            },
          },
        },
        yAxis: {
          type: "value",
          axisLine: {
            lineStyle: {
              color: "#fff",
            },
          },
        },

        series: [
          {
            name: "服装",
            type: "bar",
            data: [320, 502, 401, 334, 390, 430, 720],
            stack: "total",
            label: {
              show: true,
            },
            emphasis: {
              focus: true,
            },
          },
          {
            name: "数码",
            type: "bar",
            data: [234, 564, 443, 234, 754, 430, 321],
            stack: "total",
            label: {
              show: true,
            },
            emphasis: {
              focus: true,
            },
          },
          {
            name: "家电",
            type: "bar",
            data: [220, 321, 335, 534, 390, 330, 310],
            stack: "total",
            label: {
              show: true,
            },
            emphasis: {
              focus: true,
            },
          },
          {
            name: "家居",
            type: "bar",
            data: [269, 212, 491, 368, 341, 330, 410],
            stack: "total",
            label: {
              show: true,
            },
            emphasis: {
              focus: true,
            },
          },
          {
            name: "日化",
            type: "bar",
            data: [820, 832, 901, 934, 1290, 1330, 1320],
            stack: "total",
            label: {
              show: true,
            },
            emphasis: {
              focus: true,
            },
          },
        ],
      });
    });
  },
};
</script>

<style lang="scss">
#echartfour {
  height: 5.125rem;
}
</style>
6.柱状图代码
<template>
  <div>
    <div id="one">你好呀</div>
  </div>
</template>

<script>
import { inject, onMounted } from "vue";
export default {
  setup() {
    let $echarts = inject("echarts");
    onMounted(() => {
      let echarts = $echarts.init(document.getElementById("one"));
      let xData = ["美食", "数码", "日化", "蔬菜", "熟食"];
      let yData = [88, 120, 70, 210, 50];
      echarts.setOption({
        title: {
          text: "柱形图",
          left: "center",
          textStyle: {
            color: "#fff",
            textShadowBlur: 10,
            textShadowColor: "#33ffff",
          },
        },
        toolbox: {
          iconStyle: {
            borderColor: "#fff",
          },
          show: true,
          feature: {
            dataView: { readOnly: false },
            magicType: { type: ["line"] },
            restore: {},
            saveAsImage: {},
          },
        },
        grid: {
          // show: true,
          left: "1%",
          right: "12%",
          bottom: "1%",
          containLabel: true,
        },
        tooltip: {
          trigger: "axis",
        },
        // legend: {
        //   top: "6%",
        // },

        xAxis: {
          type: "category",
          data: xData,
          axisLine: {
            lineStyle: {
              color: "#fff",
            },
          },
        },
        yAxis: {
          value: "value",
          axisLine: {
            lineStyle: {
              color: "#fff",
            },
          },
        },
        series: [
          {
            name: "销量",
            type: "bar",
            data: yData,
            barWidth: 25,

            itemStyle: {
              // normal: {
              //   barBorderRadius: [20, 20, 0, 0],
              //   color: function (parmas) {
              //     let colorList = [
              //       "#ff2355",
              //       "#cc22cc",
              //       "#0000ff",
              //       "#00ff00",
              //       "#22aa00",
              //     ];
              //     return colorList[parmas.dataIndex];
              //   },
              // },

              barBorderRadius: [10, 10, 0, 0],
              color: new $echarts.graphic.LinearGradient(0, 1, 0, 0, [
                {
                  offset: 0,
                  color: "#ff09ff",
                },
                {
                  offset: 0.5,
                  color: "#00ff22",
                },
                {
                  offset: 1,
                  color: "#44ffbb",
                },
              ]),
            },
            markPoint: {
              data: [
                {
                  type: "max",
                  name: "最大值",
                  label: { color: "#000" },
                },
                {
                  type: "min",
                  name: "最小值",
                  label: { color: "#000" },
                },
              ],
            },
            markLine: {
              data: [
                {
                  type: "average",
                  name: "平均值",
                },
              ],
            },
          },
        ],
      });
    });
  },
};
</script>

<style>
#one {
  height: 5.125rem;
}
</style>
7.饼状图代码
<template>
  <div>
    <div id="two"></div>
  </div>
</template>

  <script>
import { inject, onMounted } from "vue";
export default {
  setup() {
    let $echarts = inject("echarts");
    onMounted(() => {
      let echarts = $echarts.init(document.getElementById("two"));
      let data = [
        {
          value: 69,
          name: "美食",
        },
        {
          value: 150,
          name: "日化",
        },
        {
          value: 100,
          name: "数码",
        },
        {
          value: 120,
          name: "家电",
        },
      ];
      echarts.setOption({
        title: {
          text: "饼状图",
          left: "center",
          textStyle: {
            color: "#fff",
            textShadowBlur: 10,
            textShadowColor: "#33ffff",
          },
        },
        toolbox: {
          iconStyle: {
            borderColor: "#fff",
          },
          show: true,
          feature: {
            dataView: { readOnly: false },
            saveAsImage: {},
          },
        },
        // grid: {
        // },
        tooltip: {
          trigger: "item",
        },
        legend: {
          left: "left",
          orient: "vertical",
        },

        // xAxis: {
        //   type: "value",
        //   data: [],
        // },
        // yAxis: {
        //   value: "category",
        //   data: [],
        // },
        series: [
          {
            name: "销量统计",
            type: "pie",
            data,
            radius: ["40%", "80%"],
            roseType: true,
            label: {
              position: "inside",
            },
            itemStyle: {
              color: function (parmas) {
                let colorList = ["#ff0000", "#00ff00", "#0000ff", "#00ffaa"];
                return colorList[parmas.dataIndex];
              },
              // normal: {
              //   color: new $echarts.graphic.LinearGradient(0, 0, 1, 0, [
              //     // {
              //     //   offset: 0,
              //     //   color: "#ff0000",
              //     // },
              //     {
              //       offset: 0.4,
              //       color: "#00ff00",
              //     },
              //     // {
              //     //   offset: 0.7,
              //     //   color: "#0000ff",
              //     // },
              //     {
              //       offset: 1,
              //       color: "#ff08ff",
              //     },
              //   ]),
              // },
            },
          },
        ],
      });
    });
  },
};
</script>

  <style>
#two {
  height: 5.125rem;
}
</style>
8.多条折线图代码
<template>
  <div>
    <div id="three">你好呀</div>
  </div>
</template>

  <script>
import { inject, onMounted } from "vue";
export default {
  setup() {
    let $echarts = inject("echarts");
    onMounted(() => {
      let echarts = $echarts.init(document.getElementById("three"));
      let xData = [
        "星期一",
        "星期二",
        "星期三",
        "星期四",
        "星期五",
        "星期六",
        "星期天",
      ];
      let yDataA = [55, 66, 77, 88, 99, 58, 100];
      let yDataB = [15, 20, 12, 15, 30, 35, 40];
      let yDataC = [23, 56, 46, 26, 50, 20, 50];
      let yDataD = [46, 23, 45, 65, 34, 89, 53];

      echarts.setOption({
        title: {
          text: "多条折线图",
          left: "center",
          textStyle: {
            color: "#fff",
            textShadowBlur: 10,
            textShadowColor: "#33ffff",
          },
        },
        grid: {
          show: true,
          left: "1%",
          bottom: "1%",
          right: "6%",
          containLabel: true,
        },
        toolbox: {
          iconStyle: {
            borderColor: "#fff",
          },
          feature: {
            dataView: { readOnly: false },
            magicType: { type: ["bar", "line"] },
            restore: {},
            saveAsImage: {},
          },
        },
        tooltip: {
          trigger: "axis",
        },
        legend: {
          top: "10%",
        },

        xAxis: {
          type: "category",
          data: xData,
          axisLine: {
            lineStyle: {
              color: "#fff",
            },
          },
        },
        yAxis: {
          value: "value",
          // boundaryGap: "false",
          // show: "true",
          axisLine: {
            lineStyle: {
              color: "#fff",
            },
          },
        },
        series: [
          {
            name: "美食",
            type: "line",
            data: yDataA,
            smooth: true,
            areaStyle: {},
            showSymbol: false,

            lineStyle: {
              width: 0,
            },
            stack: "num",
            emphasis: {
              focus: "series",
            },
          },
          {
            name: "家电",
            type: "line",
            data: yDataB,
            smooth: true,
            areaStyle: {},
            showSymbol: false,

            lineStyle: {
              width: 0,
            },
            stack: "num",
            emphasis: {
              focus: "series",
            },
          },
          {
            name: "日化",
            type: "line",
            data: yDataC,
            smooth: true,
            areaStyle: {},
            showSymbol: false,

            lineStyle: {
              width: 0,
            },
            stack: "num",
            emphasis: {
              focus: "series",
            },
          },
          {
            name: "家居",
            type: "line",
            data: yDataD,
            smooth: true,
            areaStyle: {},
            showSymbol: false,

            lineStyle: {
              width: 0,
            },
            stack: "num",
            emphasis: {
              focus: "series",
            },
          },
        ],
      });
    });
  },
};
</script>

  <style>
#three {
  height: 5.125rem;
}
</style>
9.散点图代码
<template>
  <div>
    <div id="four">你好呀</div>
  </div>
</template>

  <script>
import { inject, onMounted } from "vue";
export default {
  setup() {
    let $echarts = inject("echarts");
    onMounted(() => {
      // echarts中默认主题有两个:light、dark
      // echarts.init(选取容器dom,'主题')
      let echarts = $echarts.init(document.getElementById("four"), "dark");
      echarts.setOption({
        title: {
          text: "散点图",
          left: "center",
          textStyle: {
            color: "#fff",
            textShadowBlur: 10,
            textShadowColor: "#33ffff",
          },
        },
        toolbox: {
          iconStyle: {
            borderColor: "#fff",
          },
          feature: {
            dataView: { readOnly: false },
            restore: {},
            saveAsImage: {},
          },
        },
        grid: {
          left: "1%",
          bottom: "1%",
          right: "6%",
          containLabel: true,
        },
        tooltip: {
          trigger: "axis",
        },
        legend: {},

        xAxis: {
          axisLine: {
            lineStyle: {
              color: "#fff",
            },
          },
        },
        yAxis: {
          axisLine: {
            lineStyle: {
              color: "#fff",
            },
          },
        },
        series: [
          {
            type: "scatter",
            data: [
              [2.0, 4.04],
              [1.07, 2.33],
              [3.0, 4.04],
              [8.07, 1.33],
              [9.0, 7.04],
              [2.0, 4.04],
              [1.07, 1.33],
              [1.0, 1.04],
              [2.07, 2.33],
              [3.0, 3.04],
              [1.27, 0.33],
              [3.0, 9.65],
              [9.05, 8.23],
              [18.0, 9.76],
              [15.0, 7.56],
              [23.4, 5.31],
              [10.1, 7.47],
              [16.0, 8.26],
              [12.7, 3.53],
              [9.35, 7.2],
              [7.4, 8.2],
              [3.07, 4.82],
              [18.2, 6.83],
              [2.02, 4.47],
              [1.05, 3.33],
              [4.05, 4.96],
              [6.03, 7.24],
              [17.0, 6.55],
              [12.0, 8.84],
              [8.18, 5.82],
              [6.32, 5.68],
            ],
            SymbolSize: 20,
            itemStyle: {
              color: new $echarts.graphic.LinearGradient(0, 0, 1, 0, [
                {
                  offset: 0,
                  color: "#00ff00",
                },

                {
                  offset: 1,
                  color: "#ff0000",
                },
              ]),
            },
            emphasis: {
              itemStyle: {
                borderColor: "rgba(103,205,45,0.3)",
                borderWidth: 30,
              },
            },
          },
        ],
      });
    });
  },
};
</script>

  <style>
#four {
  height: 5.12rem;
}
</style>
10.K线图代码
<template>
  <div>
    <div id="five">你好呀</div>
  </div>
</template>

  <script>
import { computed, inject, onMounted, reactive } from "vue";
export default {
  setup() {
    let $echarts = inject("echarts");
    const data = reactive({
      data: [
        [20, 34, 10, 38],
        [40, 35, 30, 50],
        [31, 38, 33, 44],
        [38, 15, 5, 42],
      ],
    });
    const newarr = computed(() => {
      return data.data.map((v) => v[0]); // 获取data的第一列数据
    });

    onMounted(() => {
      // console.log(this.data);

      let echarts = $echarts.init(document.getElementById("five"));
      echarts.setOption({
        title: {
          text: "K线图",
          left: "center",
          textStyle: {
            color: "#fff",
            textShadowBlur: 10,
            textShadowColor: "#33ffff",
          },
        },
        toolbox: {
          iconStyle: {
            borderColor: "#fff",
          },
          feature: {
            dataView: { readOnly: false },
            restore: {},
            saveAsImage: {},
          },
        },
        grid: {
          left: "1%",
          bottom: "1%",
          containLabel: true,
        },
        tooltip: {
          trigger: "axis",
          axisPointer: {
            type: "cross",
          },
        },
        legend: {},

        xAxis: {
          type: "category",
          axisLine: {
            lineStyle: {
              color: "#fff",
            },
          },
          data: ["蔬菜", "水果", "熟食", "便捷食品"],
        },
        yAxis: {
          value: "value",
          axisLine: {
            lineStyle: {
              color: "#fff",
            },
          },
        },
        series: [
          {
            type: "candlestick",
            data: data.data,
            itemStyle: {
              color: "#00ff00",
              color0: "pink",
              borderColor: "null",
              borderColor0: "null",
            },
            markPoint: {
              data: [
                {
                  name: "最大值",
                  type: "max",
                  valueDim: "highest",
                },
                {
                  name: "最小值",
                  type: "min",
                  valueDim: "lowest",
                },
              ],
            },
          },
          {
            // name: "MA20",
            type: "line",
            data: newarr.value, // 访问计算属性的值需要使用 ".value"
            smooth: true,
            lineStyle: {
              opacity: 0.5,
            },
          },
        ],
      });
    });
    return {
      data,
      newarr,
    };
  },
};
</script>

  <style>
#five {
  height: 5.125rem;
}
</style>
11.自主定义主题代码
<template>
  <div>
    <div id="sixteen">你好呀</div>
  </div>
</template>

  <script>
import { inject, onMounted } from "vue";
import { roma } from "../../assets/roma.js";
export default {
  setup() {
    let $echarts = inject("echarts");
    onMounted(() => {
      // echarts中默认主题有两个:light、dark
      // echarts.init(选取容器dom,'主题')
      // 1.在主题编辑器中编辑主题
      // 主题编辑器地址:https://echarts.apache.org/zh/theme-builder.html
      // 2.下载对应主题json格式
      // 3.创建js文件把刚才下载的文件写入并且暴露
      // let roma=你的主题json
      // export default roma
      // 4.引用主题文件
      // import roma from "../assets/roma"
      let echarts = $echarts.init(
        document.getElementById("sixteen"),
        // "dark",
        roma
      );
      echarts.setOption({
        title: {
          text: "自定义主题",
          left: "center",
          textStyle: {
            color: "#fff",
            textShadowBlur: 10,
            textShadowColor: "#33ffff",
          },
        },
        grid: {
          // top: "50%",
        },
        tooltip: {
          trigger: "item",
        },

        legend: {
          top: 25,
          textStyle: {
            color: "#ffffff", // 设置图例字体颜色为白色
            fontSize: 14,
          },
        },

        // xAxis: {},
        // yAxis: {},
        series: [
          {
            type: "pie",
            emphasis: {
              //选中高亮的标签和图形样式。
              label: {
                fontSize: 20,
              },
            },
            data: [
              { value: 88, name: "美食" },
              { value: 75, name: "日化" },
              { value: 34, name: "数码" },
              { value: 67, name: "蔬菜" },
              { value: 32, name: "熟食" },
            ],
            center: ["50%", "55%"],
            // radius: "60%",
            label: {
              position: "inside",
              show: true,
              color: "red",
              fontSize: 14,
            },
          },
        ],
      });
    });
  },
};
</script>

  <style>
#sixteen {
  height: 5.125rem;
}
</style>
12.漏斗图代码
<template>
  <div>
    <div id="seven">你好呀</div>
  </div>
</template>

  <script>
import { inject, onMounted } from "vue";
export default {
  setup() {
    let $echarts = inject("echarts");
    onMounted(() => {
      let echarts = $echarts.init(document.getElementById("seven"));
      echarts.setOption({
        title: {
          text: "漏斗图",
          left: "center",
          textStyle: {
            color: "#fff",
            textShadowBlur: 10,
            textShadowColor: "#33ffff",
          },
        },
        toolbox: {
          iconStyle: {
            borderColor: "#fff",
          },
          feature: {
            dataView: { readOnly: false },
            restore: {},
            saveAsImage: {},
          },
        },
        grid: {},
        tooltip: {
          trigger: "item",
          formatter: "{a} <br/>{b} : {c}%",
        },
        legend: {
          top: 30,
        },

        series: [
          {
            type: "funnel",
            emphasis: {
              //选中高亮的标签和图形样式。
              label: {
                fontSize: 20,
              },
            },
            data: [
              { value: 60, name: "美食" },
              { value: 40, name: "日化" },
              { value: 20, name: "数码" },
              { value: 80, name: "家电" },
              { value: 100, name: "蔬菜" },
            ],
            sort: "descending",
            top: 70,
            left: 20,
            right: 10,
            bottom: 10,
            label: {
              show: true,
              position: "inside",
            },
            // gap: 1,
            itemStyle: {
              borderColor: "red",
              // color: "red",
            },
          },
        ],
      });
    });
  },
};
</script>

  <style>
#seven {
  height: 5.125rem;
}
</style>
13.仪表盘代码
<template>
  <div>
    <div id="eleven">你好呀</div>
  </div>
</template>

  <script>
import { inject, onMounted } from "vue";
export default {
  setup() {
    let $echarts = inject("echarts");
    onMounted(() => {
      let echarts = $echarts.init(document.getElementById("eleven"), "dark");
      echarts.setOption({
        title: {
          text: "仪表盘",
          left: "center",
          textStyle: {
            color: "#fff",
            textShadowBlur: 10,
            textShadowColor: "#33ffff",
          },
        },
        grid: {
          bottom: "0%",
        },
        tooltip: {
          trigger: "axis",
        },
        legend: {},

        series: [
          {
            type: "gauge",
            detail: {
              valueAnimation: true,
            },
            progress: {
              show: true,
            },
            data: [
              {
                value: 60,
                name: "SCORE",
              },
            ],
          },
        ],
      });
    });
  },
};
</script>

  <style>
#eleven {
  height: 5.125rem;
}
</style>
14.关系图代码
<template>
  <div>
    <div id="twelve">你好呀</div>
  </div>
</template>

  <script>
import { inject, onMounted, reactive } from "vue";
export default {
  setup() {
    let $echarts = inject("echarts");
    let data = reactive({
      list: [
        //创建节点数据
        {
          name: "韦小宝",
          id: "1",
          symbolSize: 30, //节点大小
          symbol: "circle", //节点形状,
        },
        {
          name: "方怡",
          id: "2",
          symbolSize: 30, //节点大小
          symbol: "circle", //节点形状,
        },
        {
          name: "双儿",
          id: "3",
          symbolSize: 30, //节点大小
          symbol: "circle", //节点形状,
        },
        {
          name: "茅十八",
          id: "4",
          symbolSize: 30, //节点大小
          symbol: "circle", //节点形状,
        },
        {
          name: "吴六奇",
          id: "5",
          symbolSize: 30, //节点大小
          symbol: "circle", //节点形状,
        },
      ],
      num: [
        {
          source: "1", //边的源节点名称的字符串
          target: "2", //边的目标节点名称的字符串
          relation: {
            name: "同学",
            id: "1",
          },
        },
        {
          source: "1",
          target: "3",
          relation: {
            name: "朋友",
            id: "1",
          },
        },
        {
          source: "1",
          target: "4",
          relation: {
            name: "同事",
            id: "1",
          },
        },
        {
          source: "4",
          target: "1",
          relation: {
            name: "兄弟",
            id: "1",
          },
        },
        {
          source: "3",
          target: "5",
          relation: {
            name: "陌生人",
            id: "1",
          },
        },
      ],
    });
    onMounted(() => {
      let echarts = $echarts.init(document.getElementById("twelve"));
      echarts.setOption({
        title: {
          text: "关系图",
          left: "center",
          textStyle: {
            color: "#fff",
            textShadowBlur: 10,
            textShadowColor: "#33ffff",
          },
        },
        series: [
          {
            type: "graph", //图标类型为关系图用于展现节点以及节点之间的关系数据
            layout: "force", //图的布局 引导布局
            data: data.list,
            itemStyle: {
              //节点的样式
              color: "#95dcb2",
            },
            label: {
              show: true,
              position: "bottom", //位置底部
              distance: 5, //距离图形元素的距离
              fontSize: 18,
              align: "center", //文字水平对齐方式
            },
            force: {
              //设置间距
              repulsion: 50, //点之间的距离
              gravity: 0.01, //设置距离中心点位置
              edgeLength: 100, //边的两个节点之间的距离
            },
            links: data.num, //节点间的关系数据
            edgeLabel: {
              //标签
              show: true,
              position: "middle", //标签位置线的中点
              fontSize: 12,
              formatter: (params) => {
                //标签内容格式设置内容
                return params.data.relation.name;
              },
            },
            edgeSymbol: ["circle", "arrow"], //边两边的类型
            autoCurveness: 0.01, //针对节点之间存在多边的情况,自动计算各边曲率
          },
        ],
      });
    });
    return {
      data,
    };
  },
};
</script>

  <style>
#twelve {
  height: 5.125rem;
}
</style>
15.数据区域缩放代码
<template>
  <div>
    <div id="thirteen">你好呀</div>
  </div>
</template>

  <script>
import { inject, onMounted } from "vue";
export default {
  setup() {
    let $echarts = inject("echarts");
    onMounted(() => {
      let echarts = $echarts.init(document.getElementById("thirteen"));
      echarts.setOption({
        title: {
          text: "数据区域缩放",
          left: "center",
          textStyle: {
            color: "#fff",
            textShadowBlur: 10,
            textShadowColor: "#33ffff",
          },
        },
        grid: {
          // bottom: "10%",
          left: "1%",
          right: "20%",
          containLabel: true,
        },
        toolbox: {
          iconStyle: {
            borderColor: "#fff",
          },
          feature: {
            dataView: { readOnly: false },
            magicType: { type: ["bar", "line"] },
            restore: {},
            saveAsImage: {},
          },
        },
        tooltip: {
          trigger: "axis",
        },
        legend: {},

        xAxis: {
          type: "category",
          axisLine: {
            lineStyle: {
              color: "#fff",
            },
          },
          data: [
            "星期一",
            "星期二",
            "星期三",
            "星期四",
            "星期五",
            "星期六",
            "星期天",
          ],
        },
        yAxis: {
          value: "category",
          axisLine: {
            lineStyle: {
              color: "#fff",
            },
          },
        },
        series: [
          {
            type: "line",
            data: [150, 230, 224, 218, 135, 147, 260],
            smooth: true,
            showSymbol: false,
            lineStyle: {
              color: "#fff",
            },
            markPoint: {
              data: [
                {
                  type: "max",
                  value: "最大值",
                },
                {
                  type: "min",
                  value: "最小值",
                },
              ],
            },
            markLine: {
              data: [
                {
                  type: "average",
                  value: "平均值",
                },
              ],
            },
          },
        ],
        dataZoom: [
          {
            type: "slider",
            xAxisIndex: 0,
            filterMode: "none",
          },
          {
            type: "slider",
            yAxisIndex: 0,
            filterMode: "none",
          },
        ],
      });
    });
  },
};
</script>

  <style>
#thirteen {
  height: 5.125rem;
}
</style>
16.数据排序代码
<template>
  <div>
    <div id="fifteen">你好呀</div>
  </div>
</template>

  <script>
import { inject, onMounted } from "vue";
export default {
  setup() {
    let $echarts = inject("echarts");
    onMounted(() => {
      let echarts = $echarts.init(document.getElementById("fifteen"));
      echarts.setOption({
        title: {
          text: "数据排序",
          left: "center",
          textStyle: {
            color: "#fff",
            textShadowBlur: 10,
            textShadowColor: "#33ffff",
          },
        },
        dataset: [
          {
            dimensions: ["分类", "数量"],
            source: [
              ["美食", 123],
              ["日化", 98],
              ["熟食", 231],
              ["数码", 223],
              ["蔬菜", 25],
              ["杂项", 19],
            ],
          },
          {
            transform: {
              type: "sort",
              config: { dimension: "数量", order: "desc" },
            },
          },
        ],
        grid: {
          bottom: "1%",
          containLabel: true,
        },
        tooltip: {
          trigger: "axis",
        },
        legend: {},
        toolbox: {
          iconStyle: {
            borderColor: "white",
          },
          show: true, //是否显示工具栏组件,默认显示true
          feature: {
            dataView: { readOnly: false },
            magicType: { type: ["bar", "line"] },
            restore: {},
            saveAsImage: {},
          },
        },
        xAxis: {
          type: "category",
          axisLine: {
            lineStyle: {
              color: "white",
            },
          },
          axisLabel: {
            interval: 0,
            rotate: 30,
          },
        },
        yAxis: {
          axisLine: {
            lineStyle: {
              color: "white",
            },
          },
        },
        series: [
          {
            type: "bar",
            encode: {
              x: "分类",
              y: "数量",
            },
            markPoint: {
              data: [
                {
                  type: "max",
                  value: "最大值",
                  label: { color: "#f00" },
                },
                {
                  type: "min",
                  value: "最小值",
                  label: { color: "#f00" },
                },
              ],
            },
            itemStyle: {
              barBorderRadius: [50, 0, 90, 0],
              color: new $echarts.graphic.LinearGradient(0, 0, 1, 0, [
                {
                  offset: 0,
                  color: "#ff0",
                },
                {
                  offset: 0.5,
                  color: "#f90",
                },
                {
                  offset: 1,
                  color: "#0f0",
                },
              ]),
            },
            datasetIndex: 1,
          },
        ],
      });
    });
  },
};
</script>

  <style>
#fifteen {
  height: 5.125rem;
}
</style>
17.雷达图代码
<template>
  <div>
    <div id="six">你好呀</div>
  </div>
</template>

  <script>
import { inject, onMounted } from "vue";
export default {
  setup() {
    let $echarts = inject("echarts");
    onMounted(() => {
      let echarts = $echarts.init(document.getElementById("six"));
      echarts.setOption({
        title: {
          text: "雷达图",
          left: "center",
          textStyle: {
            color: "#fff",
            textShadowBlur: 10,
            textShadowColor: "#fff",
          },
        },

        radar: {
          indicator: [
            { name: "蔬菜" },
            { name: "水果" },
            { name: "熟食" },
            { name: "数码" },
            { name: "家电" },
            { name: "日化" },
          ],
          center: ["50%", "55%"],
          radius: "60%",
          startAngle: 90,
          splitNumber: 6,
          // shape: "circle",
          splitArea: {
            areaStyle: {
              color: ["#77EADF", "#26C3BE", "#64AFE9", "#428BD4"],
              shadowColor: "rgba(0, 0, 0, 0.2)",
              shadowBlur: 10,
            },
          },
          axisName: {
            formatter: "[{value}]",
            color: "#fff",
          },
          // axisTick: {
          //   show: true,
          //   lineStyle: {
          //     color: "rgba(255, 255, 255, 0.8)",
          //   },
          // },
        },
        series: [
          {
            type: "radar",
            symbol: "rect",
            data: [
              {
                value: [4000, 2000, 5000, 9000, 7000, 8000],
                name: "销量",
                lineStyle: "dashed",
                symbolSize: 6,
                areaStyle: {
                  color: "rgba(255, 228, 52, 0.6)",
                },
              },
            ],
          },
        ],
      });
    });
  },
};
</script>

  <style>
#six {
  height: 5.125rem;
}
</style>
18.树形图代码
<template>
  <div>
    <div id="fourteen">你好呀</div>
  </div>
</template>

  <script>
import { inject, onMounted, reactive } from "vue";
export default {
  setup() {
    let $echarts = inject("echarts");
    let data = reactive({
      name: "层级1", // 节点的名称,当前节点 label 对应的文本
      children: [
        {
          name: "层级2",
          children: [
            {
              name: "层级3-1",
              children: [
                //子节点
                { name: "数据1", value: 3938 }, // value 值,只在 tooltip 中显示
                { name: "数据2", value: 3812 },
                { name: "数据3", value: 6714 },
                { name: "数据4", value: 743 },
              ],
            },
            {
              name: "层级3-2",
              children: [
                { name: "数据1", value: 3534 },
                { name: "数据2", value: 5731 },
                { name: "数据3", value: 7840 },
                { name: "数据4", value: 5914 },
                { name: "数据5", value: 3416 },
              ],
            },
          ],
        },
      ],
    });
    onMounted(() => {
      let echarts = $echarts.init(document.getElementById("fourteen"));
      echarts.setOption({
        title: {
          text: "树形图",
          left: "center",
          textStyle: {
            color: "#fff",
            textShadowBlur: 10,
            textShadowColor: "#33ffff",
          },
        },
        grid: {},
        tooltip: {
          trigger: "item",
        },
        legend: {},

        series: [
          {
            type: "tree",
            data: [data],
            symbolSize: 20,
            orient: "LR", //树图中 正交布局 的方向 // 水平 方向的 从左到右'LR',从右到左'RL'; // 以及垂直方向的 从上到下'TB',从下到上'BT'
            label: {
              position: "bottom",
              // rotate: 90,
              // verticalAlign: "middle",
              // align: "right",
            },
            leaves: {
              label: {
                position: "top",
                // verticalAlign: "middle",
                // align: "left",
              },
            },
            emphasis: {
              focus: "descendant",
            },
            expandAndCollapse: true,
            animationDuration: 550,
            animationDurationUpdate: 750,
          },
        ],
      });
    });
    return {
      data,
    };
  },
};
</script>

  <style>
#fourteen {
  height: 5.125rem;
}
</style>
19.世界地图代码
<template>
  <div class="body">
    <header>
      <el-button-group class="ebg">
        <el-button type="primary" class="pri" @click="handleClick">
          <el-icon class="el-icon--left ei"><ArrowLeft /></el-icon>返回
        </el-button>
      </el-button-group>
      <!-- <span>世界地图</span> -->
    </header>

    <div id="worldMap"></div>
  </div>
</template>

<script>
import axios from "axios";
import { inject, onMounted, reactive } from "vue";
import { useRouter } from "vue-router";
export default {
  methods: {
    handleClick() {
      // 点击事件处理逻辑
      this.$router.push({ name: "index" });
    },
  },
  setup() {
    let $echarts = inject("echarts");
    let mapData = reactive({});
    let worldData = reactive({});
    let router = useRouter();
    async function getState() {
      mapData = await axios.get("/shoudu/data");
      worldData = await axios.get("/world/data");
    }

    onMounted(() => {
      getState().then(() => {
        let echarts = $echarts.init(document.getElementById("worldMap"));
        $echarts.registerMap("worldMap", worldData.data.worldData);
        // console.log(worldData.data.worldData.features);
        // const dataPoints = [];
        // for (let i = 0; i < worldData.data.worldData.features.length; i++) {
        //   const feature = worldData.data.worldData.features[i];
        //   const dataPoint = {
        //     name: feature.properties.name,
        //     value: feature.properties.cp,
        //   };
        //   dataPoints.push(dataPoint);
        // }
        // console.log(worldData.data.worldData.features[0].properties.name);
        // console.log(worldData.data.worldData.features[0].properties.cp);
        echarts.setOption({
          title: {
            text: "世界地图",
            left: "center",
            textStyle: {
              color: "#fff",
              fontSize: 25,
              textShadowBlur: 10,
              textShadowColor: "#3ff",
            },
          },
          tooltip: {
            trigger: "item",
          },
          geo: {
            map: "worldMap",
            roam: true,
            scaleLimit: {
              max: 5,
              min: 1,
            },

            label: {
              show: true,
              color: "#fff",
              fontSize: 10,
            },
            itemStyle: {
              areaColor: "#0099ff",
            },
            emphasis: {
              focus: "none",
              itemStyle: {
                areaColor: "#5f0",
                borderColor: "#0ff",
                shadowColor: "rgba(230,130,70,.5)",
                shadowBlur: 30,
              },
            },
            zoom: 3,
            center: [104, 35],
          },

          series: [
            {
              type: "effectScatter",
              symbolSize: 5,
              // map: "china",
              coordinateSystem: "geo",
              data: mapData.data.shouduData.shouDu,
              label: {
                show: true,
                formatter: function (params) {
                  return params.name; // 城市名称
                },
              },

              rippleEffect: {
                number: 2,
                scale: 8,
              },
              itemStyle: {
                fontSize: 5,
                color: "red",
                show: true,
              },
              markLine: {
                silent: true,
              },
            },
          ],
        });
        echarts.on("click", function (params) {
          console.log(params);
          if (params.componentType === "geo") {
            if (params.componentIndex === 0) {
              if (params.name === "中国") {
                router.push({ name: "cities" });
              }
            }
          }
        });
      });
    });
    return {
      getState,
      mapData,
      worldData,
    };
  },
};
</script>

<style>
.body {
  background: url("@/assets/bg.jpg"), top center no-repeat;
  /* height: 100%; */
}
#worldMap {
  width: 100%;
  height: 11.2rem;
}
header {
  height: 1rem;
  width: 100%;
  /* background-color: rgba(0, 0, 255, 0.2); */
}

.pri {
  font-size: 0.3rem;
  background-color: transparent;
  border: none;
  margin-top: 0.3rem;
}
.pri:hover {
  background-color: transparent;
}
</style>
20.中国城市地图代码
<template>
  <div class="body">
    <header>
      <el-button-group class="ebg">
        <el-button type="primary" class="pri" @click="handleClick">
          <el-icon class="el-icon--left ei"><ArrowLeft /></el-icon>返回
        </el-button>
      </el-button-group>
    </header>

    <div id="chinaContour"></div>
  </div>
</template>

  <script>
import axios from "axios";
import { inject, onMounted, reactive } from "vue";
export default {
  methods: {
    handleClick() {
      // 点击事件处理逻辑
      this.$router.push({ name: "world" });
    },
  },

  setup() {
    let $echarts = inject("echarts");
    let chinaContourData = reactive({});

    async function getState() {
      chinaContourData = await axios.get("/chinacontour/data");
    }

    onMounted(() => {
      getState().then(() => {
        let echarts = $echarts.init(document.getElementById("chinaContour"));
        $echarts.registerMap(
          "chinaContour",
          chinaContourData.data.chinaContourData
        );
        console.log(chinaContourData.data.chinaContourData);
        // console.log(chinaCitiesData.data.chinaCitiesData.features[0].properties.name);
        // console.log(chinaCitiesData.data.chinaCitiesData.features[0].properties.cp);
        const dataPoints = [];
        for (
          let i = 0;
          i < chinaContourData.data.chinaContourData.features.length;
          i++
        ) {
          const feature = chinaContourData.data.chinaContourData.features[i];
          const dataPoint = {
            name: feature.properties.name,
            value: feature.properties.cp,
          };
          dataPoints.push(dataPoint);
        }
        echarts.setOption({
          title: {
            text: "中国城市地图",
            left: "center",
            textStyle: {
              color: "#fff",
              fontSize: 25,
              textShadowBlur: 10,
              textShadowColor: "#3ff",
            },
          },
          tooltip: {
            trigger: "item",
          },
          geo: {
            map: "chinaContour",
            roam: true,
            scaleLimit: {
              max: 5,
              min: 1,
            },

            label: {
              show: true,
              color: "#fff",
              fontSize: 10,
            },
            itemStyle: {
              areaColor: "#0099ff",
            },
            emphasis: {
              focus: "none",
              itemStyle: {
                areaColor: "#5f0",
                borderColor: "#0ff",
                shadowColor: "rgba(230,130,70,.5)",
                shadowBlur: 30,
              },
            },
            // zoom: 3,
            // center: [104, 35],
          },

          series: [
            {
              type: "effectScatter",
              symbolSize: 5,
              coordinateSystem: "geo",
              data: dataPoints,
              label: {
                show: true,
                formatter: function (params) {
                  return params.name; // 城市名称
                },
              },
              rippleEffect: {
                number: 2,
                scale: 8,
              },
              itemStyle: {
                fontSize: 5,
                color: "red",
                show: true,
              },
              markLine: {
                silent: true,
              },
            },
          ],
        });
      });
    });
    return {
      getState,
      chinaContourData,
    };
  },
};
</script>

  <style>
.body {
  background: url("@/assets/bg.jpg"), top center no-repeat;
  /* height: 100%; */
}
#chinaContour {
  width: 100%;
  height: 11.2rem;
}
header {
  height: 1rem;
  width: 100%;
  /* background-color: rgba(0, 0, 255, 0.2); */
}

.pri {
  font-size: 0.3rem;
  background-color: transparent;
  border: none;
  margin-top: 0.3rem;
}
.pri:hover {
  background-color: transparent;
}
</style>
21.中国省份地图(34个)
<template>
  <div>
    <header>
      <el-button-group class="ebg">
        <el-button type="primary" class="pri" @click="handleClick">
          <el-icon class="el-icon--left ei"><ArrowLeft /></el-icon>返回
        </el-button>
      </el-button-group>
      <!-- <span>世界地图</span> -->
    </header>
    <div id="beiMap">你好呀</div>
  </div>
</template>

          <script>
import { inject, onMounted } from "vue";
import beijing from "../../../public/map/province/beijing.json";
export default {
  methods: {
    handleClick() {
      // 点击事件处理逻辑
      this.$router.push({ name: "page" });
    },
  },
  setup() {
    let $echarts = inject("echarts");
    onMounted(() => {
      let echarts = $echarts.init(document.getElementById("beiMap"));
      $echarts.registerMap("beiMap", beijing);
      echarts.setOption({
        title: {
          text: "北京市地图",
          left: "center",
          textStyle: {
            color: "#fff",
            textShadowBlur: 10,
            textShadowColor: "#3ff",
          },
        },

        tooltip: {
          trigger: "item",
        },
        legend: {},
        geo: {
          map: "beiMap",
          roam: true,
          scaleLimit: {
            max: 3,
            min: 1.2,
          },
          layoutCenter: ["50%", "50%"],
          layoutSize: "70%", // 调整地图的尺寸
          zoom: 1.2,
          label: {
            //地图上显示文字提示信息
            show: true,
            color: "#ffffff",
            fontSize: 10, //字体大小
          },
          // center: [108.956239, 34.268309],
          itemStyle: {
            areaColor: "#0099ff",
          },
          emphasis: {
            focus: "none",
            itemStyle: {
              areaColor: "#fff",
              borderColor: "#00ffff",
              shadowColor: "rgba(230,130,70,0.5)",
              shadowBlur: 30,
            },
          },
        },
        series: [
          {
            type: "effectScatter",
            symbolSize: 10,
            coordinateSystem: "geo",
            data: [{ name: "北京市", value: [116.412812, 39.919336] }],
            rippleEffect: {
              number: 2,
              scale: 5,
            },
            itemStyle: {
              color: "#f00",
            },
          },
        ],
      });
    });
  },
};
</script>

          <style>
#beiMap {
  height: 11.1rem;
  /* background-color: white; */
}
header {
  height: 1rem;
  width: 100%;
  /* background-color: rgba(0, 0, 255, 0.2); */
}

.pri {
  font-size: 0.3rem;
  background-color: transparent;
  border: none;
  margin-top: 0.3rem;
}
.pri:hover {
  background-color: transparent;
}
</style>
八、部分代码解析
i.引入组件以及插槽的作用
   <section class="left">
        <itemPage>
          <itemOne />
        </itemPage>
        <itemPage>
          <itemTwo />
        </itemPage>
</section> 以上这段代码创建了一个名为"left"的部分,并在其中使用了itemPage组件来展示其他两个组件。这需要我们itemPage组件中加入一个插槽标签(<slot></slot>),插槽在组件化开发中起到了构建灵活、可定制和可复用组件的重要作用。它允许父组件向子组件提供动态内容,并实现更灵活的布局和展示。同时在script标签中引入该组件来使用,如下:
<script>
import itemPage from "@/components/itemPage.vue";
import itemOne from "@/components/itemOne.vue";
import itemTwo from "@/components/itemTwo.vue";

export default {
  components: {
    itemPage,
    itemOne,
    itemTwo,
  },
};
</script>
ii. 数据中提取特定的信息
 <script>
import axios from "axios";
import { inject, onMounted, reactive } from "vue";
export default {
  setup() {
    let $echarts = inject("echarts");
    let chinaContourData = reactive({});
    async function getState() {
      chinaContourData = await axios.get("/chinacontour/data");
    }

    onMounted(() => {
      getState().then(() => {
        let echarts = $echarts.init(document.getElementById("chinaContour"));
        $echarts.registerMap(
          "chinaContour",
          chinaContourData.data.chinaContourData
        );
        const dataPoints = [];
        for (
          let i = 0;
          i < chinaContourData.data.chinaContourData.features.length;
          i++
        ) {
          const feature = chinaContourData.data.chinaContourData.features[i];
          const dataPoint = {
            name: feature.properties.name,
            value: feature.properties.cp,
          };
          dataPoints.push(dataPoint);
        }
        echarts.setOption({
          title: {
            text: "中国城市地图",
            },
          },
          tooltip: {},
          geo: {
            map: "chinaContour",
            roam: true,
          series: [
            {
              type: "effectScatter",
              coordinateSystem: "geo",
              data: dataPoints,
              rippleEffect: {
                number: 2,
                scale: 8,
              },
            },
          ],
        });
      });
    });
    return {
      getState,
      chinaContourData,
    };
  },
};
</script>
以上当中 const dataPoints = []...的作用是从chinaContourData数据中提取特定的信息,并将这些信息转换为一个包含多个数据点的数组dataPoints,然后再赋值给echarts.setOption({series: [data: dataPoints,]})以便更加方便地渲染出来。
具体的步骤如下:
1.创建一个空数组dataPoints,用于存储数据点。
2.使用for循环遍历 chinaContourData.data.chinaContourData.features数组的每个元素。
3.在每次循环中,从 chinaContourData.data.chinaContourData.features数组中获取当前元素,并将其赋值给变量features。
4.创建一个对象dataPoint,其中包括两个属性:
》name属性:赋值为 feature.properties.name,表示数据点的名称。
》value属性:赋值为 feature.properties.cp,表示数据点的值。
5.将dataPoint对象添加到dataPoints数组中。
6.循环结束后,dataPoints数组将包含多个数据点对象,每个对象都有一个名称和一个值。
iii.使用ECharts图表库中的echarts.on方法来监听点击事件
 echarts.on("click", function (params) {
          if (params.componentType === "geo") {
            if (params.componentIndex === 0) {
              var clickedProvince = params.name;
              console.log(clickedProvince);
              if (provinceRoutes.hasOwnProperty(clickedProvince)) {
                router.push({ name: provinceRoutes[clickedProvince] });
              }
            }
          }
        });
        const provinceRoutes = {
          广东: "guangdong",
          广西: "guangxi",
          安徽: "anhui",
          新疆: "xinjiang",
          西藏: "xizang",
          内蒙古: "neimenggu",
          宁夏: "ningxia",
          青海: "qinghai",
          甘肃: "gansu",
          四川: "sichuan",
          重庆: "chongqing",
          云南: "yunnan",
          贵州: "guizhou",
          陕西: "shanxi",
          山西: "shanXi",
          湖南: "hunan",
          湖北: "hubei",
          河南: "henan",
          河北: "hebei",
          山东: "shandong",
          北京: "beijing",
          天津: "tianjin",
          江西: "jiangxi",
          福建: "fujian",
          台湾: "taiwan",
          香港: "xianggang",
          澳门: "aomen",
          海南: "hainan",
          浙江: "zhejiang",
          上海: "shanghai",
          江苏: "jiangsu",
          辽宁: "liaoning",
          吉林: "jilin",
          黑龙江: "heilongjiang",
}; 以上代码是一个JavaScript的事件监听器,它使用ECharts图表库中的echarts.on方法来监听点击事件。当用户点击ECharts图表中的元素时,该事件监听器会被触发。
在事件处理函数中,首先判断被点击的组件类型是否为地理组件,即判断params.componentType是否为"geo"。然后再判断被点击的地理组件的索引是否为0,即判断params.componentIndex是否为0。这样的判断是为了确定用户点击的是否是地图上的某个省份。
如果上述条件满足,那么代码会获取被点击的省份名称params.name,并将其打印到控制台中。
接下来,代码会检查provinceRoutes对象中是否存在键名为clickedProvince的属性。如果存在,则会使用router.push方法进行页面路由跳转,跳转到provinceRoutes[clickedProvince]指定的目标路由。
provinceRoutes对象是一个映射,将省份名称映射为相应的路由名称。例如,如果点击了"广东"省份,代码会将路由跳转到名为"guangdong"的目标页面。
总而言之,这段代码实现了在地图上点击某个省份时,根据省份名称进行页面路由跳转的功能。
当然,我们也可以用最棒(笨)的方法,如以下:
 echarts.on("click", function (params) {
          console.log(params);
          if (params.componentType === "geo") {
            if (params.componentIndex === 0) {
              if (params.name === "广东") {
                router.push({ name: "cities" });
              }else if (params.name === "广西") {
                router.push({ name: "cities" });
              }else if (params.name === "北京") {
                router.push({ name: "cities" });
              }else if ......
            }
          }
        });
九、容易忘记点(复习点)
i.子路由中path中不用加"/"
ii.Vue3.0中,使用了Compositon API,this的使用方式发生了一些变化。在Compositon API,可以使用ref和reactive创建响应式数据,使用computed创建计算属性,以及使用watch监听数据的变化。此外,使用setup()函数来编写组件罗辑,该函数接收props和context作为参数,不在使用this。
iii.访问计算属性computed的值需要使用”.value”。
iv.设置数据请求方法,不要忘了return
十、页面截屏功能分析
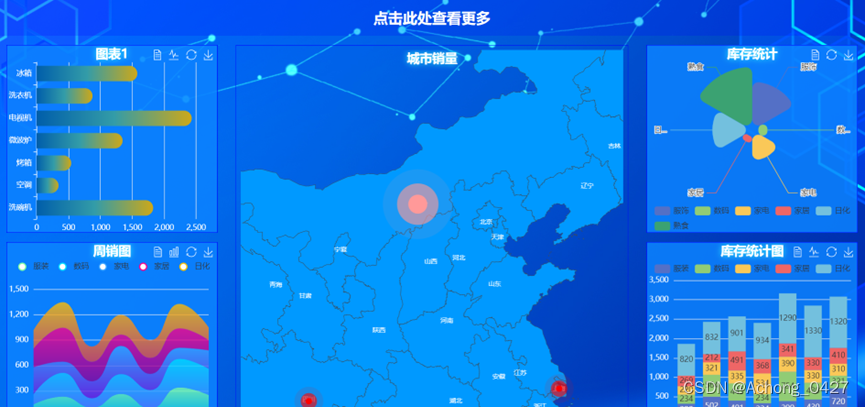
(图一)
点击图一当中的城市销量的中国地图的每个省份可实现跳转查看到当前点击的省份的详细省份地图,例如点击其中的广东省随处范围可跳转查看该省份的详细城市(均可缩放大小),如以下图二:

(图二)
点击北京市可查看跳转到北京市的详细地图,如以下图三:
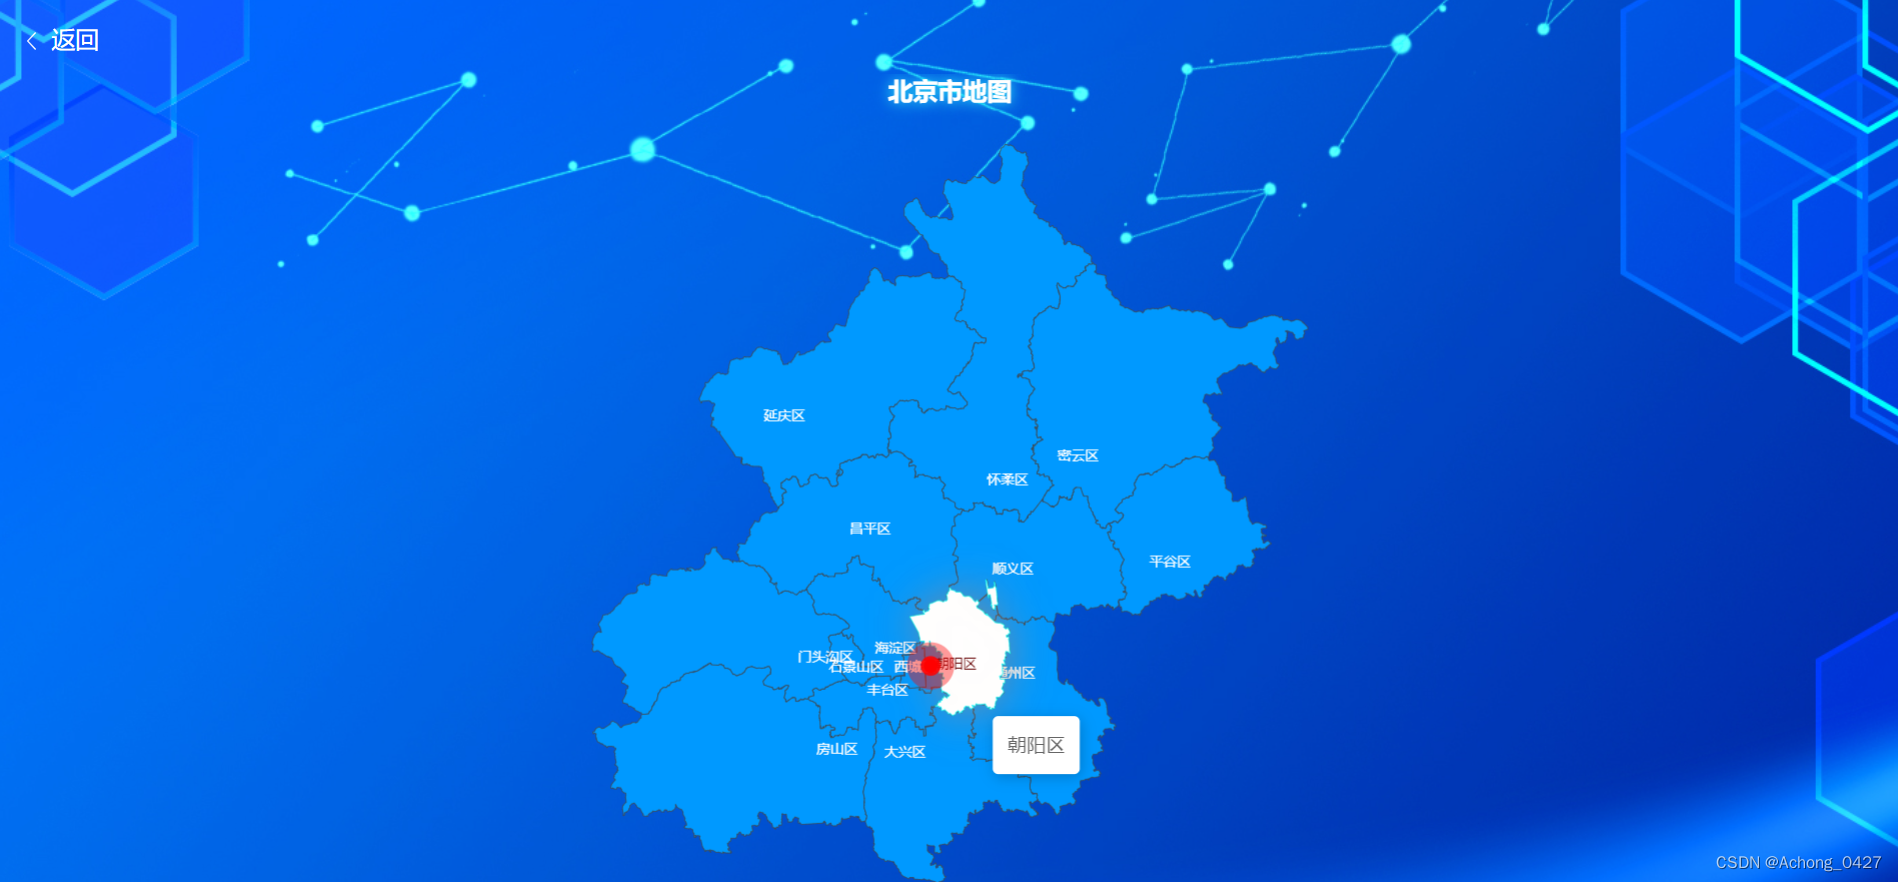
(图三)
以下图四、图五、图六是Echarts当中的常用大屏数据可视化图表是“点击此处查看更多”后跳转到下一个页面所展示出来的:
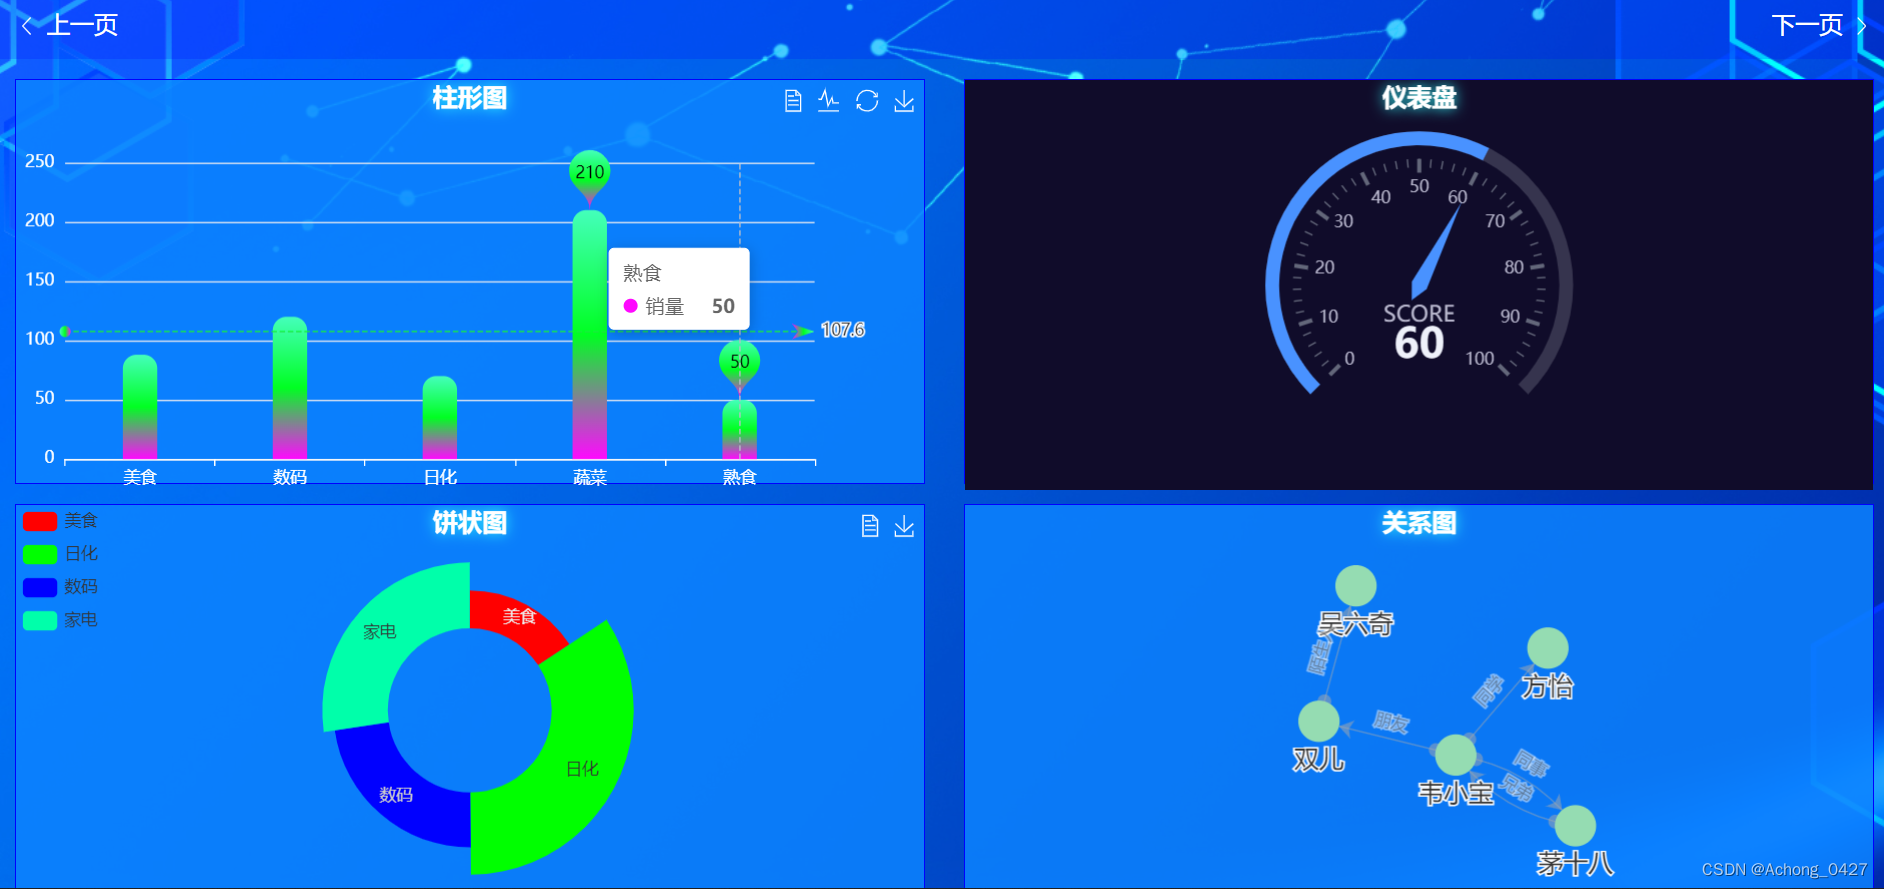
(图四)

(图五)

(图六)
以下图七是是点击“下一页”后跳转到下一个页面所展示出来的世界地图(可缩放大小),其中展示世界上所有国家的名称以及展示该国家对应的国家首都:

(图七)
在图七当中世界地图当中点击随处点击一个国家地图可跳转到对应的国家的详细城市地图(均可缩放大小),如点击图中的中国随处一处,则跳转到中国城市地图(均可缩放大小)(如下图)。
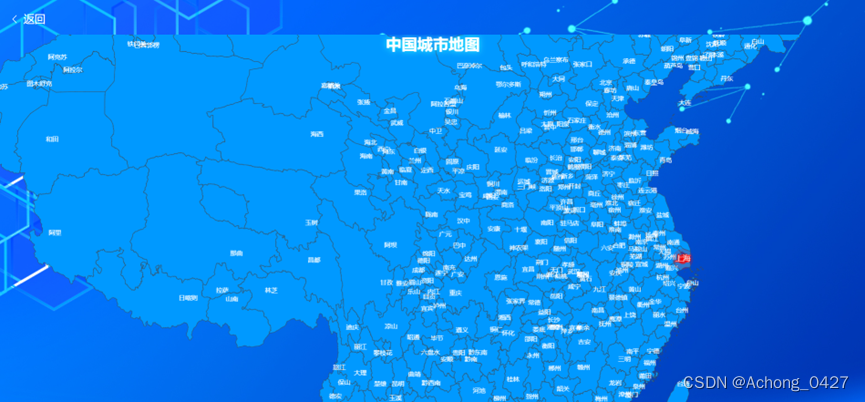
(图八)
十一:源码地址
https://gitee.com/AChong_0427/echarts
<到此结束,感谢列位收看>


 1446
1446


 被折叠的 条评论
为什么被折叠?
被折叠的 条评论
为什么被折叠?
 到【灌水乐园】发言


