


废话不多说,上图的代码,需要的可以根据他自定义线圈的每一圈的颜色进行设置他的样式或者颜色,或者透明:

(1.)第一个图表代码如下(可以自定义每一圈的颜色):
option = {
color: ["rgba(0,183,238, 1)", "rgba(86,199,60, 1)"],
tooltip: {
show: false,
trigger: "item",
color: "#fff",
},
radar: {
center: ["50%", "50%"],
radius: "70%",
startAngle: 90,
//设置总共需要多少个环形
splitNumber: 5,
shape: "circle",
splitArea: {
areaStyle: {
color: ["transparent"],
},
},
axisLabel: {
show: false,
fontSize: 20,
color: "#000",
fontStyle: "normal",
fontWeight: "normal",
},
axisLine: {
show: true,
lineStyle: {
// type: "dashed",//虚线
color: "#284db6",
},
},
// 环形的颜色
splitLine: {
show: true,
lineStyle: {
type: "dashed",
//这里定义了每一圈的颜色,因为外一层需求不要,所以设置透明,若需要百分比不超出圆环,
//可以设置max值进行限定他的最大值
color: ["transparent", "#40709b", "#40709b", "#40709b", "#40709b"],
},
},
name: {
textStyle: {
color: "#fff",
fontSize: 14,
fontWeight: 600,
fontFamily: "PingFangSC-Regular,PingFang SC",
fontStyle: "normal",
},
},
indicator: [
{
name: "三无、五保",
max: 88,
},
{
name: "低保",
max: 88,
},
{
name: "残疾",
max: 88,
},
{
name: "失独",
max: 88,
},
{
name: "高龄",
max: 88,
},
{
name: "突出贡献",
max: 88,
},
],
},
series: [
{
name: "2017年",
type: "radar",
symbol: "circle",
symbolSize: 0, //设置圆环内各个数据的圆点大小
itemStyle: {
normal: {
// color: "rgba(0,183,238, 1)",
// borderColor: "red",
// borderWidth: 10,
},
},
areaStyle: {
normal: {
opacity: 0.2,
},
},
lineStyle: {
normal: {
color: "#05e2f9",
width: 2,
},
},
data: [[60, 60, 65, 60, 70, 40]],
},
],
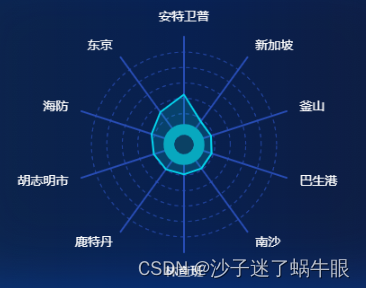
}(2.)第二个图表代码如下(数据自行填充一下,通过层级加定位,做中间空心的效果):
option =

{

          color: ["#04d5ed", "#43F4B7"],

          tooltip: {

            trigger: "item",

            position: function (point, params, dom, rect, size) {

              return point;

            },


            // position: ["30%", "10%"],

          },


          radar: [

            {


 indicator: [

                {

                  text: "第一个", //名称

                  max: 100, //最大值

                  min: -30, //最小值

                },

                {

                  text: "第二个",

                  max: 100,

                  min: -30,

                },

                {

                  text: "第三个",

                  max: 100,

                  min: -30,

                },

              ],

              center: ["50%", "50%"], // 雷达图的位置

              radius: 120, //雷达图的半径

              startAngle: 90, //旋转

              splitNumber: 7, //圆圈线的数量

              shape: "circle",

              name: {

                //外围文字样式

                formatter: "{value}",

                textStyle: {

                  color: "#fff",

                  fontSize: 14,

                  fontWeight: 500,

                  fontFamily: "PingFangSC-Regular,PingFang SC",

                  fontStyle: "normal",

                },

              },

              splitArea: {

                show: false,

                areaStyle: {

                  color: ["#77EADF", "#26C3BE", "#64AFE9", "#428BD4"],

                  shadowColor: "rgba(0, 0, 0, 0.2)",

                  shadowBlur: 10,

                },

              },

              axisLine: {

                lineStyle: {

                  // symbolSize:[220,150],

                  color: "#284db6",

                  width: 2,

                },

              },

              axisTick: {

                show: false,

                length: 13,

                lineStyle: {

                  color: "tomato",

                  cap: "round",

                },

              },

              splitLine: {

                lineStyle: {

                  type: "dashed",

                  width: 1,


                  // color: '#1F505F'

                  color: [

                    // 给每一条分割线颜色来控制分割线数量

                    "transparent",

                    "#284db6",

                    "#284db6",

                    "#284db6",

                    "#284db6",

                    "#284db6",

                    "#284db6",

                  ],

                },

              },

            },

          ],

          series: [

//最外层雷达的数据,通过z设置他为最高层级,所以hove不会触发他下面的中空圆心,也是赋值的地方

            {

              z: 3,

              name: "雷达图",

              type: "radar",

              symbolSize: 0, //设置圆环内各个数据的圆点大小

              emphasis: {

                lineStyle: {

                  width: 2, //鼠标hover时候线条的粗细和颜色

                },

              },

              data: [

                {

                  value: [10,20,30],

                  name: "",

                  areaStyle: {

                    color: "#03c6e0",

                    opacity: 0.2,

                  },

                },

              ],

            },

            {

//假的环形,也就是那个内部比较粗一点的环形,给死假数据

              z: 1,

              type: "pie",

              name: "",

//设置它的大小和居中

              radius: ["7%", "15%"],

              center: ["50%", "50%"],

              hoverAnimation: false,

              startAngle: 200,

              itemStyle: {

                normal: {

                  color: "#09a0b7", //中心圆环颜色

                },

              },

              label: {

                show: false,

              },

              data: [0],

            },

            {

//中空效果,设置和背景色取值一样即可,也通过中心定位设置位置,值写死

              z: 2,

              type: "pie",

              name: "",

              radius: ["0%", "7%"],

              center: ["50%", "50%"],

              hoverAnimation: false,

              startAngle: 200,

              itemStyle: {

                normal: {

                  color: "#0d1f45", //中心圆环颜色

                },

              },

              label: {

                show: false,

              },

              data: [0],

            },

          ],

        },


 2431
2431


 被折叠的 条评论
为什么被折叠?
被折叠的 条评论
为什么被折叠?
 到【灌水乐园】发言


