


echarts 折线组件
<template>
  <div class="lineChartsTemplate" :id="chartsId"></div>
</template>

<script>
export default {
  name: "lineChartsTemplate",
  components: {},
  props: {
    xData: {
      type: Array,
      default: () => [],
    },
    yData: {
      type: Array,
      default: () => [],
    },
    lineColor: {
      type: String,
      default: "#F1924E",
    },
    title: {
      type: String,
      default: "",
    },
    chartsId: {
      type: String,
      default: "",
    },
  },
  watch: {
    xData(newValue, oldValue) {
      if (newValue) {
        this.initLineChartsTemplate();
      }
    },
  },
  data() {
    return {
      myChart: null,
    };
  },
  methods: {
    initLineChartsTemplate() {
      let option = {
        tooltip: {
          trigger: "axis",
          axisPointer: {
            type: "line", // 默认为直线,可选为:'line' | 'shadow'
          },
          borderColor: this.lineColor, // 边框颜色
        }, // 坐标轴指示器配置
        title: {
          text: this.title,
          left: "center",
          top: "5%",
          textStyle: {
            color: "#000",
            fontSize: 14,
            align: "center",
          },
        },
        textStyle: {
          color: "#333333", // xy轴的提示文字颜色,不包含背景刻度线
        },
        color: [this.lineColor],
        grid: {
          top: "20%",
          left: "50px",
          right: "20px",
          bottom: "35px",
        },
        xAxis: [
          {
            type: "category",
            data: this.xData,
            axisLine: {
              show: true,
              lineStyle: {
                color: "#333333",
                // width: 0,
                type: "solid",
              }, // x轴线的颜色以及宽度
            },
            // axisLabel: {
            //   show: true,
            //   textStyle: {
            //     color: "rgba(255, 255, 255, 0.3)",
            //   }
            // }, // x轴文字的配置
            splitLine: {
              show: false,
              lineStyle: {}, // 分割线配置
            },
            axisTick: {
              show: false,
            }, // x轴的刻度线
          },
        ],
        yAxis: [
          {
            type: "value",
            splitLine: {
              show: true,
              lineStyle: {
                color: "#333333",
                opacity: 0.1,
              }, // 设置横向的线的颜色
            },
            axisLabel: {
              show: true,
              margin: 20,
              // textStyle: {
              //   color: "rgba(255, 255, 255, 0.3)",
              // }, // y轴的字体配置
            },
          },
        ],
        series: [
          {
            data: this.yData,
            type: "line",
            smooth: true,
          },
        ],
      };
      this.myChart = this.$echarts.init(document.getElementById(this.chartsId));
      this.myChart.setOption(option);

      window.addEventListener("resize", () => {
        this.myChart.resize();
      });
    },
  },
  created() {},
  mounted() {
    this.initLineChartsTemplate();
  },
  beforeDestroy() {
    if (this.myChart) {
      this.myChart.dispose();
    }
  },
};
</script>

<style lang="scss" scoped>
.lineChartsTemplate {
  width: 100%;
  height: 100%;
}
</style>
父组件中使用
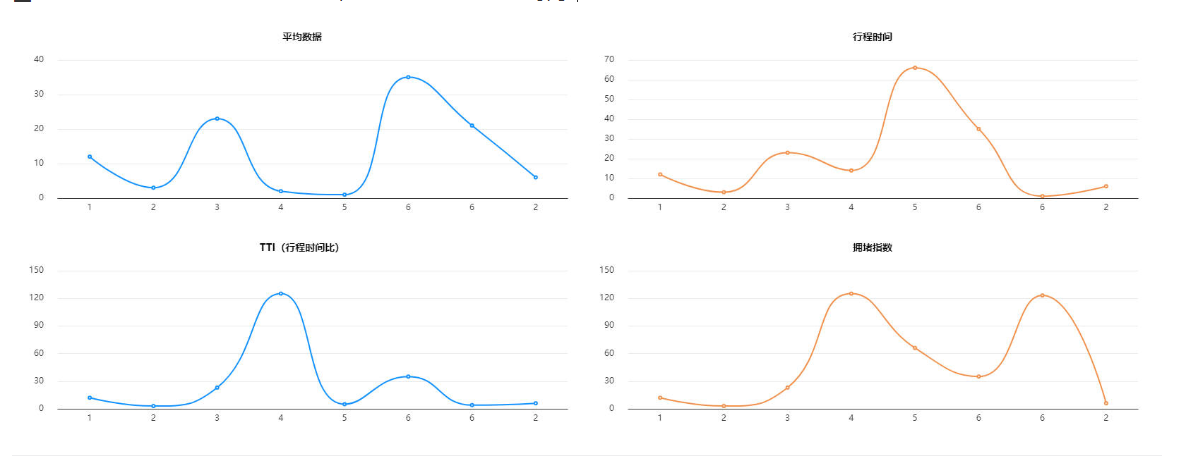
假数据版
<div class="trendAnalysis-charts" v-if="!isShowTable">
      <div id="myChartBox1" class="charts">
        <lineChartsTemplate ref="lineChartsTemplate"
                            :chartsId="'charts1'"
                            :title="'平均数据'"
                            :lineColor="'#1492FF'"
                            :xData="[1, 2, 3, 4, 5 ,6 , 6,2]"
                            :yData="[12, 3, 23, 2, 1, 35, 21 ,6]"
        />
      </div>

      <div id="myChartBox2" class="charts">
        <lineChartsTemplate ref="lineChartsTemplate"
                            :chartsId="'charts2'"
                            :title="'行程时间'"
                            :xData="[1, 2, 3, 4, 5 ,6 , 6,2]"
                            :yData="[12, 3, 23, 14, 66, 35, 1 ,6]"
        />
      </div>

      <div id="myChartBox3" class="charts">
        <lineChartsTemplate ref="lineChartsTemplate"
                            :chartsId="'charts3'"
                            :title="'TTI(行程时间比)'"
                            :lineColor="'#1492FF'"
                            :xData="[1, 2, 3, 4, 5 ,6 , 6,2]"
                            :yData="[12, 3, 23, 125, 5, 35, 4 ,6]"
        />
      </div>

      <div id="myChartBox4" class="charts">
        <lineChartsTemplate ref="lineChartsTemplate"
                            :chartsId="'charts4'"
                            :title="'拥堵指数'"
                            :xData="[1, 2, 3, 4, 5 ,6 , 6,2]"
                            :yData="[12, 3, 23, 125, 66, 35, 123 ,6]"
        />
      </div>
    </div>


import lineChartsTemplate from './lineChartsTemplate'

  components: {
    lineChartsTemplate
  },


      // 直接替换 xData yData title chartsId lineColor 即可
动态获取数据版
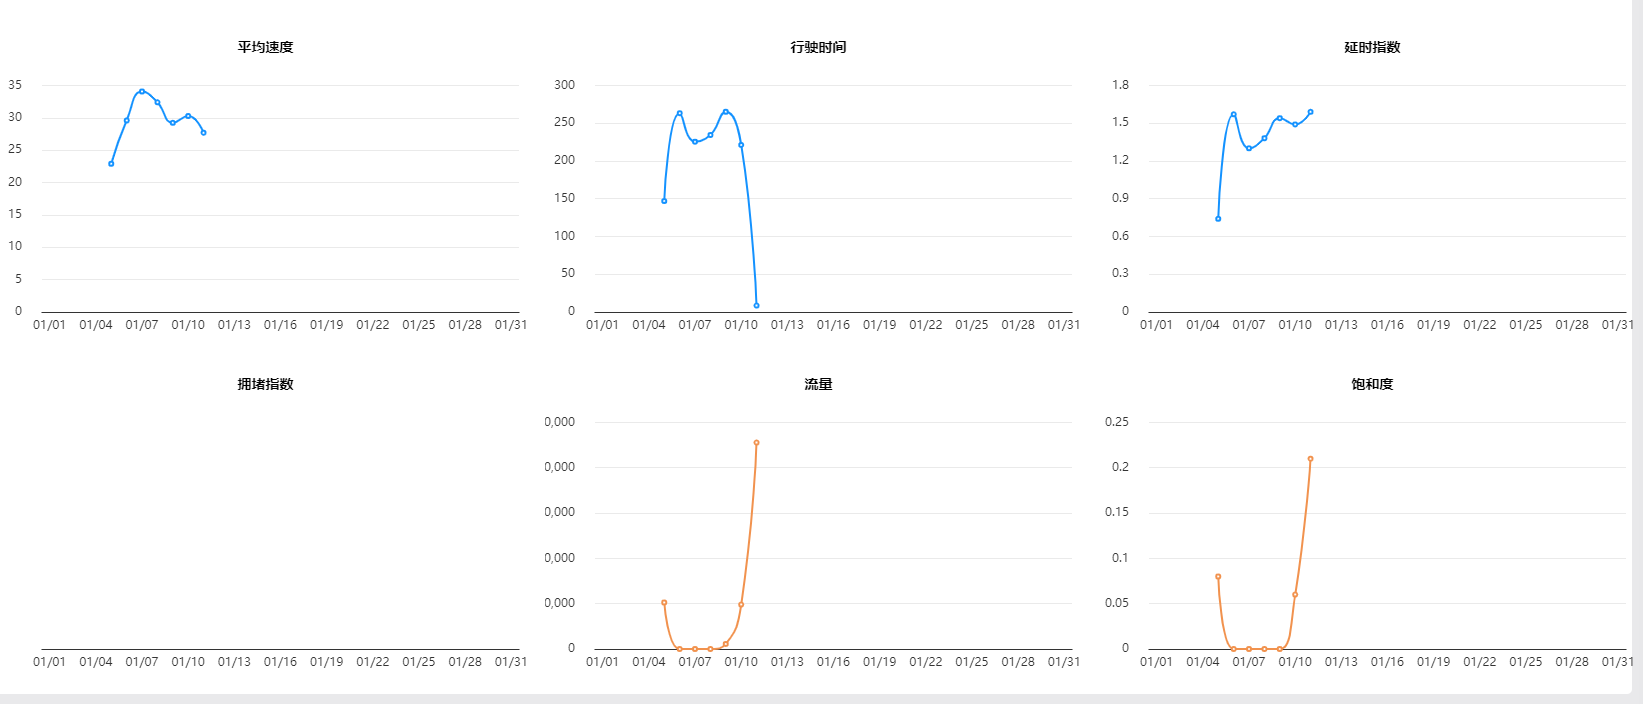
 <div class="chartsPage-charts">
      <div class="charts" v-for="(item, index) in chartsData" :key="index">
        <lineChartsTemplate
          ref="lineChartsTemplate"
          :charts-id="'charts' + index"
          :title="item.title"
          :line-color="item.lineColor"
          :x-data="item.xData"
          :y-data="item.yData"
        ></lineChartsTemplate>
      </div>
    </div>

import lineChartsTemplate from "@/views/statisticAnalysis/trendAnalysis/lineChartsTemplate.vue";
import { getRoadTrendChart } from "@/api/xxx"; // 接口

  components: {
    lineChartsTemplate,
  },

  data() {
    return {
      chartsData: [
        {
          title: "平均速度",
          lineColor: "#1492FF",
          xData: [],
          yData: [],
        },
        {
          title: "行驶时间",
          lineColor: "#1492FF",
          xData: [],
          yData: [],
        },
        {
          title: "延时指数",
          lineColor: "#1492FF",
          xData: [],
          yData: [],
        },
        {
          title: "拥堵指数",
          xData: [],
          yData: [],
        },
        {
          title: "流量",
          xData: [],
          yData: [],
        },
        {
          title: "饱和度",
          xData: [],
          yData: [],
        },
      ],
    };
  },

        methods: {
    getChartsData() {
      let { queryAllTime, ...obj } = this.paginationConfig;
      getRoadTrendChart(obj).then((res) => {
        this.chartsData.forEach((item, index) => {
          switch (item.title) {
            case "平均速度":
              item.xData = res.data.avgSpeedChart[1];
              item.yData = res.data.avgSpeedChart[0];
              break;
            case "行驶时间":
              item.xData = res.data.driveTimeChart[1];
              item.yData = res.data.driveTimeChart[0];
              break;
            case "延时指数":
              item.xData = res.data.driveTimeRatioChart[1];
              item.yData = res.data.driveTimeRatioChart[0];
              break;
            case "拥堵指数":
              item.xData = res.data.normChart[1];
              item.yData = res.data.normChart[0];
              break;
            case "流量":
              item.xData = res.data.driveFlowChart[1];
              item.yData = res.data.driveFlowChart[0];
              break;
            case "饱和度":
              item.xData = res.data.saturationChart[1];
              item.yData = res.data.saturationChart[0];
              break;
          }
        });
      });
    },
  },
  created() {
    this.getChartsData();
  },


<style lang="scss" scoped>
.chartsPage {
  &-charts {
    height: calc(100vh - 236px);
    display: flex;
    justify-content: space-between;
    flex-wrap: wrap;

    .charts {
      width: calc(33% - 8px);
      height: calc(50% - 10px);
    }
  }
}
</style>
数据格式如下:
{
"code": 1,
"message": "success",
"data": {
"avgSpeedChart": [
[
null,
null,
null,
null,
22.8,
24.98,
26.79,
27.6,
26.39,
27.71,
29.66,
null,
null,
null,
null,
null,
null,
null,
null,
null,
null,
null,
null,
null,
null,
null,
null,
null,
null,
null,
null
],
[
"01/01",
"01/02",
"01/03",
"01/04",
"01/05",
"01/06",
"01/07",
"01/08",
"01/09",
"01/10",
"01/11",
"01/12",
"01/13",
"01/14",
"01/15",
"01/16",
"01/17",
"01/18",
"01/19",
"01/20",
"01/21",
"01/22",
"01/23",
"01/24",
"01/25",
"01/26",
"01/27",
"01/28",
"01/29",
"01/30",
"01/31"
]
],
"driveTimeChart": [
[
null,
null,
null,
null,
243.96,
546.12,
489.45,
491.25,
539.62,
411.25,
16.28,
null,
null,
null,
null,
null,
null,
null,
null,
null,
null,
null,
null,
null,
null,
null,
null,
null,
null,
null,
null
],
[
"01/01",
"01/02",
"01/03",
"01/04",
"01/05",
"01/06",
"01/07",
"01/08",
"01/09",
"01/10",
"01/11",
"01/12",
"01/13",
"01/14",
"01/15",
"01/16",
"01/17",
"01/18",
"01/19",
"01/20",
"01/21",
"01/22",
"01/23",
"01/24",
"01/25",
"01/26",
"01/27",
"01/28",
"01/29",
"01/30",
"01/31"
]
],
"driveTimeRatioChart": [
[
null,
null,
null,
null,
0.74,
1.27,
1.49,
1.47,
1.53,
1.46,
1.37,
null,
null,
null,
null,
null,
null,
null,
null,
null,
null,
null,
null,
null,
null,
null,
null,
null,
null,
null,
null
],
[
"01/01",
"01/02",
"01/03",
"01/04",
"01/05",
"01/06",
"01/07",
"01/08",
"01/09",
"01/10",
"01/11",
"01/12",
"01/13",
"01/14",
"01/15",
"01/16",
"01/17",
"01/18",
"01/19",
"01/20",
"01/21",
"01/22",
"01/23",
"01/24",
"01/25",
"01/26",
"01/27",
"01/28",
"01/29",
"01/30",
"01/31"
]
],
"normChart": [
[
null,
null,
null,
null,
null,
null,
null,
null,
null,
null,
null,
null,
null,
null,
null,
null,
null,
null,
null,
null,
null,
null,
null,
null,
null,
null,
null,
null,
null,
null,
null
],
[
"01/01",
"01/02",
"01/03",
"01/04",
"01/05",
"01/06",
"01/07",
"01/08",
"01/09",
"01/10",
"01/11",
"01/12",
"01/13",
"01/14",
"01/15",
"01/16",
"01/17",
"01/18",
"01/19",
"01/20",
"01/21",
"01/22",
"01/23",
"01/24",
"01/25",
"01/26",
"01/27",
"01/28",
"01/29",
"01/30",
"01/31"
]
],
"driveFlowChart": [
[
null,
null,
null,
null,
13017,
0,
0,
0,
1857,
12917,
59425,
null,
null,
null,
null,
null,
null,
null,
null,
null,
null,
null,
null,
null,
null,
null,
null,
null,
null,
null,
null
],
[
"01/01",
"01/02",
"01/03",
"01/04",
"01/05",
"01/06",
"01/07",
"01/08",
"01/09",
"01/10",
"01/11",
"01/12",
"01/13",
"01/14",
"01/15",
"01/16",
"01/17",
"01/18",
"01/19",
"01/20",
"01/21",
"01/22",
"01/23",
"01/24",
"01/25",
"01/26",
"01/27",
"01/28",
"01/29",
"01/30",
"01/31"
]
],
"saturationChart": [
[
null,
null,
null,
null,
0.09,
0.0,
0.0,
0.0,
0.01,
0.06,
0.23,
null,
null,
null,
null,
null,
null,
null,
null,
null,
null,
null,
null,
null,
null,
null,
null,
null,
null,
null,
null
],
[
"01/01",
"01/02",
"01/03",
"01/04",
"01/05",
"01/06",
"01/07",
"01/08",
"01/09",
"01/10",
"01/11",
"01/12",
"01/13",
"01/14",
"01/15",
"01/16",
"01/17",
"01/18",
"01/19",
"01/20",
"01/21",
"01/22",
"01/23",
"01/24",
"01/25",
"01/26",
"01/27",
"01/28",
"01/29",
"01/30",
"01/31"
]
]
}
}


 5753
5753


 被折叠的 条评论
为什么被折叠?
被折叠的 条评论
为什么被折叠?
 到【灌水乐园】发言


