


State Machine Diagrams | Unified Modeling Language (UML) - GeeksforGeeks
State Machine Diagrams | Unified Modeling Language (UML)
Last Updated : 03 Jan, 2025
A State Machine Diagram is used to represent the condition of the system or part of the system at finite instances of time. It’s a behavioral diagram and it represents the behavior using finite state transitions. In this article, we will explain what is a state machine diagram, the components, and the use cases of the state machine diagram.
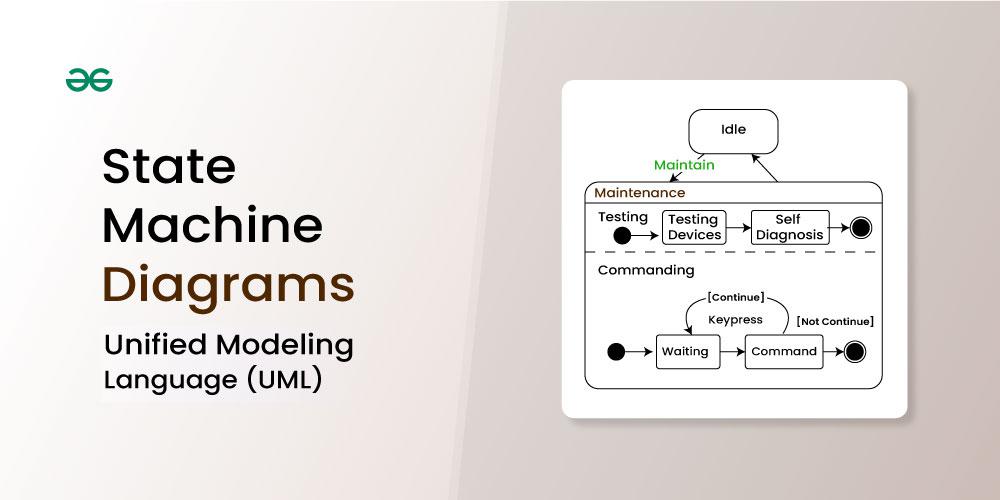
Table of Content
- What is a State Machine Diagram?
- Basic components and notations of a State Machine diagram
- UseCases of State Machine Diagram
- What are the Differences between a State Machine Diagram and a Flowchart?
What is a State Machine Diagram?
A state diagram is a uml diagram which is used to represent the condition of the system or part of the system at finite instances of time. It’s a behavioral diagram and it represents the behavior using finite state transitions.
- State Machine diagrams are also known as State Diagrams and State-Chart Diagrams. These both terms can be used interchangeably.
- A state machine diagram is used to model the dynamic behavior of a class in response to time and changing external stimuli( eventS that causes system to changes its state from one to another).
- We can say that each and every class has a state but we don’t model every class using State Machine diagrams.
Let’s understand State Machine Diagram with the help user verification example:
Example:
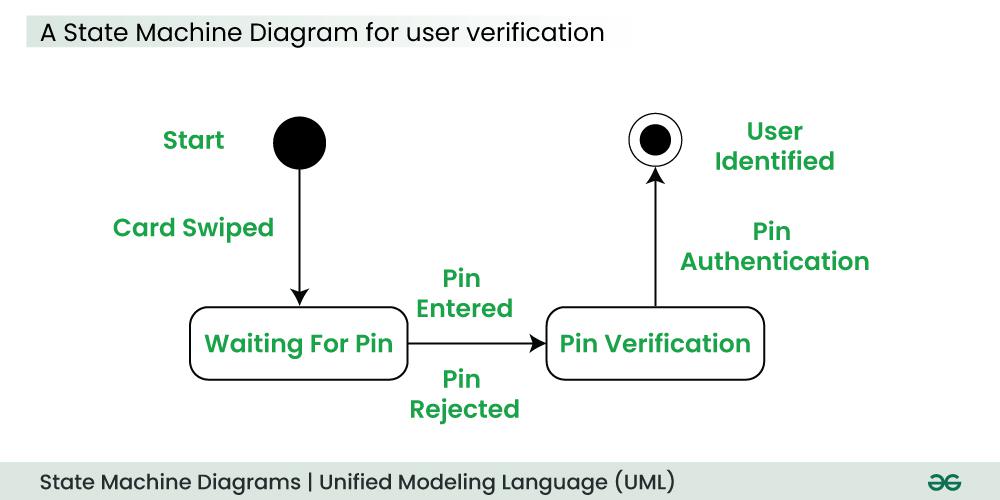
The State Machine Diagram above shows the different states in which the verification sub-system or class exist for a particular system.
Basic components and notations of a State Machine diagram
Below are the basic components and their notations of a State Machine Diagram:
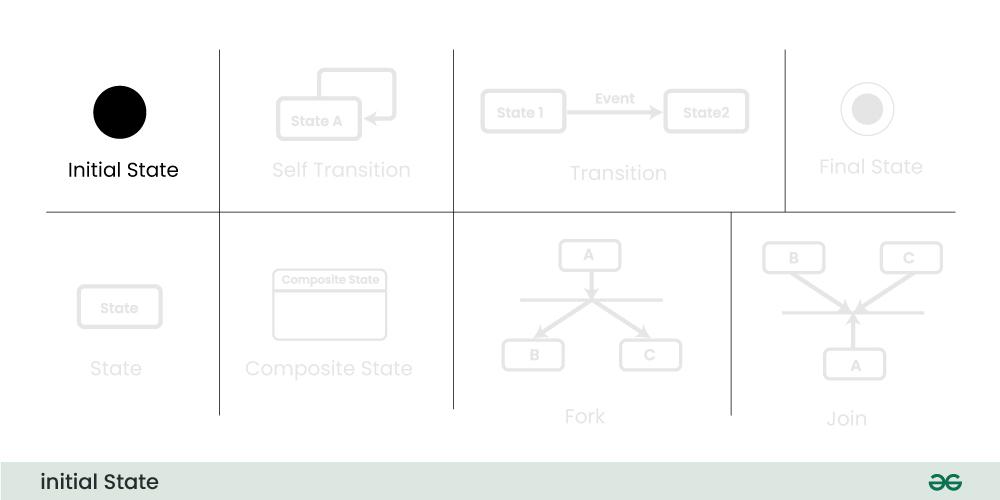
1. Initial state
We use a black filled circle represent the initial state of a System or a Class.
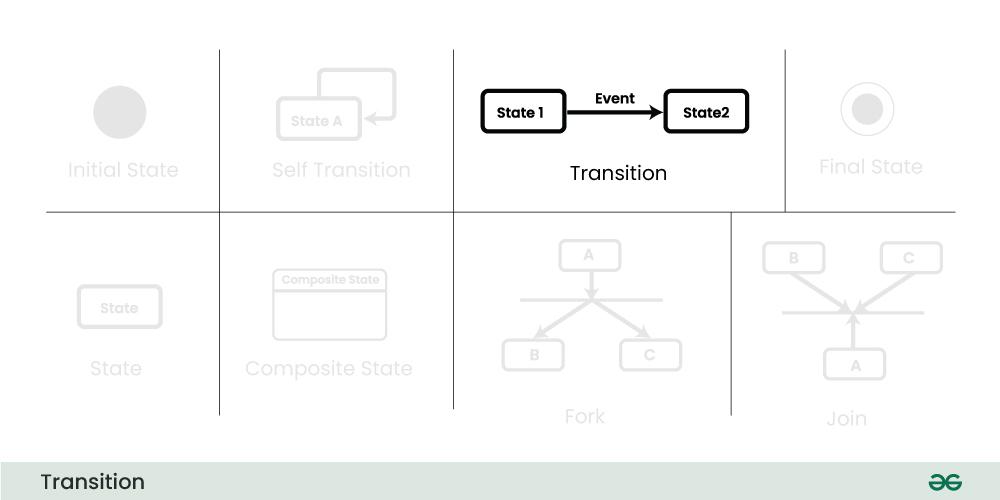
2. Transition
We use a solid arrow to represent the transition or change of control from one state to another. The arrow is labelled with the event which causes the change in state.
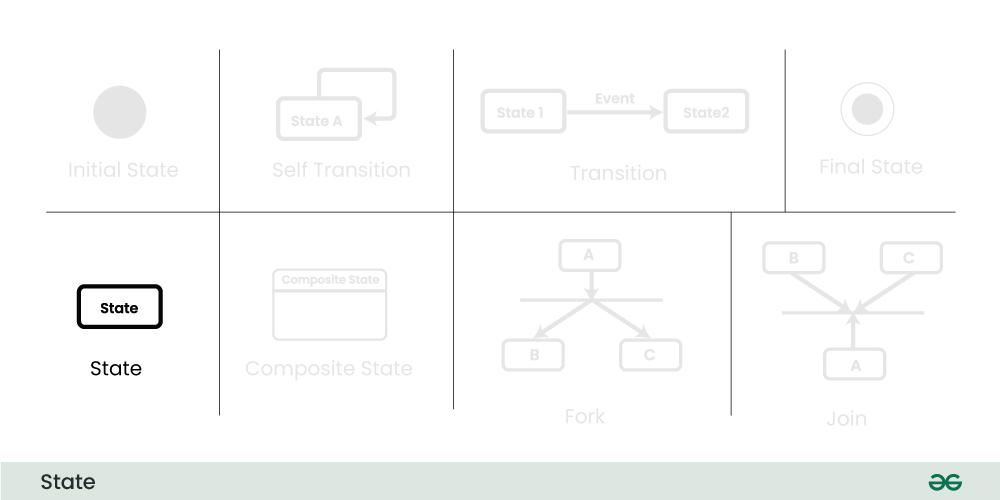
3. State
We use a rounded rectangle to represent a state. A state represents the conditions or circumstances of an object of a class at an instant of time.
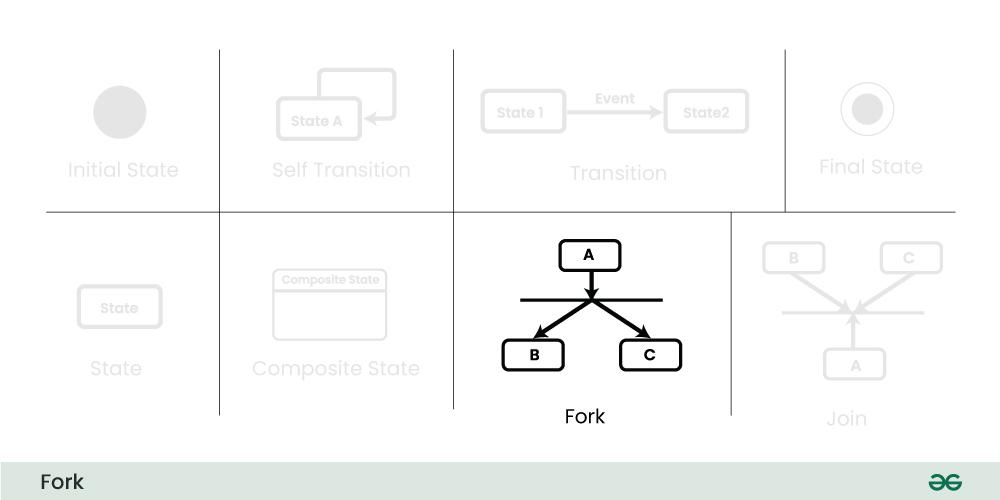
4. Fork
We use a rounded solid rectangular bar to represent a Fork notation with incoming arrow from the parent state and outgoing arrows towards the newly created states. We use the fork notation to represent a state splitting into two or more concurrent states.
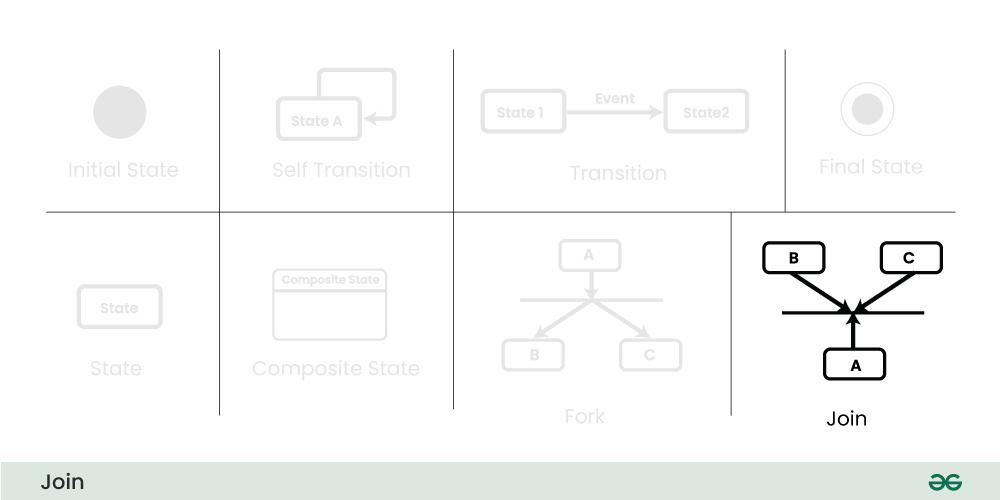
5. Join
We use a rounded solid rectangular bar to represent a Join notation with incoming arrows from the joining states and outgoing arrow towards the common goal state. We use the join notation when two or more states concurrently converge into one on the occurrence of an event or events.
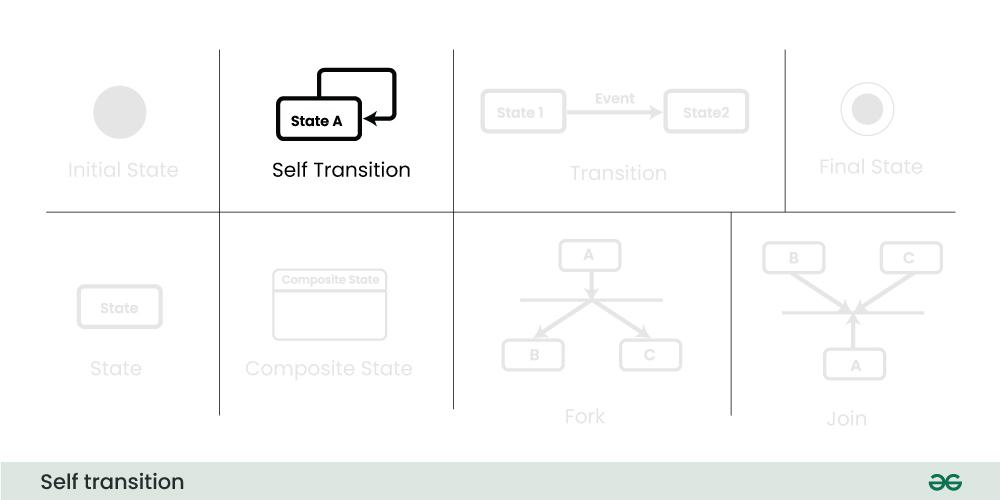
6. Self transition
We use a solid arrow pointing back to the state itself to represent a self transition. There might be scenarios when the state of the object does not change upon the occurrence of an event. We use self transitions to represent such cases.
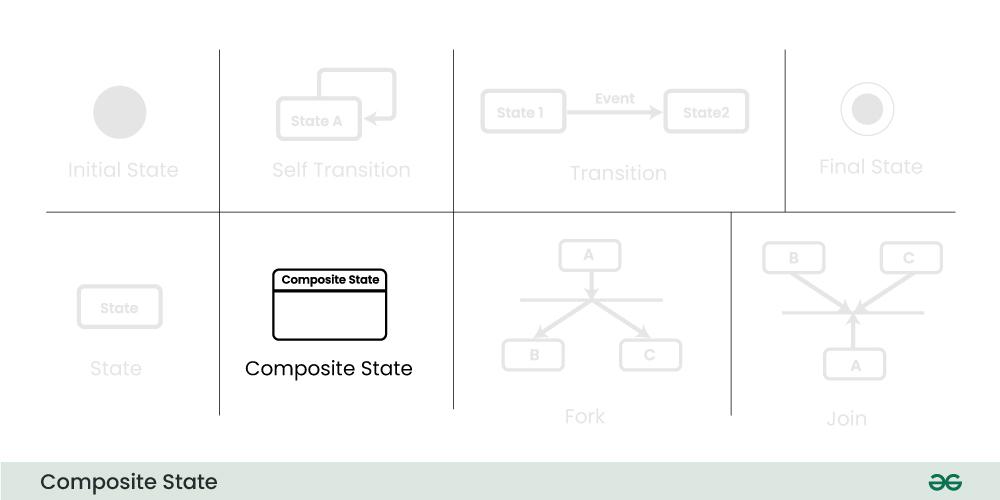
7. Composite state
We use a rounded rectangle to represent a composite state also. We represent a state with internal activities using a composite state.
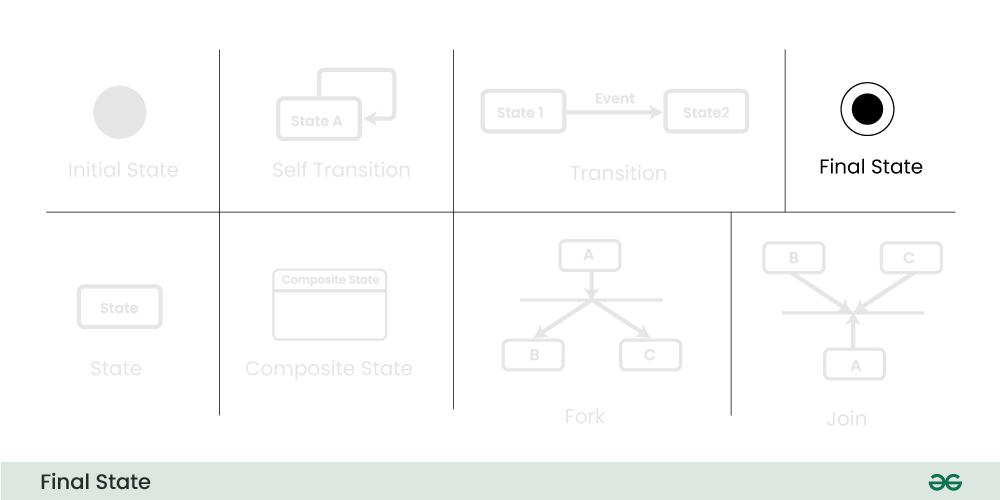
8. Final State
We use a filled circle within a circle notation to represent the final state in a state machine diagram.
How to draw a State Machine diagram in UML?
Below are the steps of how to draw the State Machine Diagram in UML:
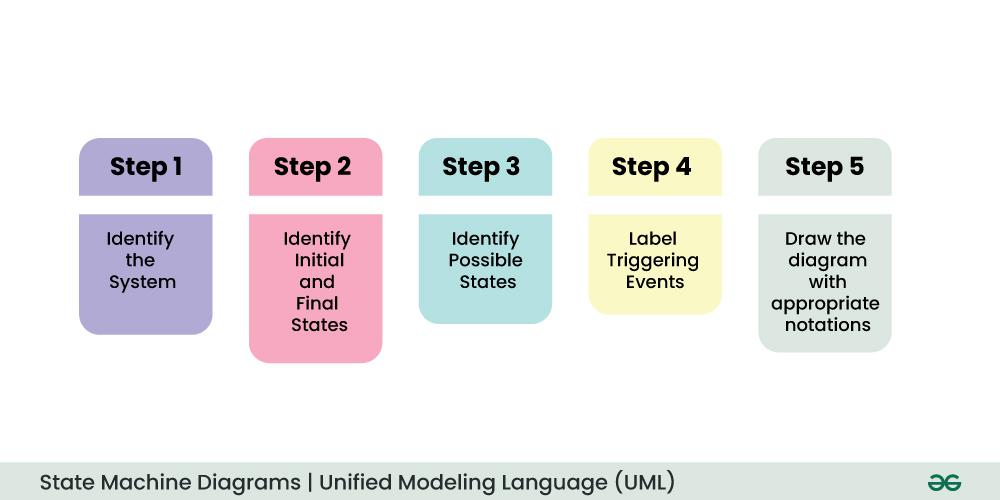
Step1. Identify the System:
- Understand what your diagram is representing.
- Whether it’s a machine, a process, or any object, know what different situations or conditions it might go through.
Step2. Identify Initial and Final States:
- Figure out where your system starts (initial state) and where it ends (final state).
- These are like the beginning and the end points of your system’s journey.
Step3. Identify Possible States:
- Think about all the different situations your system can be in.
- These are like the various phases or conditions it experiences.
- Use boundary values to guide you in defining these states.
Step4. Label Triggering Events:
- Understand what causes your system to move from one state to another.
- These causes or conditions are the events.
- Label each transition with what makes it happen.
Step5. Draw the Diagram with appropriate notations:
- Now, take all this information and draw it out.
- Use rectangles for states, arrows for transitions, and circles or rounded rectangles for initial and final states.
- Be sure to connect everything in a way that makes sense.
Let’s understand State Machine diagram with the help of an example, ie for an online order :
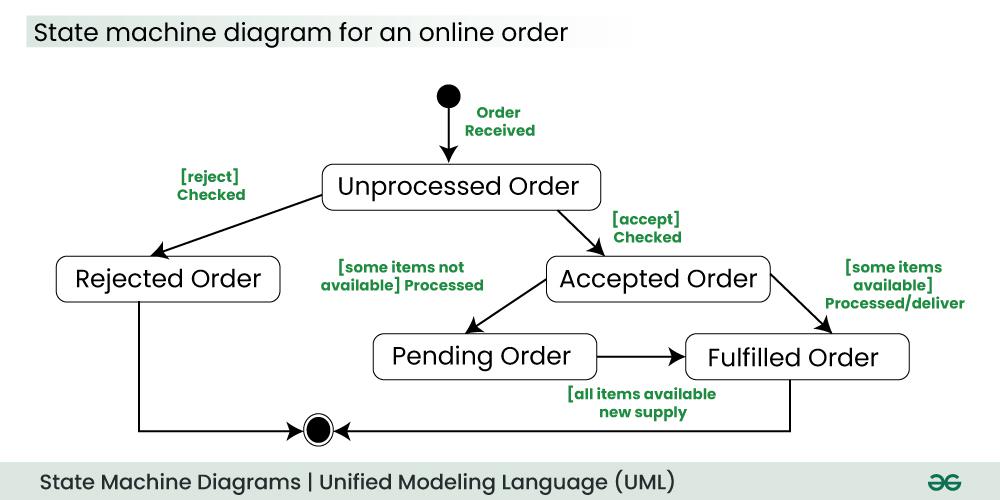
The UML diagrams we draw depend on the system we aim to represent. Here is just an example of how an online ordering system might look like :
- On the event of an order being received, we transit from our initial state to Unprocessed order state.
- The unprocessed order is then checked.
- If the order is rejected, we transit to the Rejected Order state.
- If the order is accepted and we have the items available we transit to the fulfilled order state.
- However if the items are not available we transit to the Pending Order state.
- After the order is fulfilled, we transit to the final state. In this example, we merge the two states i.e. Fulfilled order and Rejected order into one final state.
Note: Here we could have also treated fulfilled order and rejected order as final states separately.
Applications of State Machine Diagram
Below are the main use cases of state machine diagram:
- State Machine Diagrams are very useful for modeling and visualizing the dynamic behavior of a system.
- They are also used in UI design where they help to illustrate how the interface changes in response to user actions, helping designers to create a better use experience.
- In game design, state machine diagrams can help model the behavior of characters or objects, detailing how they change states based on player interactions or game events
- In embedded systems, where hardware interacts with software to perform tasks, State Machine Diagrams are valuable for representing the control logic and behavior of the system.
What are the Differences between a State Machine Diagram and a Flowchart?
Before understanding the differences between a state machine diagram and a flowchart, firstly understand what is a flowchart:
What is a Flowchart?
An algorithm is like a set of clear instructions to solve a problem, and a flowchart is a picture that shows those instructions.
- When we’re writing computer programs, a flowchart helps us map out the steps of the algorithm to solve the problem.
- Non programmers use Flow charts to model workflows.
- We can call a flowchart a primitive version of an activity diagram.
- Business processes where decision making is involved is expressed using a flow chart.
Example:
A manufacturer uses a flow chart to explain and illustrate how a particular product is manufactured.
State Machine Diagram vs. Flow Chart?
Below are the main differences between a state machine diagram and a flowchart:
| State Machine Diagram | Flow Chart |
|---|---|
| An State Machine Diagram is associated with the UML(Unified Modelling Language) | A Flow Chart is associated with the programming. |
| The basic purpose of a state machine diagram is to portray various changes in state of the class and not the processes or commands causing the changes. | A flowchart on the other hand portrays the processes or commands that on execution change the state of class or an object of the class. |
| Primarily used for systems, emphasizing their states and transitions. | Often used for processes, procedures, or algorithms involving actions and decisions. |
Conclusion
State Machine Diagrams in UML are like pictures that tell us how things change in a system. They show the different situations a system can be in and how it moves between them. These diagrams help us understand what events make these changes happen. Whether it’s for designing software or explaining how something works, State Machine Diagrams are like visual guides that make it easier to see and understand how a system behaves in different situations.
**什么是状态机图?**
状态机图(State Machine Diagram)是统一建模语言(UML)中的一种行为图,用于表示系统或类在有限时间点上的状态及其转换。它通过有限状态转换描述对象的行为,适用于建模动态响应外部事件或时间变化的系统。
别名:状态图(State Diagram)、状态转移图(State-Chart Diagram)。
核心作用:
- 描述对象在生命周期内的状态变化。
- 展示事件如何触发状态转换。
示例:用户验证子系统的状态机图
A-State-Machine-Diagram-for-user-verification
图中展示了用户验证子系统的状态流转,如“未验证”→“验证中”→“已验证/验证失败”。
状态机图的基本组件与符号
-
初始状态(Initial State)
- 符号:黑色实心圆(⚫)。
- 含义:系统或对象的起始状态。
initial-State-(1)
-
转移(Transition)
- 符号:实线箭头(→),标注触发事件。
- 示例:
[事件]→ 状态A → 状态B。
transition
-
状态(State)
- 符号:圆角矩形(▭)。
- 含义:对象在某一时刻的条件或状况。
state
-
分支(Fork)
- 符号:实心圆角矩形条(▮),表示状态拆分为多个并发状态。
- 示例:订单处理拆分为“支付处理”和“库存检查”。
fork-(1)
-
合并(Join)
- 符号:同分支符号,表示多个并发状态合并为单一状态。
- 示例:支付成功且库存充足后合并为“订单完成”。
join-(1)
-
自转移(Self Transition)
- 符号:箭头指向自身(↻)。
- 含义:事件触发后状态未改变(如“刷新页面”)。
self-transition
-
组合状态(Composite State)
- 符号:包含子状态的圆角矩形。
- 示例:“配送中”状态包含“已出库”“运输中”“已送达”等子状态。
composite-state
-
终止状态(Final State)
- 符号:空心圆套实心圆(Ⓞ)。
- 含义:系统或对象的结束状态。
final-state-(1)
**如何绘制状态机图?**
步骤:
- 确定系统范围:明确建模对象(如订单处理系统)。
- 标记初始与终止状态:定义起点(⚫)和终点(Ⓞ)。
- 识别所有可能状态:列出对象的所有条件(如“未处理”“已付款”“已发货”)。
- 标注触发事件:为每个转移添加事件(如“用户付款”“库存检查通过”)。
- 使用符号绘制图表:
- 状态用圆角矩形,转移用箭头,分支/合并用实心条。
- 复杂逻辑使用组合状态或条件守卫(
[条件])。
示例:在线订单状态机图
state-machine-diagram-for-an-online-order
图中展示了订单从“未处理”到“已完成”或“已拒绝”的状态流转。
状态机图的应用场景
- 系统行为建模:
- 描述嵌入式系统的控制逻辑(如智能家居设备状态)。
- 用户界面设计:
- 展示界面状态变化(如按钮“禁用”→“启用”)。
- 游戏开发:
- 建模游戏角色的行为(如“站立”→“奔跑”→“攻击”)。
- 业务流程管理:
- 跟踪订单生命周期(如“创建”→“支付”→“配送”)。
状态机图与流程图的区别
| 状态机图 | 流程图 |
|---|---|
| 关注对象的状态变化及触发事件。 | 关注流程步骤及决策逻辑。 |
| 适用于描述系统的动态行为(如订单状态流转)。 | 适用于描述算法或业务流程的执行顺序。 |
| 符号包含状态、转移、分支/合并等。 | 符号包含开始/结束节点、处理步骤、判断框等。 |
| 示例:用户登录状态图。 | 示例:订单处理流程图。 |
流程图示例:
flowchart-example
展示产品制造步骤,如“原料采购”→“加工”→“质检”。
总结
状态机图是UML中用于可视化对象状态变化的核心工具,通过状态、转移和事件描述系统的动态行为。它在软件设计、嵌入式系统和业务流程建模中广泛应用,帮助团队清晰理解复杂的状态流转逻辑。
关键点:
- 状态机图强调“对象在什么条件下做什么”。
- 流程图强调“步骤如何按顺序执行”。
类比:
- 状态机图像交通信号灯,展示不同状态(红灯、绿灯)及切换条件。
- 流程图像烹饪食谱,按步骤指导如何完成一道菜。


 被折叠的 条评论
为什么被折叠?
被折叠的 条评论
为什么被折叠?
 到【灌水乐园】发言


