


【实验原理】
pyecharts是一款将python与echarts结合的强大的数据可视化工具.
基本上所有的图表类型都是这样绘制的:
- chart_name = Type() 初始化具体类型图表。
- add() 加数据及配置项。
- render() 生成 .html 文件。
【实验环境】
IE9 以上或Chrome(推荐)或Firefox等浏览器、pycharm 、Jupyter notebook等编程环境。
一、pyecharts的安装
安装pyecharts
安装最新版本:
pip install pyecharts
导入pyecharts库
import pyecharts
测试当前pyecharts版本
print(pyecharts.__version__)二、使用pyecharts绘制图表
第一个pyecharts小程序
用pyecharts创建柱形图、
A)导入库文件
代码:
from pyecharts.charts import Bar

from pyecharts import options as opts
B) 创建图表
代码:
bar = (Bar())C)为图表添加数据
代码:
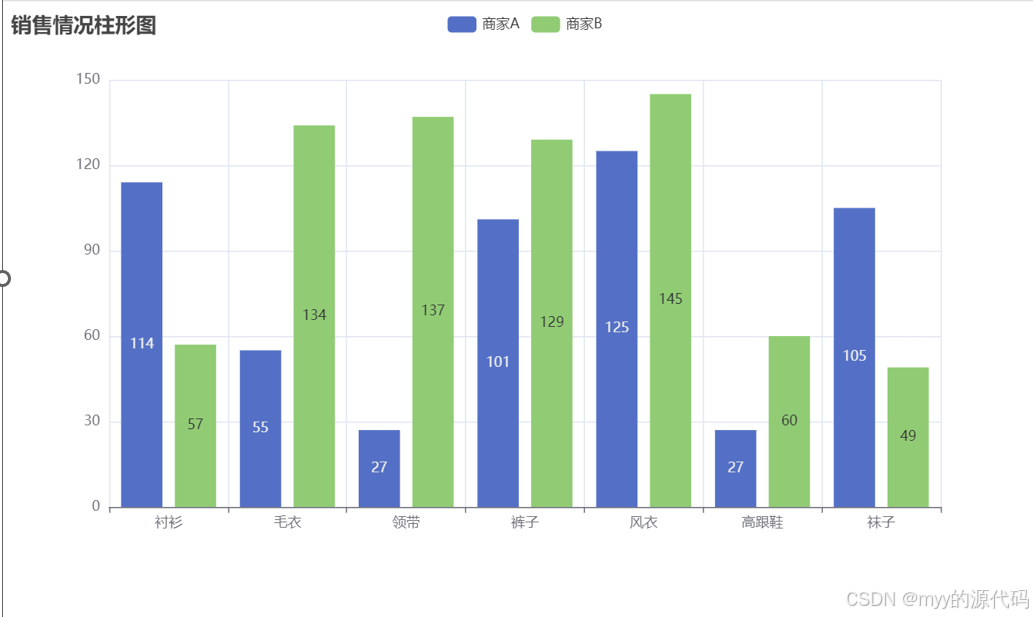
       bar.add_xaxis(["衬衫", "毛衣", "领带", "裤子", "风衣", "高跟鞋", "袜子"])

       bar.add_yaxis("商家A", [114, 55, 27, 101, 125, 27, 105])

bar.add_yaxis("商家B", [57, 134, 137, 129, 145, 60, 49])D)给图表添加标题
代码:
bar.set_global_opts(title_opts=opts.TitleOpts(title="销售情况柱形图")E)渲染图表
代码
import pyecharts

#print(pyecharts._version)


from pyecharts.charts import Bar

from pyecharts import options as opts

bar=(Bar())

bar.add_xaxis(["衬衫", "毛衣", "领带", "裤子", "风衣", "高跟鞋", "袜子"])

bar.add_yaxis("商家A", [114, 55, 27, 101, 125, 27, 105])

bar.add_yaxis("商家B", [57, 134, 137, 129, 145, 60, 49])

bar.set_global_opts(title_opts=opts.TitleOpts(title="销售情况柱形图"))

bar.render("pyecharts1.html")
运行效果截图
 在jupyter中使用,只需要使用xxx.render_notebook() 方法即可在Jupyter中显示图表
2.将上述绘制柱形图的代码改成链式写法
代码:
bar=(Bar()
     .add_xaxis(["衬衫", "毛衣", "领带", "裤子", "风衣", "高跟鞋", "袜子"])
     .add_yaxis("商家A", [114, 55, 27, 101, 125, 27, 105])
     .add_yaxis("商家B", [57, 134, 137, 129, 145, 60, 49])
     .set_global_opts(title_opts=opts.TitleOpts(title="销售情况柱形图"))
     .render("pyecharts101.html")
     )
使用系统数据集Faker快速创建测试数据
a)导入faker库文件
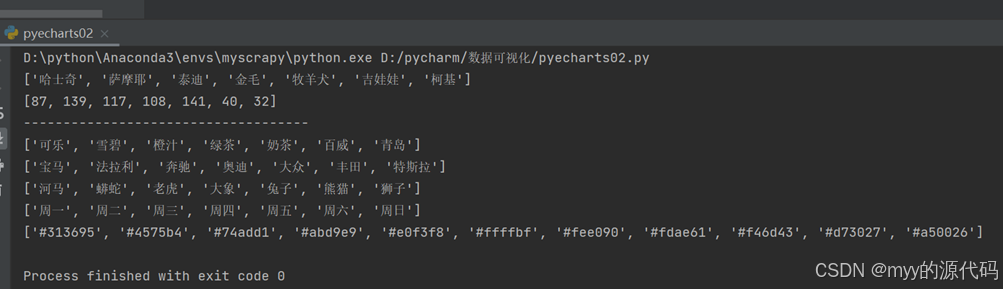
from pyecharts.faker import Fakerb) 使用Faker.choose() 生成测试数据
c)使用Faker.values()生成测试数据
d)分别使用Faker.drinks/Faker.cars/Faker.animal/Faker.week/Faker.visual_color生成
三、使用Faker数据集生成图表并使用主题样式
- 导入主题库
- 查看系统自带的主题样式
- 创建基本柱形图
- 通过init_opts=opts.InitOpts(theme=xxxxx)设置主题样式为 MACARONS
- 通过Faker.week, Faker.values() 为图表添加周一至周日,商家A和商家B的销售数据
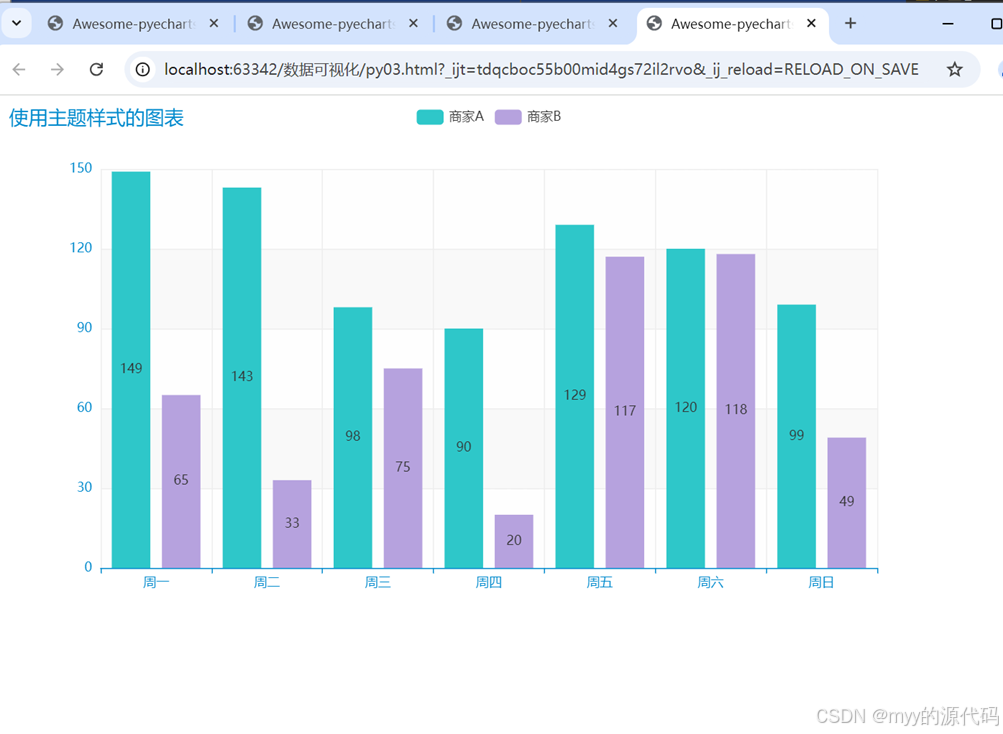
- 为图表添加标题“使用主题样式的图表”
代码:
import pyecharts
from pyecharts.faker import Faker
from pyecharts.charts import Bar
from pyecharts import options as opts
from pyecharts.globals import ThemeType
#设置主题
bar = Bar(init_opts=opts.InitOpts(theme=ThemeType.MACARONS))

bar.add_xaxis(Faker.week)
bar.add_yaxis("商家A", Faker.values())
bar.add_yaxis("商家B", Faker.values())
bar.set_global_opts(title_opts=opts.TitleOpts(title="使用主题样式的图表"))
bar.render("py03.html")
运行效果截图


 2534
2534

 被折叠的 条评论
为什么被折叠?
被折叠的 条评论
为什么被折叠?
 到【灌水乐园】发言


