


1 简介
本文以气体传感器收集的数据来训练几种不同的分类器,并测试了正确率
这里仅演示了最基本的使用方法,各个参数的设定还是参考帮助文档为好。
数据来源:http://archive.ics.uci.edu/ml/datasets/Gas+Sensor+Array+Drift+Dataset
数据分为6类气体,由不同的时间段采集,并由时间段分成了10个数据集,各个数据集的详细情况可以见网站的说明。总之,这里有6类气体的数据,不过需要注意的时,由于传感器材质或工艺水平的原因,随着时间的变化,传感器本身会产生漂移。因此,如果用第10个batch上的数据来训练一个分类器,用第1个batch上面的数据来进行测试,正确率可能会很低。这也是现在需要解决的问题。
训练数据600个,测试数据3000个,
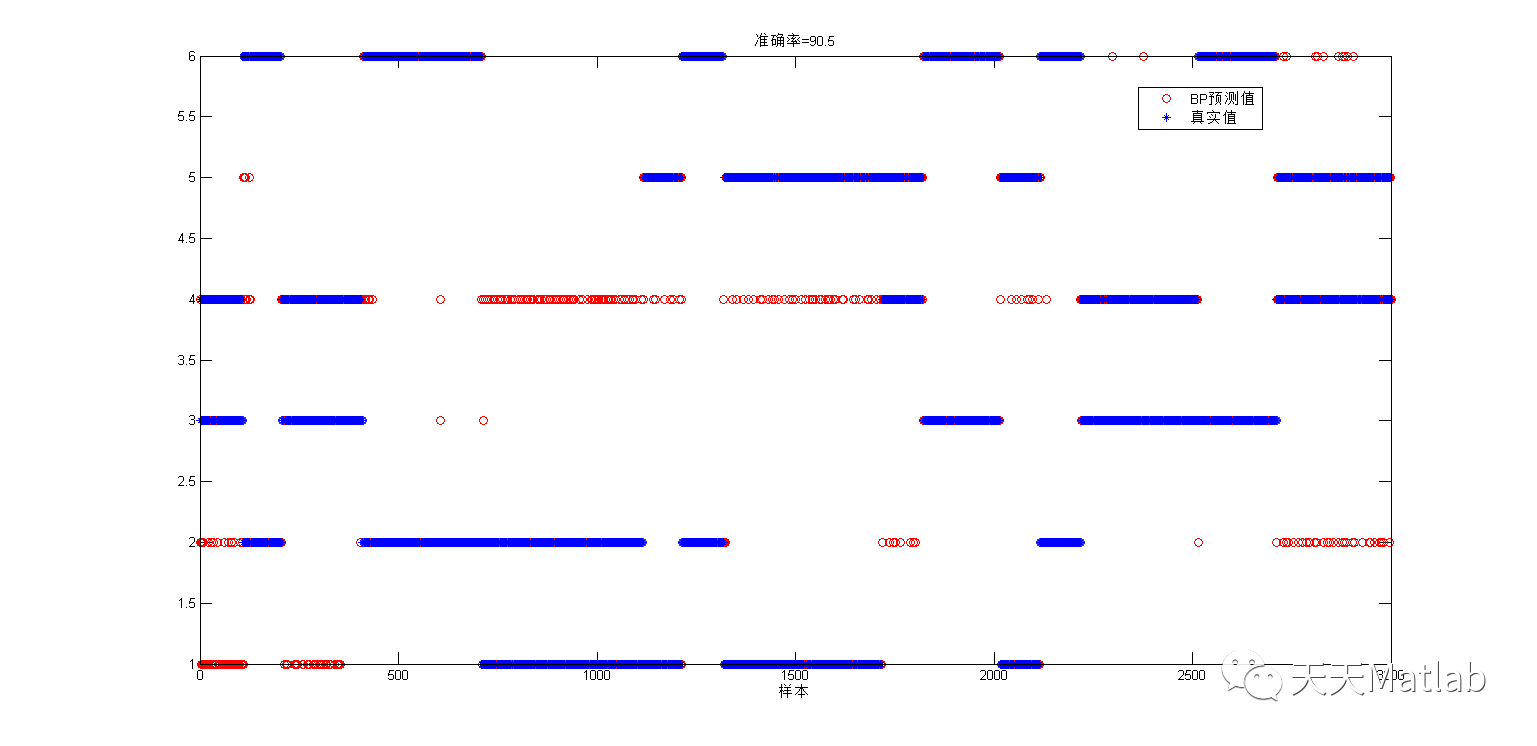
固定初始参数时,各个分类器的正确率如下:
Bayes: 60%
BP: 90.5%
Elman: 77.5%
KNN: 97.5333%
LDA: 84.4667%
RBF: 97.7%
Softmax: 98.1667%
2 部分代码
% /*% * Expanse@yeah.net 2018/07/27% * 每一列表示一个样本% */clear; clc;load Batch.mat C_data C_label; % 加载数据Data = C_data{10}; % 数据Label = C_label{10}; % 标签indices = crossvalind('Kfold',3600,6); % 随机trainindices = (indices == 1); testindices = ~trainindices;traindata = Data(:, trainindices); testdata = Data(:, testindices); % 训练数据600个trainlabel = Label(:, trainindices); testlabel = Label(:, testindices); % 测试数据3000个% 数据归一化(可选)[traindata,PS]=mapminmax(traindata,0,1); %要进行一次转置,这样的归一化是对列(也就是每个传感器响应曲线)的归一化,也有的是对每一次采样得到的数据进行归一化。testdata=mapminmax('apply',testdata,PS);setdemorandstream(pi); % 固定随机值Softmaxnet = trainSoftmaxLayer(traindata,trainlabel,'MaxEpoch',500);Y = Softmaxnet(testdata);% 统计分类正确率figureplotconfusion(testlabel,Y);testClassPrediction=compet(Y);testClass=vec2ind(testClassPrediction);ttest=vec2ind(testlabel);count = sum(testClass == ttest);Accuracy = 100*count/length(testlabel);disp('the Accuracy is ');disp(Accuracy);figureplot(testClass ,'ro-');hold onplot(ttest ,'b*-');legend('SOFTmax预测值','真实值')xlabel('样本')title(['准确率=',num2str(Accuracy)])
3 仿真结果


4 参考文献
博主简介:擅长智能优化算法、神经网络预测、信号处理、元胞自动机、图像处理、路径规划、无人机等多种领域的Matlab仿真,相关matlab代码问题可私信交流。
部分理论引用网络文献,若有侵权联系博主删除。


 1432
1432


 被折叠的 条评论
为什么被折叠?
被折叠的 条评论
为什么被折叠?
 到【灌水乐园】发言


