


 本文详细介绍了matplotlib库中用于图形清理和子图管理的四个关键函数:cla()用于清除当前子图内容但保留子图,clf()清除整个图形所有内容,delaxes()删除指定子图,而sca()则用于设置当前活动子图。通过实例演示了这些函数的具体使用和效果,帮助理解它们在数据可视化过程中的作用。
当前有效matplotlib版本为:3.4.1。
cla函数
cla函数的作用是清空当前子图(相当于将当前子图格式化为默认空子图,子图本身并没有被删除)。
函数的定义签名为matplotlib.pyplot.cla()。
调用链为:matplotlib.pyplot.cla()→matplotlib.pyplot.gca().cla(),作用与Axes.clear()相同。
相关源码见matplotlib.axes._base.py
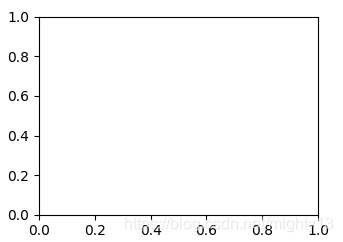
案例:验证cla()
根据输出可知,子图中原有可见元素均被重置为空值或默认值。运行cla()后子图并未被删除。
import matplotlib.pyplot as plt

plt.plot([1, 1])
plt.xlim(1,10)
plt.title("test")
a = plt.gcf().axes
plt.cla()
b = plt.gcf().axes
# 验证子图对象是否被删除
print(a == b)
plt.show()
输出为:
True
clf函数
clf函数的作用是清空当前图形(将所有可见元素重置为空值,删除所有子图)。
函数的定义签名为matplotlib.pyplot.clf()。
调用链为:matplotlib.pyplot.clf()→matplotlib.pyplot.gcf().clf(),作用与Figure.clear()相同。
相关源码见matplotlib.figure.py中的Figure.clf()方法。
案例:验证clf()
根据输出可知,子图对象被删除,图形对象未删除。
import matplotlib.pyplot as plt


plt.plot([1, 1])
plt.xlim(1, 10)
plt.title("test")
a = plt.gcf()
print(plt.gcf().axes)
plt.clf()
b = plt.gcf()
print(a == b)
plt.show()
输出为:
[<AxesSubplot:title={'center':'test'}>]
True
delaxes函数
delaxes函数的作用是从图形中删除子图(默认删除当前子图)。
函数的定义签名为matplotlib.pyplot.delaxes(ax=None)。
源码为:
def delaxes(ax=None):
    """
    Remove an `~.axes.Axes` (defaulting to the current axes) from its figure.
    """
    if ax is None:
        ax = gca()
    ax.remove()
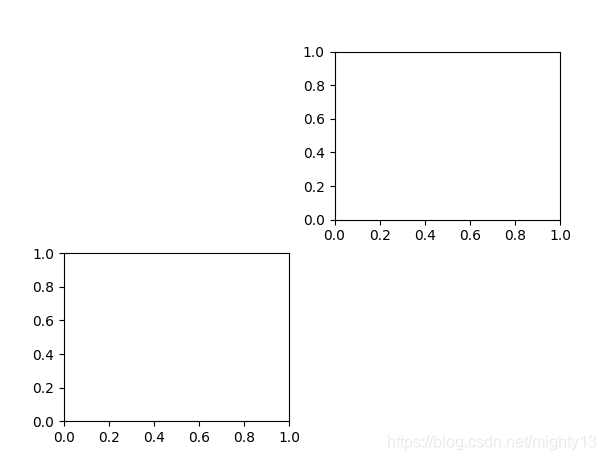
案例:删除子图
import matplotlib.pyplot as plt
# 生成2行2列4个子图
plt.subplots(2,2)
# 最后一个子图为子图,因此删除了最后一个子图。
plt.delaxes()
# 删除指定的第一个子图
plt.delaxes(axes[0, 0])
plt.show()
sca函数
sca函数的作用是将子图设置为当前子图,并将子图的父对象设置为当前图形。
函数的定义签名为matplotlib.pyplot.sca(ax)。
源码为:
def sca(ax):
    """
    Set the current Axes to *ax* and the current Figure to the parent of *ax*.
    """
    figure(ax.figure)
    ax.figure.sca(ax)
案例:设置子图
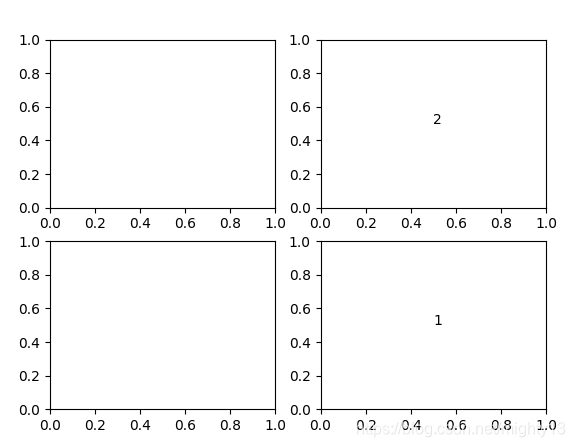
import matplotlib.pyplot as plt


fig, axes = plt.subplots(2, 2)
a = plt.gca()
a.text(0.5, 0.5, "1")
plt.sca(axes[0, 1])
b = plt.gca()
b.text(0.5, 0.5, "2")
plt.show()
验证当前图形设置
由结果可知,设置当前子图后,当前图形也会被设置为当前子图的父对象。
import matplotlib.pyplot as plt


fig1, axes1 = plt.subplots()
fig2, axes2 = plt.subplots()
# 获取当前图形编号
print(plt.gcf().number)
# 设置当前子图
plt.sca(axes1)
# 获取当前图形编号
print(plt.gcf().number)
输出为:
2
1


 5806
5806

 被折叠的 条评论
为什么被折叠?
被折叠的 条评论
为什么被折叠?
 到【灌水乐园】发言


