


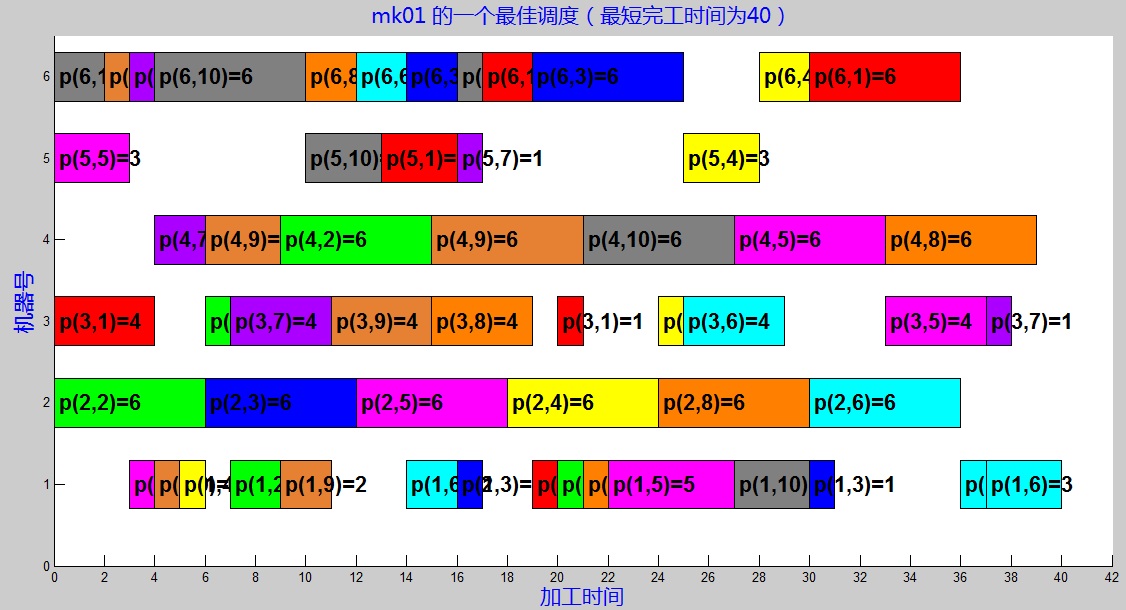
最近要发柔性车间作业调度问题(flexible job shop scheduling problem)方面的论文,需要将eclipse生成的数据表示成甘特图的形式,前期发车间作业调度问题(job shop scheduling problem)方面的论文,用过经典测试用例mt06画过甘特图,那是一个6*6的作业,直接用'r'表示红色,用‘g’表示绿色。。。,但是这次用的测试用例规格为10*6的规格,也就是有10个作业,放在6台机器上进行加工,所以需要有10种颜色来表示不同的作业,那么,问题来了,如何去表示那么多作业呢。。。最终还是请同学解决的,用rgb表示颜色的数组来表示任意多种颜色,废话少说,直接上代码:
改进版本:用rgb数组来表示任意多的工件
%fileName:mt06_final.mt06
%fileDescription:create a gatt chart whith the data given
%creator:by mnmlist
%Version:1.0
%last edit time:06-05-2015
clear;
axis([0,42,0,6.5]);%x轴 y轴的范围
set(gca,'xtick',0:2:42) ;%x轴的增长幅度
set(gca,'ytick',0:1:6.5) ;%y轴的增长幅度
xlabel('加工时间','FontName','微软雅黑','Color','b','FontSize',16)
ylabel('机器号','FontName','微软雅黑','Color','b','FontSize',16,'Rotation',90)
title('mk01 的一个最佳调度(最短完工时间为40)','fontname','微软雅黑','Color','b','FontSize',16);%图形的标题
n_bay_nb=6;%total bays  //机器数目
n_task_nb = 55;%total tasks  //任务数目
%x轴 对应于画图位置的起始坐标x
n_start_time=[0 0 2 6 0 0 3 4 10 13 4 3 10 6 12 4 5 6 14 7 9 9 16 7 11 14 15 12 16 17 16 15 18 19 19 20 21 20 22 21 24 24 25 27 30 30 27 25 28 33 36 33 30 37 37];%start time of every task  //每个工序的开始时间
%length 对应于每个图形在x轴方向的长度
n_duration_time =[6 2 1 6 4 3 1 6 3 3 2 1 2 1 2 1 1 3 2 2 6 2 1 4 4 2 6 6 1 2 1 4 6 1 6 1 1 1 5 6 1 6 4 3 6 1 6 3 2 6 1 4 6 1 3];%duration time of every task  //每个工序的持续时间
%y轴 对应于画图位置的起始坐标y
n_bay_start=[1 5 5 1 2 4 5 5 4 4 3 0 5 2 5 0 0 3 5 0 3 0 5 2 2 0 3 1 0 5 4 2 1 0 5 0 0 2 0 3 2 1 2 0 1 0 3 4 5 3 0 2 5 2 0]; %bay id of every task  ==工序数目,即在哪一行画线
%工序号,可以根据工序号选择使用哪一种颜色
n_job_id=[1 9 8 2 0 4 6 9 9 0 6 4 7 1 5 8 3 8 2 1 1 8 9 6 8 5 8 4 2 0 6 7 3 0 2 1 7 0 4 9 3 7 5 9 5 2 4 3 3 7 5 4 0 6 5];%
rec=[0,0,0,0];%temp data space for every rectangle
color=[1,0,0;
         0,1,0;
         0,0,1;
         1,1,0;
         1,0,1;
         0,1,1;
         0.67,0,1;
         1,.5,0;
         .9,.5,.2;
         .5,.5,.5];%和上一个版本的最大不同在于,matlab中仅可以用字符表示8种颜色,超过8种就不可以了,现在用rgb数组可以表示任意多的颜色
for i =1:n_task_nb
  rec(1) = n_start_time(i);%矩形的横坐标
  rec(2) = n_bay_start(i)+0.7;  %矩形的纵坐标
  rec(3) = n_duration_time(i);  %矩形的x轴方向的长度
  rec(4) = 0.6;
  txt=sprintf('p(%d,%d)=%d',n_bay_start(i)+1,n_job_id(i)+1,n_duration_time(i));%将机器号,工序号,加工时间连城字符串
   rectangle('Position',rec,'LineWidth',0.5,'LineStyle','-','FaceColor',[color(n_job_id(i)+1,1),color(n_job_id(i)+1,2),color(n_job_id(i)+1,3)]);%draw every rectangle
   text(n_start_time(i)+0.2,(n_bay_start(i)+1),txt,'FontWeight','Bold','FontSize',16);%label the id of every task  ,字体的坐标和其它特性
end
效果:
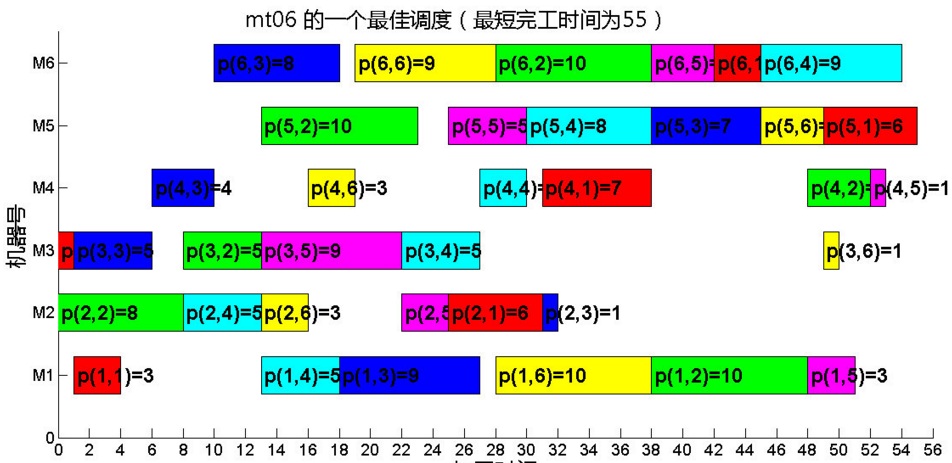
第一版(原始版本):用字符来表示不同的颜色
%fileName:mt06_final.mt06
%fileDescription:create a gatt chart whith the data given
%creator:by mnmlist
%Version:1.0
%last edit time:06-05-2015
clear;
axis([0,56,0,6.5]);%x轴 y轴的范围
set(gca,'xtick',0:2:56) ;%x轴的增长幅度
set(gca,'ytick',0:1:6.5) ;%y轴的增长幅度
xlabel('加工时间'),ylabel('机器号');%x轴 y轴的名称
title('mt06 的一个最佳调度(最短完工时间为55)');%图形的标题
n_bay_nb=6;%total bays  //机器数目
n_task_nb = 36;%total tasks  //任务数目
%x轴 对应于画图位置的起始坐标x
n_start_time=[0 1 0 8 8 13 6 10 13 1 16 13 22 13 22 25 18 27 25 19 28 31 28 31 38 30 38 42 45 38 48 45 49 49 48 52];%start time of every task  //每个工序的开始时间
%length 对应于每个图形在x轴方向的长度
n_duration_time =[1 5 8 5 5 3 4 8 10 3 3 9 3 5 5 6 9 3 5 9 10 1 10 7 4 8 10 3 9 7 3 4 6 1 4 1];%duration time of every task  //每个工序的持续时间
%y轴 对应于画图位置的起始坐标y
n_bay_start=[2 2 1 1 2 1 3 5 4 0 3 2 1 0 2 1 0 3 4 5 0 1 5 3 5 4 0 5 5 4 0 4 4 2 3 3]; %bay id of every task  ==工序数目,即在哪一行画线
%工序号,可以根据工序号选择使用哪一种颜色
n_job_id=[0 2 1 3 1 5 2 2 1 0 5 4 4 3 3 0 2 3 4 5 5 2 1 0 4 3 1 0 3 2 4 5 0 5 1 4];%
rec=[0,0,0,0];%temp data space for every rectangle
color=['r','g','b','c','m','y'];
for i =1:n_task_nb
  rec(1) = n_start_time(i);%矩形的横坐标
  rec(2) = n_bay_start(i)+0.7;  %矩形的纵坐标
  rec(3) = n_duration_time(i);  %矩形的x轴方向的长度
  rec(4) = 0.6;
  txt=sprintf('p(%d,%d)=%d',n_bay_start(i)+1,n_job_id(i)+1,n_duration_time(i));%将机器号,工序号,加工时间连城字符串
   rectangle('Position',rec,'LineWidth',0.5,'LineStyle','-','FaceColor',color(n_job_id(i)+1));%draw every rectangle
   text(n_start_time(i)+0.2,(n_bay_start(i)+1),txt,'FontWeight','Bold','FontSize',18);%label the id of every task  ,字体的坐标和其它特性
end
效果:
博主擅长遗传算法、作业调度、路线规划,可扫码进行技术咨询


 1143
1143


 被折叠的 条评论
为什么被折叠?
被折叠的 条评论
为什么被折叠?
 到【灌水乐园】发言


