


"""
nlayer 80 Number of layers at the fixed heights of 0.00-0.25 km, 0.25-0.50 km, ..., 19.50-19.75 km, and 19.75-20.00 km.
"""
from pathlib import Path
from collections import namedtuple

import numpy as np
import matplotlib.pyplot as plt
import matplotlib.ticker as mticker
import matplotlib.cm as cm
import matplotlib.colors as mcolors
import cmaps
import cartopy.crs as ccrs
import cartopy.feature as cfeature
from cartopy.mpl.ticker import LongitudeFormatter, LatitudeFormatter
import xarray as xr
# 上一篇有介绍不做赘述
Point = namedtuple('Point', ['x', 'y'])
Pair = namedtuple('Pair', ['start', 'end'])


def region_mask(lon, lat, extents):
    '''返回用于索引经纬度方框内数据的Boolean数组.'''
    lonmin, lonmax, latmin, latmax = extents
    return (
        (lon >= lonmin) & (lon <= lonmax) &
        (lat >= latmin) & (lat <= latmax)
    )


def make_LH_cmap(levels):
    '''制作潜热的colormap.'''
    levels = np.asarray(levels)
    cmap = cmaps.BlueWhiteOrangeRed  # 可以调用NCL的颜色,想要什么颜色就 .+颜色名进行调用
    nbin = len(levels) - 1  # 两个数字之间分配一个颜色
    n_negative = np.count_nonzero(levels < 0)  # 不同数据大小进行分配
    n_positive = np.count_nonzero(levels > 0)
    colors = np.vstack([
        cmap(np.linspace(0, 0.5, n_negative)[:-1]),
        cmap(np.linspace(0.5, 1, n_positive))
    ])
    cmap = mcolors.ListedColormap(colors)  # 将colors全部选择,可选择截断一部分
    norm = mcolors.BoundaryNorm(levels, nbin)  # levels需要单调递增,bin表示映射颜色的数量
    return cmap, norm

def make_Rr_cmap(levels):
    '''制作降水的colormap.'''
    nbin = len(levels) - 1
    cmap = cm.get_cmap('jet', nbin)
    norm = mcolors.BoundaryNorm(levels, nbin)
    return cmap, norm


def get_line_label_pos(pair, space=0.5):
    '''根据两点连线计算起点旁边标签的位置.'''
    x0, y0 = pair.start
    x1, y1 = pair.end
    length = np.hypot(x1 - x0, y1 - y0)
    r = space / length
    x = (1 + r) * x0 - r * x1
    y = (1 + r) * y0 - r * y1
    return Point(x, y)


class CrossSectionGPM:
    '''
    对GPM二级产品求剖面的类.

    对剖面上每个节点设置小方框, 落入框中的GPM数据点的均值代表该节点的值.
    将地图视为笛卡尔坐标系. 无法处理跨越180经度线的情况.
    '''
    def __init__(self, lon, lat, start, end, npt=100, box=0.2):
        '''
        Parameters
        ----------
        lon : ndarray, shape (nscan, nray)
            二维经度数组.

        lat : ndarray, shape (nscan, nray)
            二维纬度数组.

        start : 2-tuple of float
            剖面起点的经度和纬度.

        end : 2-tuple of float
            剖面终点的经度和纬度.

        npt : int
            剖面的节点数(包含端点). 默认为100.

        box : float
            每个剖面节点的方框大小. 数值越大剖面可能越平滑.
            默认为0.2度(考虑到DPR的水平分辨率为5km, 约为0.05度).

        Attributes
        ----------
        line : ndarray, shape (npt, 2)
            剖面每个节点的经纬度.
        '''
        # 根据起点和终点设置剖面线.
        line = np.column_stack([  # 矩阵合并
            np.linspace(start[0], end[0], npt),  # 经度分为npt份,纬度分为npt份,然后以列的方式组合形成
            np.linspace(start[1], end[1], npt)   # [[134.5,22.8],[134.54444444,22.87979798],[134.58888889,22.95959596]]
        ])

        # 收集落入每个box内的数据点的下标.
        indices = []
        for x, y in line:  # 一个box为(x-0.1, x+0.1)
            x0 = x - box / 2
            x1 = x + box / 2
            y0 = y - box / 2
            y1 = y + box / 2
            index = np.nonzero(  # 返回数组中非0元素的索引,即显示为False的数据,每一次筛选一个box里符合的数
                (lon >= x0) & (lon <= x1) &
                (lat >= y0) & (lat <= y1)
            )
            indices.append(index)  # 有100box,每个box落入数据不一样多


        self.npt = npt  # 100份
        self.line = line  # 大范围
        self.indices = indices  # 收集的数据

    def get_cross(self, data):
        '''
        获取数据data的剖面.

        Parameters
        ----------
        data : ndarray, shape (nscan, nray) or (nscan, nray, nbin)
            输入数据. 二维输入对应于剖线, 三维输入对应于剖面.

        Returns
        -------
        cross : ndarray, shape (npt,) or (nbin, npt)
            剖面结果. 缺失的剖面节点用NaN填充.
        '''
        # 根据data的维数初始化cross.
        if data.ndim == 2:
            cross = np.full(self.npt, np.nan)  # 一个初始为np.nan的数组

        elif data.ndim == 3:
            cross = np.full((self.npt, data.shape[-1]), np.nan)

        # 计算每个box内的平均值.
        for i, index in enumerate(self.indices):  # enumerate将每一个box贴上顺序i,方便遍历
            ix, iy = index  # ix为经度, iy为纬度
            if ix.size > 0:  # box里的数目,比如第一个box有17个数
                cross[i] = np.nanmean(data[ix, iy], axis=0)  # 对每一个box里面的数求平均,box数据通过ix,和iy进行索引

        # 进行转置方便画图.
        if cross.ndim == 2:  # 画图为先lat, 后lon,[lat, lon]
            cross = cross.T

        return cross

    def get_ticks(self, ntick, decimals=2):
        '''
        以剖面长度为横坐标, 等距设置nticks个刻度, 返回长度和刻度的位置与标签.

        Parameters
        ----------
        ntick : int
            刻度的个数.
        decimals : int
            标签约化到几位小数.

        Returns
        -------
        dist : ndarray, shape (npt,)
            剖面从起点到终点的长度.

        ticks : ndarray, shape (npt,)
            刻度的位置.

        labels : list of str, shape (ntick,)
            用经纬度表示的刻度标签.
        '''
        diff = self.line - self.line[0, :]  # 减去第一个数

        dist = np.hypot(diff[:, 0], diff[:, 1])  # 计算以dx,dy为直角边的三角形的斜边长度,100个点的斜边长度

        ticks = np.linspace(dist[0], dist[-1], ntick)  # 标签分成ntick份
        lons = np.interp(ticks, dist, self.line[:, 0]).round(decimals)
        lats = np.interp(ticks, dist, self.line[:, 1]).round(decimals)
        # 文本录入
        ticklabels = []
        lon_formatter = LongitudeFormatter()
        lat_formatter = LatitudeFormatter()
        for i in range(ntick):
            lon_str = lon_formatter(lons[i])
            lat_str = lat_formatter(lats[i])
            ticklabels.append(lon_str + '\n' + lat_str)  # 叠成两行

        return dist, ticks, ticklabels  #


# 读取数据
filepath_DPR = r"E:\GPM\代码例子\2A.GPM.DPR.V9-20211125.20210929-S142530-E155804.043106.V07A.HDF5.nc4"
f_DPR = xr.open_dataset(filepath_DPR)
precipRate = f_DPR['FS_SLV_precipRate'][:]
elevation = f_DPR['FS_PRE_elevation'][:]
heightZeroDeg = f_DPR['FS_VER_heightZeroDeg'][:]
extents = [127, 147, 17, 37]
lon_DPR = f_DPR['FS_Longitude'][:]
lat_DPR = f_DPR['FS_Latitude'][:]
nscan , nray = lon_DPR.shape
midnray = nray//2
mask = region_mask(lon_DPR[:, midnray], lat_DPR[:, midnray], extents)
index = np.s_[mask]
lon_DPR = lon_DPR[index]
lat_DPR = lat_DPR[index]
precipRate = precipRate[index]
elevation = elevation[index]
heightZeroDeg = heightZeroDeg[index]
# 设置缺测. 注意到GMI的缺测是-9999.
for data in [
    elevation, heightZeroDeg,precipRate,
]:
    data.values[data <= -9999] = np.nan
# 倒转DPR三维数据的高度维.从数据说明文件可知,其0表示卫星出,最后一位数表示地面,因此需要换个方向
precipRate = precipRate[:, :, ::-1]
# 高度设置

nbin = 176
dh = 0.125  #高度分辨率为0.125km
height_DPR = (np.arange(nbin) + 0.5) * dh  # 分辨格点区间取其中间值, 比如0~0.125, 取0.0625
# 高度单位改为km.
elevation /= 1000
heightZeroDeg /= 1000
# 颜色标签设置
levels_Rr = [0.1, 0.5, 1.0, 2.0, 3.0, 5.0, 10.0, 15.0, 20.0, 25, 30]
cmap_Rr, norm_Rr = make_Rr_cmap(levels_Rr)
# 地图设置,画图的部分都一样,不做详解,属于直接复制粘贴内容
proj = ccrs.PlateCarree()
fig = plt.figure(figsize=(10, 8))
ax = fig.add_subplot(111, projection=proj)
ax.coastlines(resolution='50m', lw=0.5)
ax.add_feature(cfeature.OCEAN.with_scale('50m'))
ax.add_feature(cfeature.LAND.with_scale('50m'))
ax.set_xticks(np.arange(-180, 181, 5), crs=proj)
ax.set_yticks(np.arange(-90, 91, 5), crs=proj)
ax.xaxis.set_minor_locator(mticker.AutoMinorLocator(2))
ax.yaxis.set_minor_locator(mticker.AutoMinorLocator(2))
ax.xaxis.set_major_formatter(LongitudeFormatter())
ax.yaxis.set_major_formatter(LatitudeFormatter())
ax.set_extent(extents, crs=proj)
ax.tick_params(labelsize='large')

# 输入剖面起始点.  画出剖面示意图
pairs = Pair(Point(134.5, 22.8), Point(138.9, 30.7))
ax.plot(*zip(pairs.start, pairs.end), marker='o', lw=1.5, ms=3, c='k', transform=proj,)  # 取pairs第一个部分和第二个部分
pos = get_line_label_pos(pairs)  # 计算标签位置
# 图片title加文字
ax.text(
        pos.x, pos.y, "2",
        fontsize='large', weight='bold',
        ha='center', va='center', transform=proj
    )


#  计算剖面
cross_section = CrossSectionGPM(lon_DPR, lat_DPR, pairs.start, pairs.end)  # 放入经纬度,起始结束区域
Rr2d = cross_section.get_cross(precipRate)
elv1d = cross_section.get_cross(elevation)
h01d = cross_section.get_cross(heightZeroDeg)
dist, ticks, ticklabels = cross_section.get_ticks(6)  # 选择6个坐标数
# 画出降水剖面.
fig = plt.figure(figsize=(10, 8))
ax = fig.add_subplot(111)
cmap_Rr.set_under('white')
im = ax.contourf(
    dist, height_DPR, Rr2d, levels=levels_Rr,
    cmap=cmap_Rr, norm=norm_Rr, extend='both'
)
cbar = fig.colorbar(
            im, ax=ax, fraction=0.1, pad=0.25, aspect=40,
            ticks=levels_Rr, orientation='horizontal',
        )
cbar.set_label('Rain Rate (mm/hr)', fontsize='small')
cbar.ax.tick_params(labelsize='small')
# 画出地形和零度高度.
ax.fill_between(dist, elv1d, color='r')  # 画出地形
ax.plot(dist, h01d, lw=1.5, ls='--', c='k', label='0°C')  # 0°线
ax.legend(
    loc='upper right', fontsize='small',
    fancybox=False, framealpha=1)
# 设置坐标轴.
ax.set_ylim(0, 15)
ax.set_ylabel('Height (km)', fontsize='small')
ax.set_xticks(ticks)
ax.set_xticklabels(ticklabels)
ax.yaxis.set_major_locator(mticker.MultipleLocator(5))
ax.yaxis.set_minor_locator(mticker.AutoMinorLocator(2))
ax.xaxis.set_minor_locator(mticker.AutoMinorLocator(2))
ax.tick_params(labelsize='small')
ax.text(0.02, 0.95, "DPR Rain Rate", fontsize='small',
ha ='left', va='top', transform=ax.transAxes)
print("successful")
plt.show()
BlueWhiteOrangeRed等颜色网站如链接所示NCL可用颜色网站
图1为垂直剖面位置示意图:
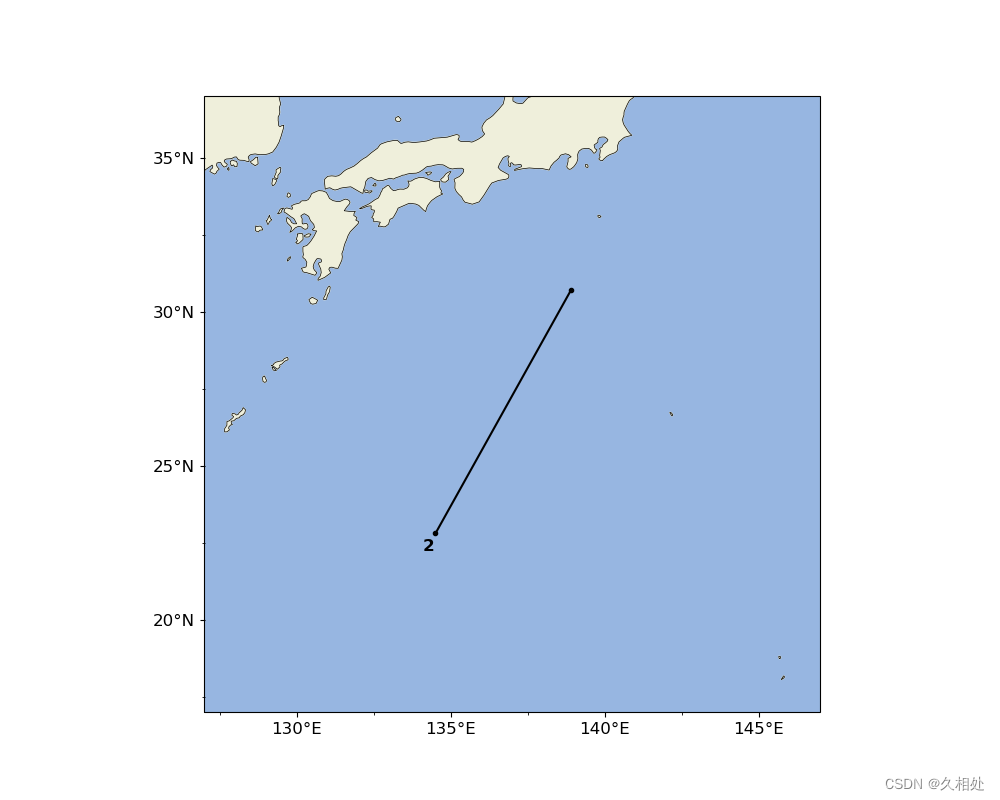
图2为降水垂直剖面图:
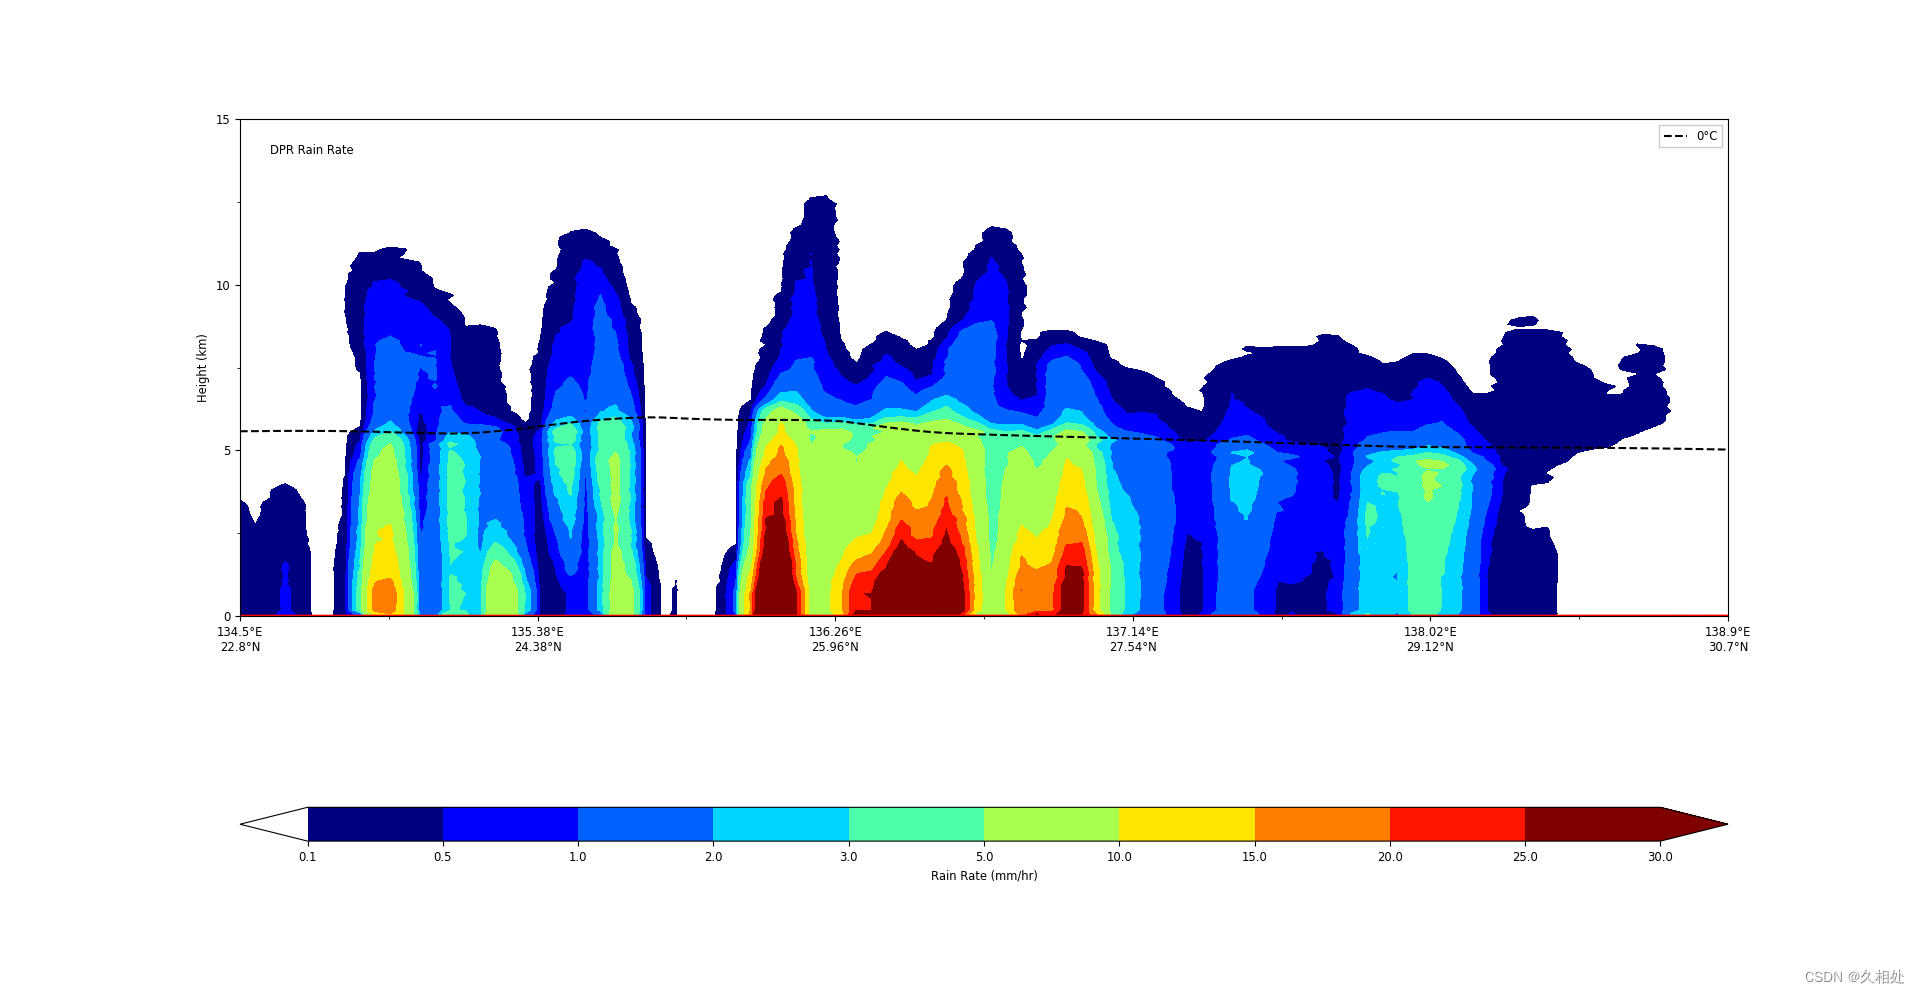
图中黑线为0摄氏度等温线,红色为地形数据,可依据需要进行保留或删除。
GPM2级数据丰富和强大,大部分都进行了注释。希望能帮助大家。
参考链接在上一篇有附上。


 659
659


 被折叠的 条评论
为什么被折叠?
被折叠的 条评论
为什么被折叠?
 到【灌水乐园】发言


