


文章目录
前言:
我是基于 http://c.biancheng.net/pandas/what-is-pandas.html这个网站学的,都试了一遍。自己就总结一下,也方便自己查看。不是很好,以后还会做删改。
一. Pandas Series结构
#pd.Series( data, index, dtype, copy)
1)创建Series对象
1 .创建空Series对象
s = pd.Series()
s
#结果
Series([], dtype: float64)
2.ndarray创建Series对象
data = np.array(['a','b','c','d'])
s = pd.Series(data)
# 还可以自己设置索引
s1= pd.Series(data,[101,45,23,665])
s,s1
#结果
(0    a
 1    b
 2    c
 3    d
 dtype: object,
 101    a
 45     b
 23     c
 665    d
 dtype: object)
3.dict创建Series对象
data = {'a' : 0., 'b' : 1., 'c' : 2.}
s = pd.Series(data)
# 我们还可以设置一个没有在data里的index
s1= pd.Series(data,index=['b','c','d','a'])
s,s1
# 结果
(a    0.0
 b    1.0
 c    2.0
 dtype: float64,
 b    1.0
 c    2.0
 d    NaN
 a    0.0
 dtype: float64)
4.标量创建Series对象
s = pd.Series(5,index=[0, 1, 2, 3])
0    5
1    5
2    5
3    5
dtype: int64
2)访问Series数据
s = pd.Series([1,2,3,4,5],index = ['a','b','c','d','e'])
print(s[0])
print(s[:3])
1
a  1
b  2
c  3
dtype: int64
3)Series常用属性

s = pd.Series(np.random.randn(5))
s.axes
# 结果
[RangeIndex(start=0, stop=5, step=1)]

s.dtype,s.empty,s.ndim,s.size
#结果
(dtype('float64'), False, 1, 4)

s.size,s.values,s.tail(3),s.head()
#结果
(5,
 array([-0.19776269, -0.42909052,  0.28519846,  1.4080903 , -0.45000034]),
 2    0.285198
 3    1.408090
 4   -0.450000
 dtype: float64)
4)Series常用方法
1.head()&tail()查看数据
s.head(),s.tail() 默认是5行
2.isnull()&nonull()检测缺失值
s=pd.Series([1,2,5,None])
pd.isnull(s),pd.notnull(s)

(0    False
 1    False
 2    False
 3     True
 dtype: bool,
 0     True
 1     True
 2     True
 3    False
 dtype: bool)
二.Pandas DataFrame 结构
pd.DataFrame( data, index, columns, dtype, copy)
1)创建DataFrame对象
1.创建空的DataFrame对象
df = pd.DataFrame()
df
#结果
_ # 单写df打出来是这个 我也不知道为什么

print(df)
#结果
Empty DataFrame
Columns: []
Index: []
2.列表创建DataFame对象
# 1.可以使用单一列表或嵌套列表来创建一个 DataFrame。
data = [1,2,3,4,5]
df = pd.DataFrame(data)
# 2.使用嵌套列表创建 DataFrame 对象:
data1 = [['Alex',10],['Bob',12],['Clarke',13]]
df1 = pd.DataFrame(data1,columns=['Name','Age'])
# 指定数值元素的数据类型为 float
df1 = pd.DataFrame(data1,columns=['Name','Age'],dtype=float)
#结果
(   0
 0  1
 1  2
 2  3
 3  4
 4  5,
      Name   Age
 0    Alex  10.0
 1     Bob  12.0
 2  Clarke  13.0)
3.字典嵌套列表创建
data2 = {'Name':['Tom', 'Jack', 'Steve', 'Ricky'],'Age':[28,34,29,42]}
df2 = pd.DataFrame(data2)
      Age      Name
0     28        Tom
1     34       Jack
2     29      Steve
3     42      Ricky
4.列表嵌套字典创建DataFrame对象
data3 = [{'a': 1, 'b': 2},{'a': 5, 'b': 10, 'c': 20}]
df3 = pd.DataFrame(data3)

    a    b      c
0   1   2     NaN
1   5   10   20.0
5.Series创建DataFrame对象
d = {'one' : pd.Series([1, 2, 3], index=['a', 'b', 'c']),
   'two' : pd.Series([1, 2, 3, 4], index=['a', 'b', 'c', 'd'])}
df = pd.DataFrame(d)
print(df)

      one    two
a     1.0    1
b     2.0    2
c     3.0    3
d     NaN    4
2)列索引操作DataFrame
1.列索引添加数据列
d = {'one' : pd.Series([1, 2, 3], index=['a', 'b', 'c']),
   'two' : pd.Series([1, 2, 3, 4], index=['a', 'b', 'c', 'd'])}
df = pd.DataFrame(d)
#使用df['列']=值,插入新的数据列
df['three']=pd.Series([10,20,30],index=['a','b','c'])
print(df)
# 结果
使用列索引创建新数据列:
     one   two   three
a    1.0    1    10.0
b    2.0    2    20.0
c    3.0    3    30.0
d    NaN    4    NaN
2.列索引添加数据列
d = {'one' : pd.Series([1, 2, 3], index=['a', 'b', 'c']),
   'two' : pd.Series([1, 2, 3, 4], index=['a', 'b', 'c', 'd'])}
df = pd.DataFrame(d)
#使用df['列']=值,插入新的数据列
df['three']=pd.Series([10,20,30],index=['a','b','c'])
print(df)
#将已经存在的数据列做相加运算
df['four']=df['one']+df['three']
print(df)

使用列索引创建新数据列:
     one   two   three
a    1.0    1    10.0
b    2.0    2    20.0
c    3.0    3    30.0
d    NaN    4    NaN

已存在的数据列做算术运算:
      one   two   three    four
a     1.0    1    10.0     11.0
b     2.0    2    20.0     22.0
c     3.0    3    30.0     33.0
d     NaN    4     NaN     NaN
3. 列索引删除数据列
d = {'one' : pd.Series([1, 2, 3], index=['a', 'b', 'c']),
   'two' : pd.Series([1, 2, 3, 4], index=['a', 'b', 'c', 'd']),
   'three' : pd.Series([10,20,30], index=['a','b','c'])}
df = pd.DataFrame(d)
print ("Our dataframe is:")
print(df)
#使用del删除
del df['one']
print(df)
#使用pop方法删除
df.pop('two')
print (df)
# 结果
原DataFrame:
      one   three  two
a     1.0    10.0   1
b     2.0    20.0   2
c     3.0    30.0   3
d     NaN     NaN   4

使用del删除 first:
      three    two
a     10.0     1
b     20.0     2
c     30.0     3
d     NaN      4

使用 pop()删除:
   three
a  10.0
b  20.0
c  30.0
d  NaN

三.Pandas描述性统计
我感觉这张图就够了

四.Pandas使用自定义函数
如果想要应用自定义的函数,或者把其他库中的函数应用到 Pandas 对象中,有以下三种方法:
- 操作整个 DataFrame 的函数:pipe()
- 操作行或者列的函数:apply()
- 操作单一元素的函数:applymap()
1).pipe()
def adder(ele1,ele2):
    return ele1+ele2
# 通过给 pipe() 函数传递一个自定义函数和适当数量的参数值,从而操作 DataFrme 中的所有元素

#操作DataFrame
df = pd.DataFrame(np.random.randn(4,3),columns=['c1','c2','c3'])
#相加前
print(df)
#相加后
print(df.pipe(adder,3))

         c1        c2        c3
0 -0.030807 -0.970950 -2.089856
1  1.739017  1.751776 -0.998504
2 -1.199942  0.038775 -2.701917
3  0.655456 -1.438736  0.143453
         c1        c2        c3
0  2.969193  2.029050  0.910144
1  4.739017  4.751776  2.001496
2  1.800058  3.038775  0.298083
3  3.655456  1.561264  3.143453
2).apply()
# 如果要操作  DataFrame 的某一行或者某一列,可以使用 apply() 方法,该方法与描述性统计方法类似,都有可选参数 axis,并且默认按列操作。示例如下:
df = pd.DataFrame(np.random.randn(5,3),columns=['col1','col2','col3'])
df.apply(np.mean)
#默认按列操作,计算每一列均值
print(df.apply(np.mean))

col1    0.835093
col2   -0.315443
col3   -0.965515
dtype: float64
3).appymap()
# 操作单一元素
# DataFrame 数据表结构的 applymap() 和 Series 系列结构的 map() 类似,它们都可以接受一个 Python 函数,并返回相应的值
df = pd.DataFrame(np.random.randn(5,3),columns=['col1','col2','col3'])
#自定义函数lambda函数

df['col1'].map(lambda x:x*100)
0    -96.565572
1    109.558263
2   -100.399999
3    -64.723237
4    -57.469704
Name: col1, dtype: float64
五.reindex重置索引
1)重置行列标签
# Pandas reindex重置索引
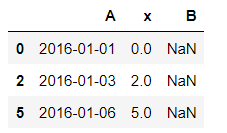
#重置索引(reindex)可以更改原 DataFrame 的行标签或列标签,并使更改后的行、列标签与 DataFrame 中的数据逐一匹配。通过重置索引操作,您可以完成对现有数据的重新排序。如果重置的索引标签在原 DataFrame 中不存在,那么该标签对应的元素值将全部填充为 NaN。
N = 20
df = pd.DataFrame({
'A': pd.date_range(start='2016-01-01',periods=N,freq='D'),
'x': np.linspace(0,stop=N-1,num=N),
'y': np.random.rand(N),
'C': np.random.choice(['Low','Medium','High'],N).tolist(),
'D': np.random.normal(100, 10, size=(N)).tolist()
})
#重置行、列索引标签
df_reindexed = df.reindex(index=[0,2,5], columns=['A', 'x', 'B'])
df_reindexed
2) 填充元素值
df1 = pd.DataFrame(np.random.randn(6,3),columns=['col1','col2','col3'])
df2 = pd.DataFrame(np.random.randn(2,3),columns=['col1','col2','col3'])
#使df2和df1行标签相同
print(df2.reindex_like(df1))
# 向前填充,限制填充行数
print(df2.reindex_like(df1,method='ffill',limit=2))
#向后填充
print(df2.reindex_like(df1,method ='bfill'))

       col1      col2      col3
0 -1.816559  0.100428  0.016079
1  0.527622 -0.699029 -0.846161
2       NaN       NaN       NaN
3       NaN       NaN       NaN
4       NaN       NaN       NaN
5       NaN       NaN       NaN
       col1      col2      col3
0 -1.816559  0.100428  0.016079
1  0.527622 -0.699029 -0.846161
2  0.527622 -0.699029 -0.846161
3  0.527622 -0.699029 -0.846161
4       NaN       NaN       NaN
5       NaN       NaN       NaN
       col1      col2      col3
0 -1.816559  0.100428  0.016079
1  0.527622 -0.699029 -0.846161
2       NaN       NaN       NaN
3       NaN       NaN       NaN
4       NaN       NaN       NaN
5       NaN       NaN       NaN
3)重命名标签
# rename() 方法允许您使用某些映射(dict或Series)或任意函数来对行、列标签重新命名,示例如下:
df1 = pd.DataFrame(np.random.randn(6,3),columns=['col1','col2','col3'])
print (df1)
#对行和列重新命名,列用的是index
print (df1.rename(columns={'col1' : 'c1', 'col2' : 'c2'},index = {0 : 'apple', 1 : 'banana', 2 : 'durian'}))

       col1      col2      col3
0 -1.377263 -0.048001  0.582482
1  1.329092  0.777139 -1.682774
2  1.318394  0.386872  0.867714
3  0.737993  1.218515  0.363965
4 -0.446072  1.637633  1.159430
5 -0.597479 -0.535170 -0.365169
              c1        c2      col3
apple  -1.377263 -0.048001  0.582482
banana  1.329092  0.777139 -1.682774
durian  1.318394  0.386872  0.867714
3       0.737993  1.218515  0.363965
4      -0.446072  1.637633  1.159430
5      -0.597479 -0.535170 -0.365169
六.iteration遍历
# 内置迭代方法
#1) iteritems():以键值对 (key,value) 的形式遍历;
#2) iterrows():以 (row_index,row) 的形式遍历行;
#3) itertuples():使用已命名元组的方式对行遍历。
# 1
df = pd.DataFrame(np.random.randn(4,3),columns=['col1','col2','col3'])
for key,value in df.iteritems():
    print (key)
    print (value)

            A     x         y       C           D
0  2016-01-01   0.0  0.763012  Medium  120.239019
1  2016-01-02   1.0  0.208015  Medium   91.977896
2  2016-01-03   2.0  0.608341     Low   93.101227
3  2016-01-04   3.0  0.293113    High   96.926576
4  2016-01-05   4.0  0.582090     Low   89.205311
5  2016-01-06   5.0  0.871286  Medium  102.547049
6  2016-01-07   6.0  0.895468  Medium  105.866591
7  2016-01-08   7.0  0.472089    High  101.840693
8  2016-01-09   8.0  0.277489     Low  107.129936
9  2016-01-10   9.0  0.074426  Medium  108.069369
10 2016-01-11  10.0  0.344848     Low  103.879630
11 2016-01-12  11.0  0.668407     Low  121.113948
12 2016-01-13  12.0  0.793357  Medium  110.010020
13 2016-01-14  13.0  0.876029     Low  116.431434
14 2016-01-15  14.0  0.392223    High   95.121601
15 2016-01-16  15.0  0.876639    High   81.192636
16 2016-01-17  16.0  0.334383  Medium  105.844966
17 2016-01-18  17.0  0.068939  Medium   96.250567
18 2016-01-19  18.0  0.437189    High   98.643413
19 2016-01-20  19.0  0.447811    High   86.453810
A
x
y
C
D
1)内置迭代方法
1. iteritems():以键值对 (key,value) 的形式遍历;
df = pd.DataFrame(np.random.randn(4,3),columns=['col1','col2','col3'])
for key,value in df.iteritems():
    print (key)
    print (value)

col1
0    1.746969
1   -1.777736
2    1.287435
3   -0.822031
Name: col1, dtype: float64
col2
0   -1.387822
1   -0.519084
2    0.527092
3   -0.768136
Name: col2, dtype: float64
col3
0    0.888822
1    0.598397
2    0.471638
3   -1.706724
Name: col3, dtype: float64
2. iterrows():以 (row_index,row) 的形式遍历行;
# 2 iterrows()
# 该方法按行遍历,返回一个迭代器,以行索引标签为键,以每一行数据为值
df = pd.DataFrame(np.random.randn(3,3),columns = ['col1','col2','col3'])
print(df)
for row_index,row in df.iterrows():
    print (row_index)
    print (row)

       col1      col2      col3
0 -0.755063  0.144637  0.692881
1  1.405349 -1.739240  0.753087
2 -0.564854  2.465594 -1.438760
0
col1   -0.755063
col2    0.144637
col3    0.692881
Name: 0, dtype: float64
1
col1    1.405349
col2   -1.739240
col3    0.753087
Name: 1, dtype: float64
2
col1   -0.564854
col2    2.465594
col3   -1.438760
Name: 2, dtype: float64
3. itertuples():使用已命名元组的方式对行遍历。
# 3.itertuples
#itertuples() 同样将返回一个迭代器,该方法会把 DataFrame 的每一行生成一个元组,示例如下
for row in df.itertuples():
    print(row)

Pandas(Index=0, col1=-0.7550631762874994, col2=0.14463724372363096, col3=0.6928809745654597)
Pandas(Index=1, col1=1.4053490007603238, col2=-1.7392395878094982, col3=0.7530869174298815)
Pandas(Index=2, col1=-0.5648537636794049, col2=2.465593983815563, col3=-1.4387601535883185)
七.sorting排序
Pands 提供了两种排序方法,分别是按标签排序和按数值排序。本节讲解 Pandas 的排序操作
1)按标签排序
#按标签排序
unsorted_df=pd.DataFrame(np.random.randn(10,2),index=[1,6,4,2,3,5,9,8,0,7],columns=['col2','col1'])
sorted_df=unsorted_df.sort_index(ascending=False) # 默认为True
sorted_df

		col2		col1
9	1.634507	-0.334364
8	1.255138	-0.522748
7	0.855500	-0.078326
6	0.777261	-0.838355
5	1.631459	-1.202572
4	1.488172	-0.903217
3	0.910531	-0.131866
2	-1.154984	1.189715
1	-1.953654	1.059597
0	-0.226274	0.664857
2) 按列标签排序
# 按列标签排序
sorted_df=unsorted_df.sort_index(axis=1)
sorted_df

		col1		col2
1	1.059597	-1.953654
6	-0.838355	0.777261
4	-0.903217	1.488172
2	1.189715	-1.154984
3	-0.131866	0.910531
5	-1.202572	1.631459
9	-0.334364	1.634507
8	-0.522748	1.255138
0	0.664857	-0.226274
7	-0.078326	0.855500
3) 按值排序
# 按值排序
# 它接受一个by参数,该参数值是要排序数列的  DataFrame 列名
unsorted_df = pd.DataFrame({'col1':[2,1,1,1],'col2':[1,3,2,4]})
sorted_df = unsorted_df.sort_values(by='col1')
sorted_df

	col1 col2
1	1	3
2	1	2
3	1	4
0	2	1
# 使用这个col2的索引值不会变
unsorted_df = pd.DataFrame({'col1':[2,1,1,1],'col2':[1,3,2,4]})
sorted_df = unsorted_df.sort_values(by=['col2','col1'])
sorted_df

col1	col2
0	2	1
2	1	2
1	1	3
3	1	4

#sort_values() 提供了参数kind用来指定排序算法。这里有三种排序算法:
#mergesort
#heapsort
#quicksort
# 默认为 quicksort(快速排序) ,其中 Mergesort 归并排序是最稳定的算法


 204
204


 被折叠的 条评论
为什么被折叠?
被折叠的 条评论
为什么被折叠?
 到【灌水乐园】发言


