


warning off
% 透镜参数
centerThickness = 3; % 中心厚度 (mm)
convexRadius = 100; % 凸面曲率半径 (mm)
% 光波参数
wavelengths = [480, 550, 632.8]; % 波长 (nm)
refractiveIndices = [1.523, 1.519, 1.515]; % 折射率
% 创建图像窗口
figure;
% 计算并绘制球差图像
subplot(2, 1, 1);
z = linspace(-convexRadius, convexRadius, 1000); % 透镜表面位置
sphericalAberration = zeros(size(z)); % 球差
for i = 1:length(wavelengths)
focalLength = (convexRadius * refractiveIndices(i)) / (refractiveIndices(i) - 1);
sphericalAberration = sphericalAberration + (1/(focalLength * refractiveIndices(i))) * (z.^2 - convexRadius^2);
end
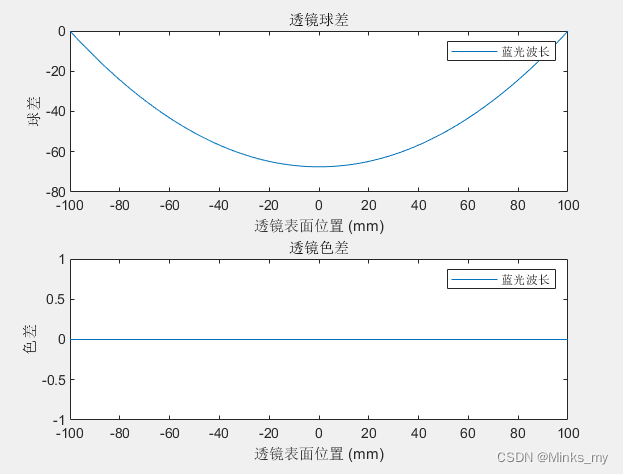
plot(z, sphericalAberration);
xlabel('透镜表面位置 (mm)');
ylabel('球差');
legend('蓝光波长', '绿光波长', '红光波长');
title('透镜球差');
% 计算并绘制色差图像
subplot(2, 1, 2);
colorAberration = zeros(size(z)); % 色差
for i = 1:length(wavelengths)
focalLength = (convexRadius * refractiveIndices(i)) / (refractiveIndices(i) - 1);
colorAberration = colorAberration + (1/focalLength) * (refractiveIndices(i) - refractiveIndices(1));
end
plot(z, colorAberration);
xlabel('透镜表面位置 (mm)');
ylabel('色差');
legend('蓝光波长', '绿光波长', '红光波长');
title('透镜色差');
% 运行以上代码将生成一个包含球差和色差的图像窗口。球差图像展示了不同波长光线通过透镜产生的聚焦效果的差异,
% 球差与透镜表面位置相关。色差图像展示了不同波长光线经过透镜后在焦点位置的偏移,色差与透镜的折射率差异有关。
%
% 通过这些图像,可以更好地理解成像系统中球差和色差的影响,并进行相应的讨论和分析。


 5006
5006


 被折叠的 条评论
为什么被折叠?
被折叠的 条评论
为什么被折叠?
 到【灌水乐园】发言


