


pip show numpy
Name: numpy
Version: 1.21.5
Summary: NumPy is the fundamental package for array computing with Python.
Home-page: https://www.numpy.org
Author: Travis E. Oliphant et al.
Author-email:
License: BSD
Location: c:\users\administrator\anaconda3\lib\site-packages
Requires:
Required-by: astropy, bkcharts, bokeh, Bottleneck, daal4py, datashader, datashape, gensim, h5py, holoviews, hvplot, imagecodecs, imageio, matplotlib, mkl-fft, mkl-random, numba, numexpr, pandas, patsy, pyerfa, PyWavelets, scikit-image, scikit-learn, scipy, seaborn, statsmodels, tables, tifffile, xarray
Note: you may need to restart the kernel to use updated packages.
在 [2] 中:
pip install numpy
Requirement already satisfied: numpy in c:\users\administrator\anaconda3\lib\site-packages (1.21.5)
Note: you may need to restart the kernel to use updated packages.
在 [3] 中:
pip show matplotlib
Name: matplotlib
Version: 3.5.2
Summary: Python plotting package
Home-page: https://matplotlib.org
Author: John D. Hunter, Michael Droettboom
Author-email: matplotlib-users@python.org
License: PSF
Location: c:\users\administrator\anaconda3\lib\site-packages
Requires: cycler, fonttools, kiwisolver, numpy, packaging, pillow, pyparsing, python-dateutil
Required-by: seaborn
Note: you may need to restart the kernel to use updated packages.
Numpy最重要的一个特点是其N维数组对象ndarray,它是用于存放同类型元素的多维数组,ndarray中的每个元素在内存中占有相同大小的区域。
二,对象ndarray的常用方法
在 [5] 中:
import numpy as np
在[7]中:
arr = np.array([4,8,6,7,3]) #创建数组对象arr
在[8]中:
arr.shape #形状为一维数组 一行五列
输出[8]:
(5,)
在 [9] 中:
arr.ndim #数组的维度为1维
输出[9]:
1
在[10]中:
arr.size #数组的个数
输出[10]:
5
在[13]中:
arr2 = np.array([[1,3,5,4],[7,8,6,4]])
在[14]中:
arr2.shape #两行四列
输出[14]:
(2, 4)
在[15]中:
arr2.ndim #二维
输出[15]:
2
在[16]中:
arr2.size #八个
输出[16]:
8
在[17]中:
arr2.dtype
输出[17]:
dtype('int32')
在[19]中:
np.arange(1,100,3)
出[19]:
33
在[21]中:
np.linspace(10,100,5)
输出[21]:
array([ 10. , 32.5, 55. , 77.5, 100. ])
在[23]中:
np.logspace(10,100,10)
输出[23]:
array([1.e+010, 1.e+020, 1.e+030, 1.e+040, 1.e+050, 1.e+060, 1.e+070,
       1.e+080, 1.e+090, 1.e+100])
在[28]中:
arr4 = np.zeros([3,5,5])
在[29]中:
arr4
出[29]:
array([[[0., 0., 0., 0., 0.],
        [0., 0., 0., 0., 0.],
        [0., 0., 0., 0., 0.],
        [0., 0., 0., 0., 0.],
        [0., 0., 0., 0., 0.]],

       [[0., 0., 0., 0., 0.],
        [0., 0., 0., 0., 0.],
        [0., 0., 0., 0., 0.],
        [0., 0., 0., 0., 0.],
        [0., 0., 0., 0., 0.]],

       [[0., 0., 0., 0., 0.],
        [0., 0., 0., 0., 0.],
        [0., 0., 0., 0., 0.],
        [0., 0., 0., 0., 0.],
        [0., 0., 0., 0., 0.]]])
In [30]:
np.ones([4,6])
Out[30]:
array([[1., 1., 1., 1., 1., 1.],
       [1., 1., 1., 1., 1., 1.],
       [1., 1., 1., 1., 1., 1.],
       [1., 1., 1., 1., 1., 1.]])
In [31]:
np.empty([3,8])
Out[31]:
array([[1., 1., 1., 1., 1., 1., 1., 1.],
       [1., 1., 1., 1., 1., 1., 1., 1.],
       [1., 1., 1., 1., 1., 1., 1., 1.]])
三,ndarray对象的索引与切片
In [39]:
arr = np.arange(10).reshape(2,5)
In [40]:
arr
Out[40]:
array([[0, 1, 2, 3, 4],
       [5, 6, 7, 8, 9]])
In [41]:
arr[0,3]
Out[41]:
3
In [42]:
arr[slice(2,3)]
Out[42]:
array([], shape=(0, 5), dtype=int32)
In [45]:
arr = np.arange(0,20,2)
In [46]:
arr
Out[46]:
array([ 0, 2, 4, 6, 8, 10, 12, 14, 16, 18])
In [47]:
arr[1:6]
Out[47]:
array([ 2, 4, 6, 8, 10])
In [48]:
arr[slice(1,6,2)]
Out[48]:
array([ 2, 6, 10])
In [51]:
arr6 = np.arange(24).reshape(4,6)
In [52]:
arr6
Out[52]:
array([[ 0,  1,  2,  3,  4,  5],
       [ 6,  7,  8,  9, 10, 11],
       [12, 13, 14, 15, 16, 17],
       [18, 19, 20, 21, 22, 23]])
In [53]:
arr7 = arr6[1:3,0:4]
In [54]:
arr7
Out[54]:
array([[ 6,  7,  8,  9],
       [12, 13, 14, 15]])
In [57]:
arr7 = arr6[0:2,1:4]
In [59]:
arr7
Out[59]:
array([[1, 2, 3],
       [7, 8, 9]])
四,Numpy的通用函数
1.数学函数
2.随机函数
3.统计函数
4.其他函数
五,数组运算
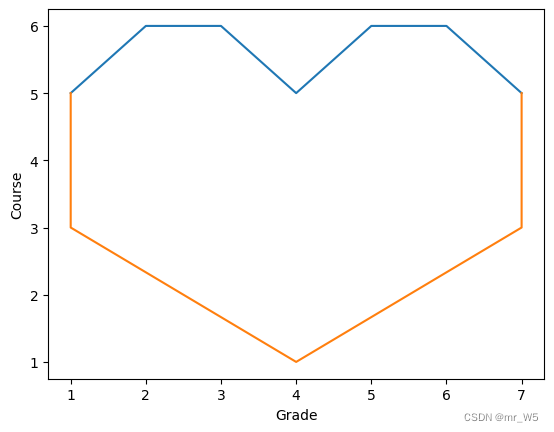
六,matplotlib数据可视化数据库的应用
在[65]中:
import matplotlib.pyplot as plt
在[93]中:
plt.plot([1,2,3,4,5,6,7],[5,6,6,5,6,6,5])
plt.plot([1,1,4,7,7],[5,3,1,3,5])
plt.xlabel('Grade')
plt.ylabel('Course')
#plt.axis([-5,5,-5,5])

plt.savefig('../R&Q_pic/test0.png',dpi = 600)


 577
577

 被折叠的 条评论
为什么被折叠?
被折叠的 条评论
为什么被折叠?
 到【灌水乐园】发言


