


 本文介绍了matplotlib库在Python中的基本绘图功能,包括容器类如图、坐标系、刻度等,以及各种类型的绘图方法如线形图、直方图、条形图、饼图和散点图等,并展示了如何设置标签、图例、保存图片等关键操作。
一,matplotlib.pyplot绘图相关的对象:
1,容器类:图(figure),坐标系(axes),坐标轴(axis),刻度(tick)
2,基础类:线(line),点(marker),文本(text),图例(legend),网格(grid),标题(title)
二,绘图的类型:
1,线形图:plot()
2,直方图:hist()
3,条形图:bar()
4,饼图:pie()
5,散点图:scatter()
6,3D图:from mpl_toolkits.mplt3d import Axes3D
7,动态交互图:pyecharts
在 [1] 中:
pip show matplotlib
Name: matplotlib
Version: 3.5.2
Summary: Python plotting package
Home-page: https://matplotlib.org
Author: John D. Hunter, Michael Droettboom
Author-email: matplotlib-users@python.org
License: PSF
Location: c:\users\administrator\anaconda3\lib\site-packages
Requires: cycler, fonttools, kiwisolver, numpy, packaging, pillow, pyparsing, python-dateutil
Required-by: seaborn
Note: you may need to restart the kernel to use updated packages.
在 [3] 中:
import matplotlib.pyplot as plt   #导入第三方数据可视化库matplotlib中的pyplot绘图模块
import numpy as np                #导入科学计算库
在[37]中:
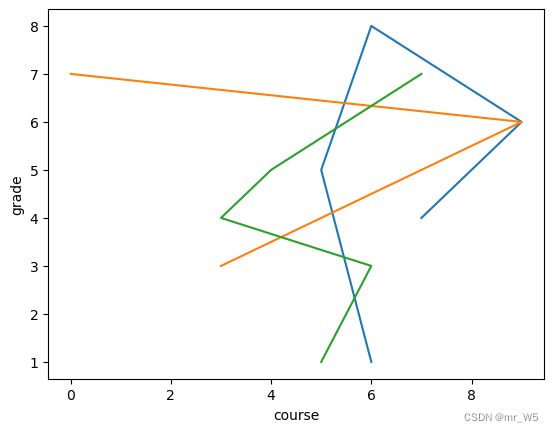
#1,线形图:plot()
plt.plot([6,5,6,9,7],[1,5,8,6,4])   #蓝
plt.plot([3,5,7,9,0],[3,4,5,6,7])   #橙
plt.plot([5,6,3,4,7],[1,3,4,5,7])   #绿
plt.xlabel('course')                #x轴坐标标签,坐标系默认为英文,如果需要显示中文另加说明
plt.ylabel('grade')                 #y轴坐标标签

plt.savefig('../R&Q_pic/test_0.png',dpi=600)
在[38]中:
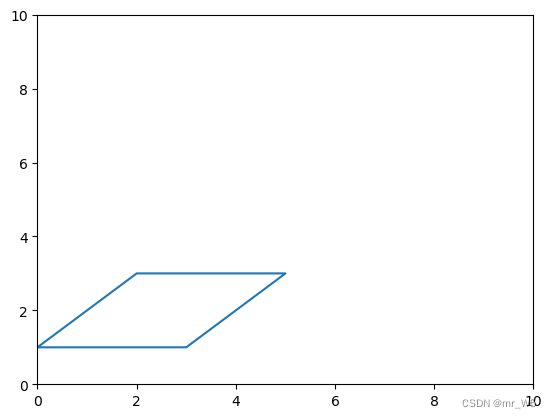
plt.axis([0,10,0,10])
plt.plot([0,2,5,3,0],[1,3,3,1,1])
plt.savefig('../R&Q_pic/test_1.png',dpi=600)
在[46]中:
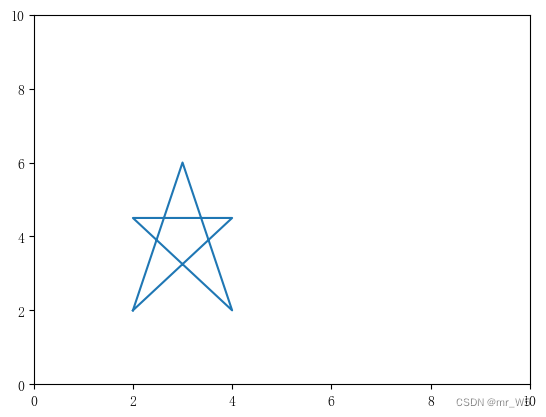
plt.axis([0,10,0,10])
plt.plot([2,3,4,2,4,2],[2,6,2,4.5,4.5,2])
#plt.savefig('../R&Q_pic/test_2.png',dpi=600)
Out[46]:
[<matplotlib.lines.Line2D at 0x1de8831e070>]
In [49]:
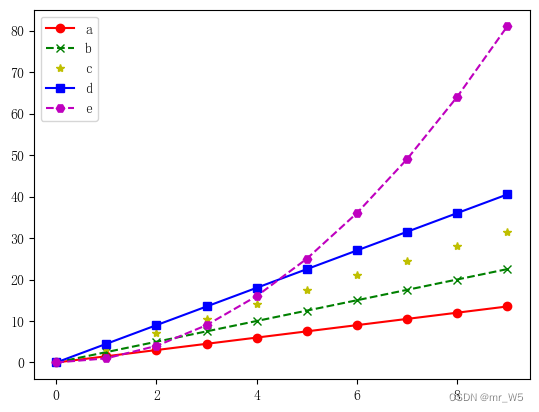
a = np.arange(10)
plt.plot(a,a*1.5,'ro-',label='a')
plt.plot(a,a*2.5,'gx--',label='b')
plt.plot(a,a*3.5,'y*',label='c')
plt.plot(a,a*4.5,'bs-',label='d')
plt.plot(a,a**2,'mH--',label='e')
plt.savefig('../R&Q_pic/test_3.png',dpi=600)
plt.legend()

plt.savefig('../R&Q_pic/test_2.png',dpi=600)

plt.show()
In [50]:
plt.rcParams['font.family'] = 'YouYuan'
x = np.arange(0,4,0.02)
y_1 = np.sin(np.pi*x)+2
y_2 = np.cos(np.pi*x)
plt.plot(x,y_1,'mx')
plt.plot(x,y_2,'r')
plt.legend(['正弦曲线','余弦曲线'])
plt.title('正弦曲线图')

plt.savefig('../R&Q_pic/test_3.png',dpi=600)

plt.show()
C:\Users\Administrator\AppData\Local\Temp\ipykernel_784\1025566485.py:10: UserWarning: Glyph 8722 (\N{MINUS SIGN}) missing from current font.
  plt.savefig('../R&Q_pic/test_3.png',dpi=600)

In [51]:
np.arange(0,4,0.02)
Out[51]:
array([0.  , 0.02, 0.04, 0.06, 0.08, 0.1 , 0.12, 0.14, 0.16, 0.18, 0.2 ,
       0.22, 0.24, 0.26, 0.28, 0.3 , 0.32, 0.34, 0.36, 0.38, 0.4 , 0.42,
       0.44, 0.46, 0.48, 0.5 , 0.52, 0.54, 0.56, 0.58, 0.6 , 0.62, 0.64,
       0.66, 0.68, 0.7 , 0.72, 0.74, 0.76, 0.78, 0.8 , 0.82, 0.84, 0.86,
       0.88, 0.9 , 0.92, 0.94, 0.96, 0.98, 1.  , 1.02, 1.04, 1.06, 1.08,
       1.1 , 1.12, 1.14, 1.16, 1.18, 1.2 , 1.22, 1.24, 1.26, 1.28, 1.3 ,
       1.32, 1.34, 1.36, 1.38, 1.4 , 1.42, 1.44, 1.46, 1.48, 1.5 , 1.52,
       1.54, 1.56, 1.58, 1.6 , 1.62, 1.64, 1.66, 1.68, 1.7 , 1.72, 1.74,
       1.76, 1.78, 1.8 , 1.82, 1.84, 1.86, 1.88, 1.9 , 1.92, 1.94, 1.96,
       1.98, 2.  , 2.02, 2.04, 2.06, 2.08, 2.1 , 2.12, 2.14, 2.16, 2.18,
       2.2 , 2.22, 2.24, 2.26, 2.28, 2.3 , 2.32, 2.34, 2.36, 2.38, 2.4 ,
       2.42, 2.44, 2.46, 2.48, 2.5 , 2.52, 2.54, 2.56, 2.58, 2.6 , 2.62,
       2.64, 2.66, 2.68, 2.7 , 2.72, 2.74, 2.76, 2.78, 2.8 , 2.82, 2.84,
       2.86, 2.88, 2.9 , 2.92, 2.94, 2.96, 2.98, 3.  , 3.02, 3.04, 3.06,
       3.08, 3.1 , 3.12, 3.14, 3.16, 3.18, 3.2 , 3.22, 3.24, 3.26, 3.28,
       3.3 , 3.32, 3.34, 3.36, 3.38, 3.4 , 3.42, 3.44, 3.46, 3.48, 3.5 ,
       3.52, 3.54, 3.56, 3.58, 3.6 , 3.62, 3.64, 3.66, 3.68, 3.7 , 3.72,
       3.74, 3.76, 3.78, 3.8 , 3.82, 3.84, 3.86, 3.88, 3.9 , 3.92, 3.94,
       3.96, 3.98])
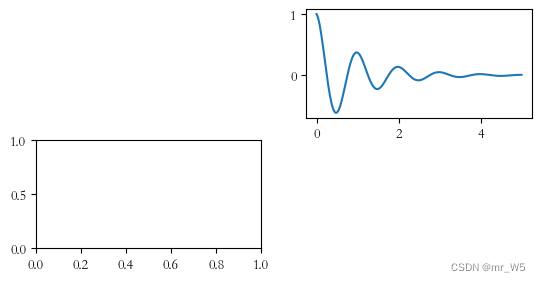
In [61]:
def f(t):
    return np.exp(-t)*np.cos(2*np.pi*t)
a=np.arange(0,5,0.02)

plt.subplot(322)
plt.plot(a,f(a))

plt.subplot(323)
plt.plot(a,np.cos(2))
plt.legend()
plt.savefig('../R&Q_pic/test_5.png',dpi=600)

plt.show()
---------------------------------------------------------------------------
ValueError                                Traceback (most recent call last)
~\AppData\Local\Temp\ipykernel_784\3044356631.py in <module>
      7
      8 plt.subplot(323)
----> 9 plt.plot(a,np.cos(2))
     10 plt.legend()
     11 plt.savefig('../R&Q_pic/test_5.png',dpi=600)

~\anaconda3\lib\site-packages\matplotlib\pyplot.py in plot(scalex, scaley, data, *args, **kwargs)
   2767 @_copy_docstring_and_deprecators(Axes.plot)
   2768 def plot(*args, scalex=True, scaley=True, data=None, **kwargs):
-> 2769     return gca().plot(
   2770         *args, scalex=scalex, scaley=scaley,
   2771         **({"data": data} if data is not None else {}), **kwargs)

~\anaconda3\lib\site-packages\matplotlib\axes\_axes.py in plot(self, scalex, scaley, data, *args, **kwargs)
   1630         """
   1631         kwargs = cbook.normalize_kwargs(kwargs, mlines.Line2D)
-> 1632         lines = [*self._get_lines(*args, data=data, **kwargs)]
   1633         for line in lines:
   1634             self.add_line(line)

~\anaconda3\lib\site-packages\matplotlib\axes\_base.py in __call__(self, data, *args, **kwargs)
    310                 this += args[0],
    311                 args = args[1:]
--> 312             yield from self._plot_args(this, kwargs)
    313
    314     def get_next_color(self):

~\anaconda3\lib\site-packages\matplotlib\axes\_base.py in _plot_args(self, tup, kwargs, return_kwargs)
    496
    497         if x.shape[0] != y.shape[0]:
--> 498             raise ValueError(f"x and y must have same first dimension, but "
    499                              f"have shapes {x.shape} and {y.shape}")
    500         if x.ndim > 2 or y.ndim > 2:

ValueError: x and y must have same first dimension, but have shapes (250,) and (1,)
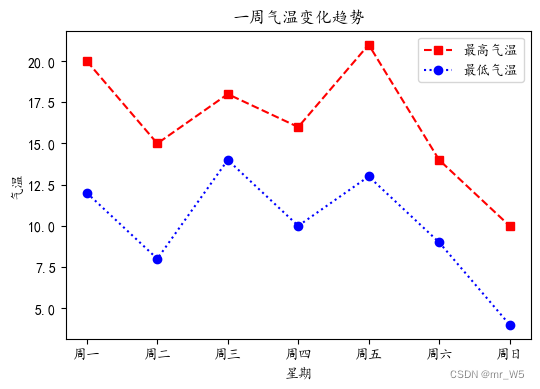
In [52]:
plt.figure(num='气温趋势',figsize=(6,4))
plt.rcParams['font.family'] = 'Kaiti'
x = ['周一','周二','周三','周四','周五','周六','周日']
y_1=[20,15,18,16,21,14,10]
y_2=[12,8,14,10,13,9,4]
plt.title('一周气温变化趋势')
plt.xlabel('星期')
plt.ylabel('气温')
plt.plot(x,y_1,'rs--',label='最高气温')
plt.plot(x,y_2,'bo:',label='最低气温')
plt.legend()

plt.savefig('../R&Q_pic/test_5.png',dpi=600)

plt.show()
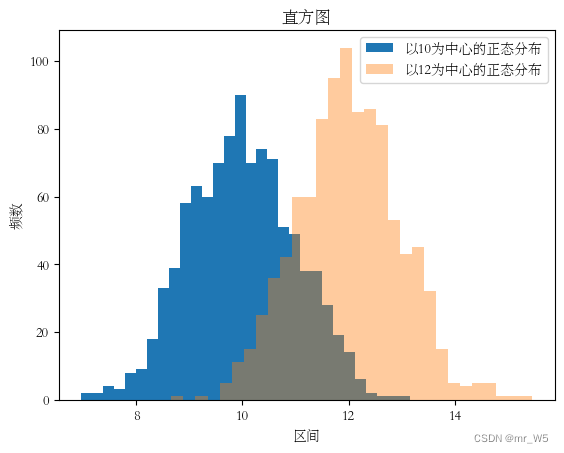
In [55]:
plt.rcParams['font.family']='STSong'

datas_1 = 10 + np.random.randn(1000)
datas_2 = 12 + np.random.randn(1000)
plt.hist(datas_1,bins=30)
plt.hist(datas_2,bins=30,alpha=0.4)
plt.legend(['以10为中心的正态分布','以12为中心的正态分布'])
plt.title('直方图')
plt.xlabel('区间')
plt.ylabel('频数')

plt.savefig('../R&Q_pic/test_6.png',dpi=600)

plt.show()
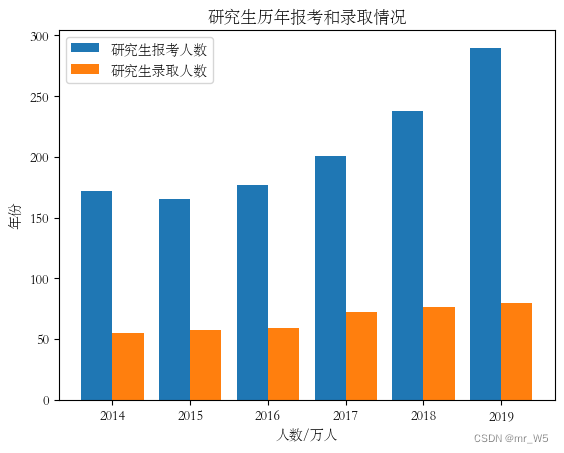
在[59]中:
plt.rcParams['font.family']='STSong'
years= ['2014','2015','2016','2017','2018','2019']
baokao_nums = [172,164.9,177,201,238,290]
luqu_nums = [54.87,57.06,58.98,72.22,76.25,79.3]

x = range(len(years))
plt.bar(x,height=baokao_nums,width=0.4)
plt.bar([i + 0.4 for i in x],luqu_nums,width=0.4)
plt.xticks([i + 0.2 for i in x],years)
plt.legend(['研究生报考人数','研究生录取人数'])
plt.title('研究生历年报考和录取情况')
plt.xlabel('人数/万人')
plt.ylabel('年份')

plt.savefig('../R&Q_pic/test_7.png',dpi=600)

plt.show()


 4万+
4万+


 被折叠的 条评论
为什么被折叠?
被折叠的 条评论
为什么被折叠?
 到【灌水乐园】发言


