


QwtPlot是用来绘制二维图像的widget。在它的画板上可以无限制的显示绘画组件。绘画组件可以是曲线(QwtPlotCurve)、标记(QwtPlotMarker)、网格(QwtPlotGrid)、或者其它从QwtPlotItem继承的组件。
QwtPlot拥有4个axes(轴线)
| yLeft | Y axis left of the canvas. |
| yRight | Y axis right of the canvas. |
| xBottom | X axis below the canvas. |
| xTop | X axis above the canvas. |
常用函数接口
| setAxisTitle | 设置轴标题 |
| enableAxis | 主要是显示xTop,yRight坐标轴 |
| setAxisMaxMajor | 设置某个某个坐标轴扩大比例尺的最大间隔数目 |
| setAxisMaxMinor | 设置某个某个坐标轴缩小比例尺的最大间隔数目 |
| setAxisScale | 禁用自动缩放比例尺,为某个坐标轴指定一个修改的比例尺 |
| insertLegend | 添加图例(标注) |
常用组件
| QwtPlotCurve | 曲线 |
| QwtPlotMarker | 标记 |
| QwtPlotGrid | 网格 |
| QwtPlotHistogram | 直方图 |
| other | 从QwtPlotItem继承的组件 |
| QwtPlotItem | plot能显示的类,如果想要实现自己绘画图形,要继承此类实现rtti和draw接口 |
| QwtPlotPanner | 平移器 (用鼠标左键平移) |
| QwtPlotMagnifier | 放大器 (用鼠标滚轮缩放) |
| QwtPlotCanvas | 画布 |
| QwtScaleMap | 比例图---可以提供一个逻辑区域到实际区域的坐标转换 |
| QwtScaleWidget | 比例窗口 |
| QwtScaleDiv | 比例布局 |
| QwtLegent | 标注 |
| QwtPlotLayout | 布局管理器 |
| QwtScaleDraw | 自画坐标轴 |
QwtPlotCure简介
常见接口
| setPen | 设置画笔 |
| setData | 设置曲线的数据 |
| setStyle | 设置曲线形式,点、直线、虚线等等 |
| setCurveAttribute | 设置曲线属性,一般设置Fitted |
| attch | 把曲线附加到QwlPlot上 |
下面看一个小例子,结果如下:
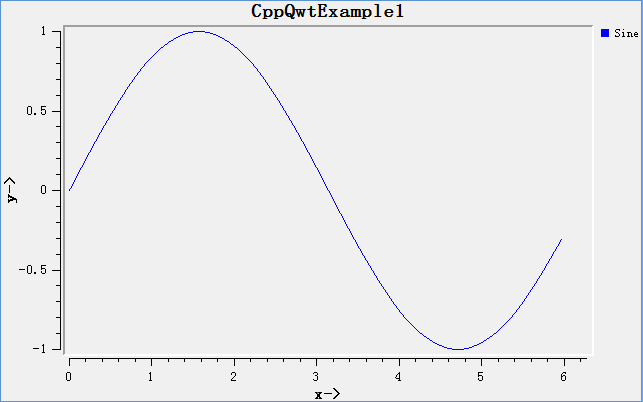
源代码:


 1万+
1万+

 被折叠的 条评论
为什么被折叠?
被折叠的 条评论
为什么被折叠?
 到【灌水乐园】发言


