


 VirusTotalGraph是一款强大的在线可视化工具,能够帮助安全研究人员从文件、URL、域名和IP地址中发现关联,揭示潜在的威胁情报。通过整合VirusTotal的大量数据集,该工具可以展示文件提交日期、批次以及重复提交次数等信息,对于拥有VirusTotal Intelligence权限的用户,还能获取更多深入分析。这款工具不仅适用于APT集团分析,也能用于常见恶意软件的研究,通过添加IoC并绘制其关系网,研究人员可以保存并分享他们的发现。
A few days ago, I bumped into a new post from folks from VirusTotal announcing the VirusTotal Graph, the tool not only caught my attention from who it was coming from, but also because the huge impact for the Infosec Industry, and I believe that a lot of us should check it out!
Visualisations can help investigators to identify links between files, domains and other entities that can shed some light into an question/idea or simply help to identify information that has not been surfaced yet.
What’s the tool?
It’s a graph!
If you’ve ever used Maltego from Paterva, during your investigations/pentest or any other work where you needed to visually represent relationships between different entities this will look familiar. This one it’s online and can be easily shared among researchers, include the files/links in your blog or paper to help other investigators or security enthusiast to understand what you did.
This one, is built on top of VirusTotal’s dataset, what makes it pretty powerful to display and look into submission dates, batches of files sent together and how many times a file has been sent, if you do have access to Virus Total Intelligence you can even get more out of it!
How you can use it?
There are two pretty cool videos that highlight the main usages of the tool, starting from files, urls, domains or IP Addresses. You can share the relationships between a set of files belonging to an APT Groups or to common malware that you looked at.
Add any of the IoC you looked into and draft the relationships between them, save it and share in your post, article o paper.
Adding Files
You can easily add files by hash, and you’ll get insights into detection rates, other files that were submitted in the same bundles and direct links to public data and also to Virus Total Intelligence:
Full video: https://www.youtube.com/watch?v=QEqHXU04IkI&feature=youtu.be
Adding URLs, Domains and IPs
Similar information can be automatically pulled out for URLs and domains, the tools will add data about the domain resolutions or details in VT’s public report.
When adding domains you can easily surface siblings, and even the IP addresses where they resolve, you can complete this data with other Threat Intelligence services or public tools
Full video: https://www.youtube.com/watch?v=xe2busIlkP4&feature=youtu.be
Test run with a public report
As a way to try how this work and how much information it can display I gave it a run with one of the latest publications from ESET’s about Turla. I only had to copy some of the IoC including hashes, C&Cs and domains to see what I could find out.
This is how it looks like:
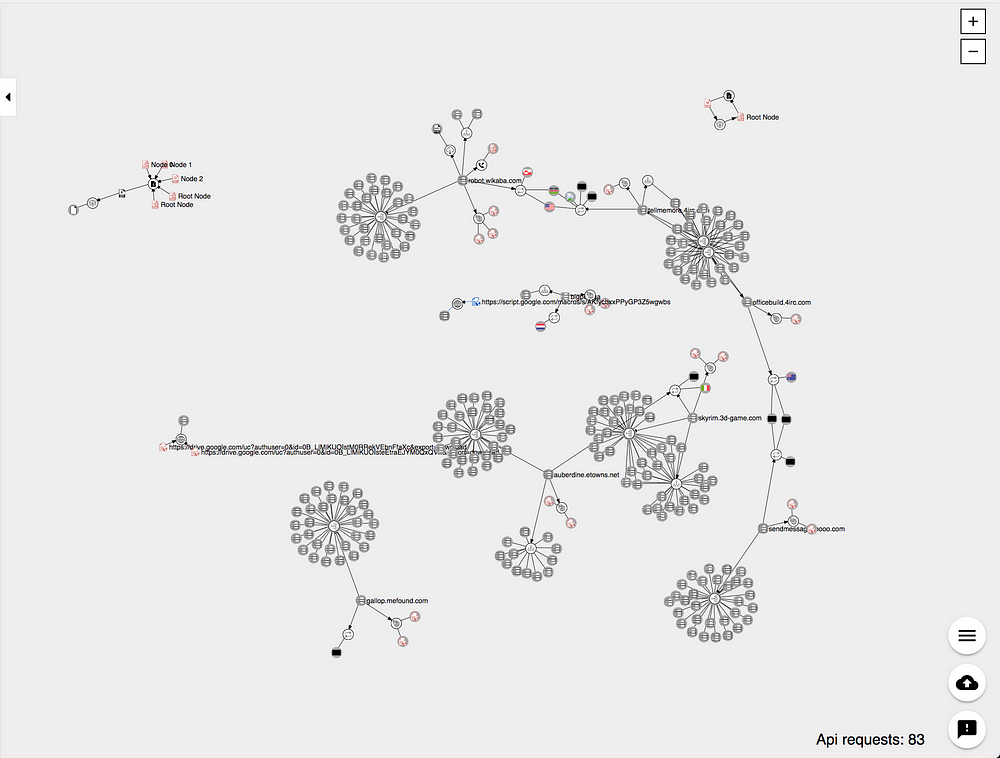
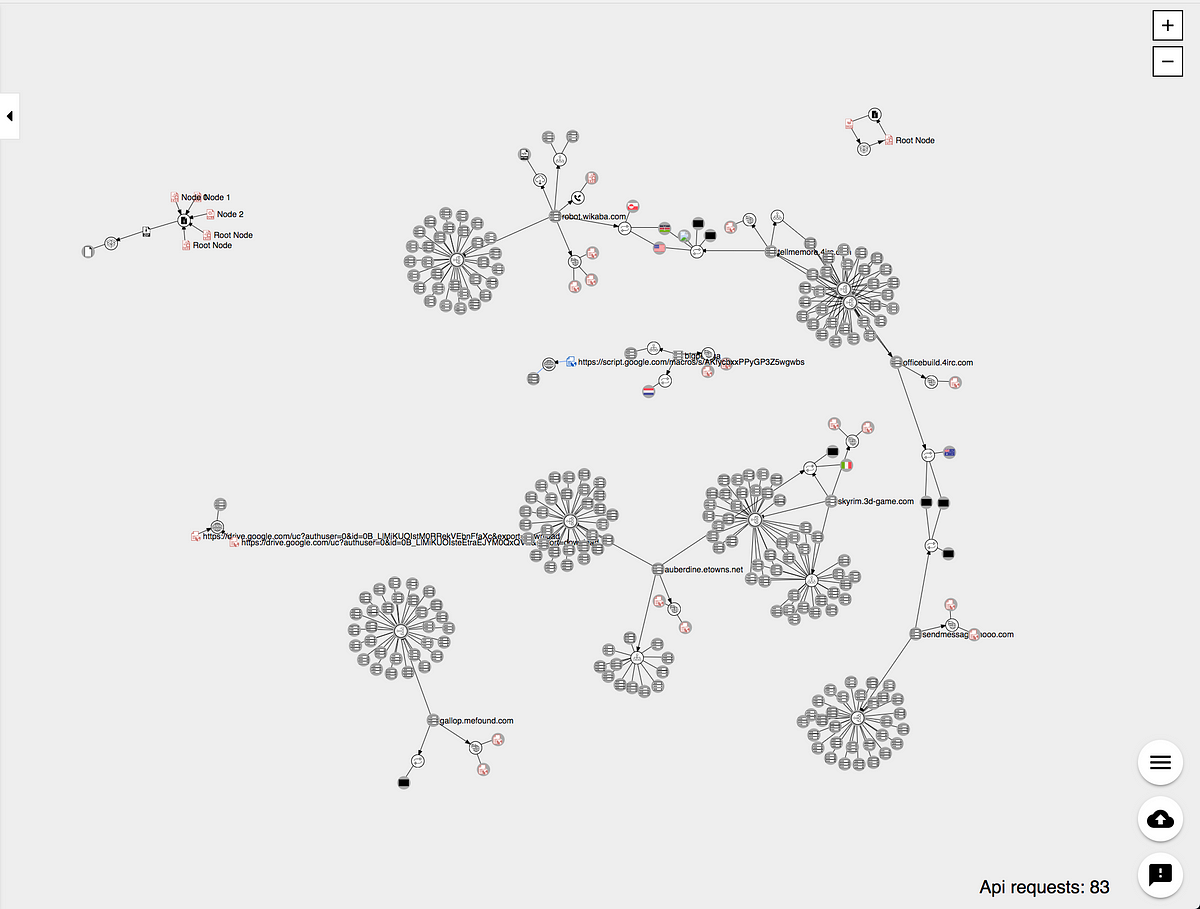
Turla Mosquito files and C&Cs in VirusTotal’s Graph
Some of the key takeaways is that more information than what was published in the paper was surfaced. Not only sibling domains, but detections to some of them shed light that they might be malicious.
Data about the domains including IP addresses and hosting information is added by default and this can show how diverse the infrastructure is for this APT operation that has been active for the last couple of years.
If you want to take a sneak peak you can access yourself, as the information is public here. As usual, do not forget to read the Docs for any questions, issues or ideas you might bump into.
Hunt and Share
Not everybody likes to share details about their investigations, but based on public reports and other information alike security enthusiast can review data published by vendors, or even share some of the investigations they’ve done by themselves.
I usual, tools as VirusTotal Graph can enhance the community sharing capabilities and will take some time to sink in, but it is a great step towards a better communication and fact checking among researchers.
Happy hunting :-)
https://medium.com/secjuice/playing-around-with-virustotal-graph-8cce7a1681ee


 4238
4238

 被折叠的 条评论
为什么被折叠?
被折叠的 条评论
为什么被折叠?
 到【灌水乐园】发言


