


Step through your app’s state on the GPU using various Metal tools in Xcode.
内容:在Xcode中使用Metal变量来步进显卡的程序状态
说明:本文需要结合前面一个程序来熟练 Metal调试。
没有下载内容。
Overview
To understand how the computer runs your app or to debug problems, you typically use a debugger. Traditional传统的 debuggers work by pausing on a single thread, but this doesn’t work very well with Metal apps. Xcode provides提供了 a debugger specifically针对性的调试器 for Metal through its frame capture workflow.
To debug a Metal app with the Metal debugger, you capture捕获 a single frame of animation and examine the commands that the app generated to create it.
In this article, you run the Using a Render Pipeline to Render Primitives example through Xcode’s Metal debugger to learn how to examine a Metal app at runtime. 这篇文档,通过运行《Using a Render Pipeline to render Primitives》例子来运行metal调试器,来学习如何实时检查Metal程序运行。
Enable the Metal Debugger in the Xcode Project
In the Rendering example, go into the project’s build settings and change the Metal compiler options so that the debug information includes source code for your shaders. Set “Produce debugging information” for Debug to “Yes, include source code”.
按下图所示打开Metal调试器
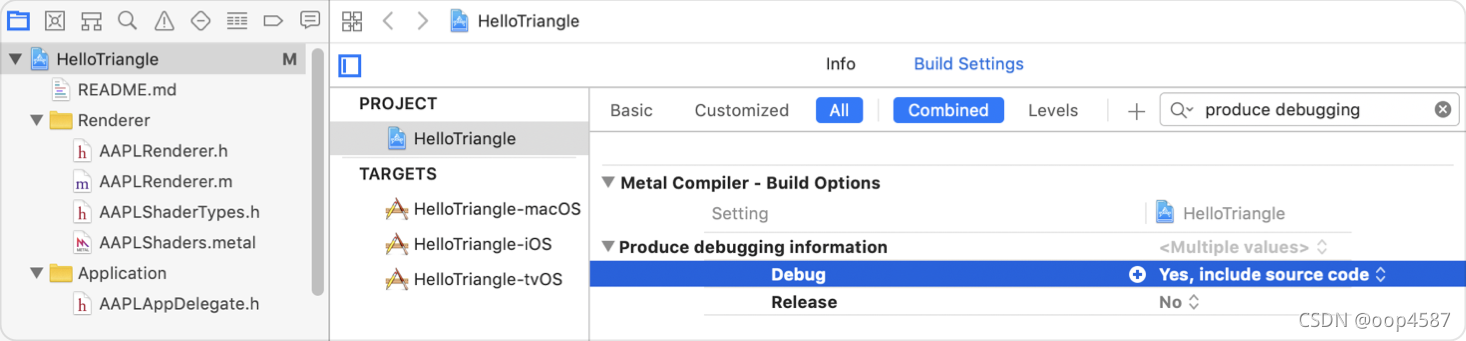
Apps shipped to customers shouldn’t contain debugging information, so set Release to No.
Capture a Frame 捕获一帧
The Metal Debugger works in conjunction结合 with Xcode’s Metal frame capture feature. To use the Metal Debugger, first you capture a frame using the following steps. 首先使用下面步骤捕获一帧。
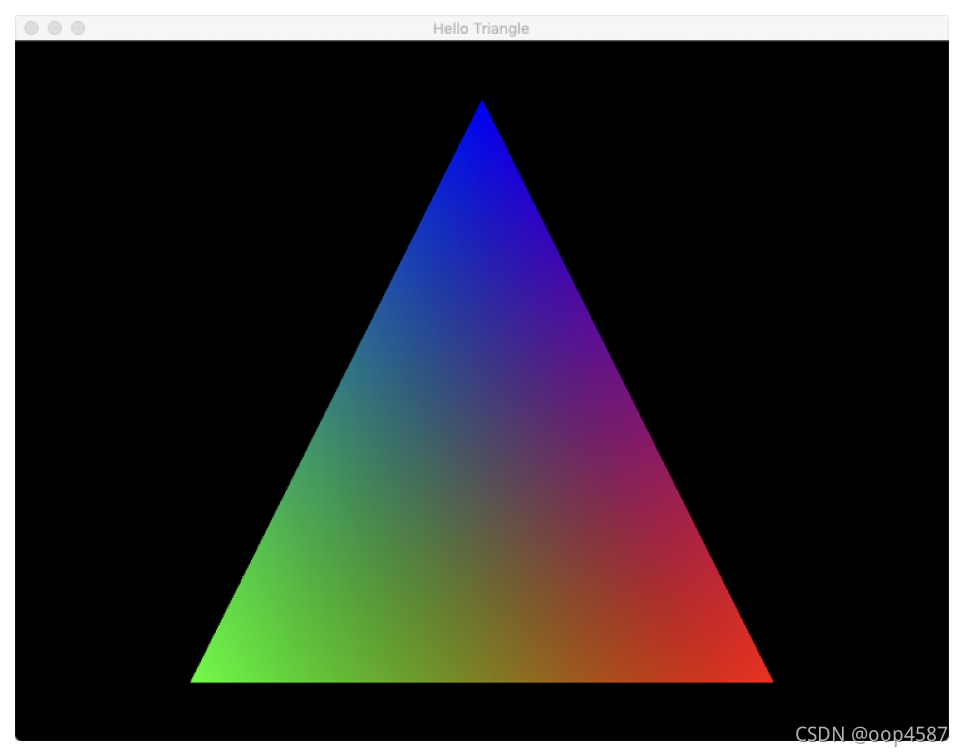
Build and run your project. In the case of Using a Render Pipeline to Render Primitives, the app displays a triangle.
While the app is running, return to Xcode and click the camera icon on the debugging toolbar: 在Xcode版本Version 13.0 (13A233)
 最低0.47元/天 解锁文章


 890
890


 被折叠的 条评论
为什么被折叠?
被折叠的 条评论
为什么被折叠?
 到【灌水乐园】发言


