


讲座地址URL:Accelerate Data Science in Python with RAPIDS, with Q&A from EMEA Region [S51281a]
1.引言
了解如何将Python数据科学和数据工程项目移植到开源、GPU加速的RAPID套件中,只需最少的代码更改。我们将介绍如何通过在带有RAPID的GPU上运行Pandas/scikit-learn/NumPy和相关库来大幅加速当前使用Pandas/schikit-learn/NumPy编写的工作负载的实用建议。我们将讨论数据操作、分析、机器学习和用户定义函数。最后,我们将讨论常见的“gotchas”以及在移植代码或维护需要在GPU和CPU上运行的代码库时需要注意的事项。演讲结束时,您将准备好开始转换现实世界中的管道以在GPU上运行。之前的RAPID经验是不必要的,但Python的知识将是重要的。
2.RAPIDS 为开源数据科学、工程生态圈带来数据加速解决方案

3.对Pandas等数据工程开发生态具有广泛支持
以cuDF为例:
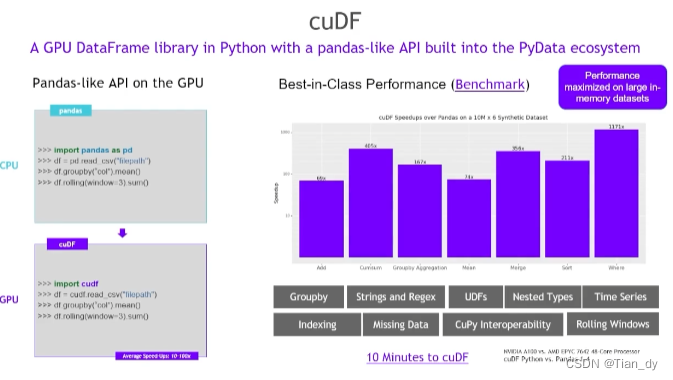
像Pandas一样调用方便快捷。
4.实操环节
本节内容主要是简单了解如何使用RAPIDS构建加速流程。
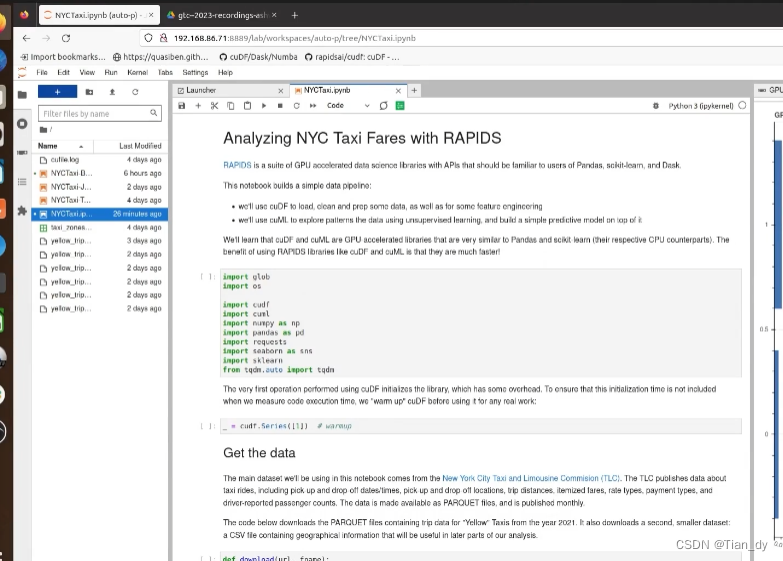
作者给出了相关构建测试Demo:
GitHub - shwina/rapids-tutorial-gtc-2023 👈可以去github
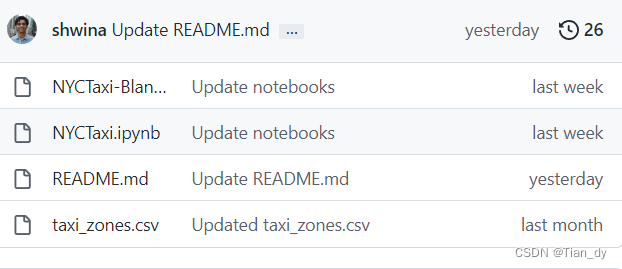
其中,NYCTaxi.pynb包含了演讲中的代码,并展示了如何在GPU加速的数据科学管道中使用cuDF和cuML库。NYCTaxi-Lank.ipynb是相同的,但包含一些#TODO部分作为练习。
可以使用pip安装包和依赖项:
pip install cudf-cu11 cuml-cu11 --extra-index-url=https://pypi.nvidia.com其他依赖:
pip install requests seaborn scikit-learn tqdm
pip install hvplot
另外可以在Google Colab进行notebook环境实验:
地址:colab.research.google.com/drive/1HMcxNFOudm7CbbOmQY5lDdYb0YD7Tj0z
在讲座中举RAPID分析纽约市出租车票价的例子:
导入的包:
import glob
import os

import cudf
import cuml
import numpy as np
import pandas as pd
import requests
import seaborn as sns
import sklearn
from tqdm.auto import tqdm
使用cuDF执行的第一个操作初始化库,这会带来一些开销。为了确保在测量代码执行时间时不包括此初始化时间,我们在将cuDF用于任何实际工作之前对其进行“预处理”:
_ = cudf.Series([1]) # warmup主要数据集来自纽约市出租车和豪华轿车委员会(TLC)。TLC发布了有关出租车骑行的数据,包括接送日期和下车日期,接送地点,旅行距离,列出的票价,费率类型,付款类型以及驾驶员报告的乘客数量。数据可作为镶木文件提供,并每月发布。下面的代码下载了包含2021年“黄色”出租车的Trip数据的镶木文件。它还下载了第二个,较小的数据集:一个包含地理信息的CSV文件,该文件将在我们分析的后期部分中很有用。
def download(url, fname):
    """
    Download file from `url`, writing the result to `fname`.
    If `fname` already exists, do nothing.
    """
    # this code adapted from the tqdm examples
    # https://github.com/tqdm/tqdm/blob/master/examples/tqdm_requests.py
    if os.path.exists(fname):
        return
    response = requests.get(url, stream=True)
    with tqdm.wrapattr(
        open(fname, "wb"),
        "write",
        unit="B",
        unit_scale=True,
        unit_divisor=1024,
        miniters=1,
        desc=fname,
        total=int(response.headers.get("content-length", 0)),
    ) as fout:
        for chunk in response.iter_content(chunk_size=4096):
            fout.write(chunk)


def download_taxi_data(n):
    """
    Download `n` months of taxi data.
    """
    base = "https://d37ci6vzurychx.cloudfront.net/trip-data/"
    fname = "yellow_tripdata_2021-{i:02d}.parquet"
    url = base + fname
    for i in range(1, n + 1):
        download(url.format(i=i), fname.format(i=i))


def download_taxi_zones():
    download(
        "https://gist.githubusercontent.com/shwina/72d79165ce9605d8f6e3378ae717b16b/raw/84a47bc587c99c6736f38a97f9dcc32ba8f89b05/taxi_zones.csv",
        "taxi_zones.csv",
    )


# adjust n between 1-12 depending on the size of analysis
download_taxi_data(n=6)
download_taxi_zones()
4.1 数据读取
首先,我们将使用Pandas.read_Parquet()函数将Parquet数据读取到Pandas数据帧中。然后,我们将看看如何对cuDF做同样的事情。
# TODO: Use Pandas to read all the parquet files into a variable
# named `df`. Use cUDF to do the same thing, and save the result to a
# variable named `gdf`

df = pd.read_parquet(sorted(list(glob.glob("*.parquet"))))
gdf = cudf.read_parquet(sorted(list(glob.glob("*.parquet"))))
print(type(df))
print(type(gdf))
display(df)
display(gdf)
需要注意的几点:
- cuDF提供类似Pandas的API。它不需要你学习一个新的库来利用GPU。
- cuDF有一个类似于pd.DataFrame的cuDF.DataFrame类型。两者之间的主要区别是,cuDF.Data Frame存在于GPU上,对它的任何操作都使用GPU而不是CPU(因此速度要快得多)
4.2 数据清洗
接下来,我们将对数据进行一些初步清理。
在下面定义了一个名为clean_columns的辅助函数。这个辅助函数接受Pandas DataFrame作为它的第一个参数,并做四件事:
- 将列名转换为全小写,并删除列名中任何多余的空格,丢弃我们不会在分析中使用的列。
- 将列强制转换为适当的数据类型。
- 将列中缺少的值(“nulls”)替换为sentinel值-1。
- 特别要注意对输入DataFrame df调用的操作:
def clean_columns(df, columns_to_keep, column_renames):
    """
    Perform column cleanup on the input DataFrame `df`.
    Drop any columns not present in `columns_to_keep`.
    Then, rename columns according to the mapping `column_renames`.
    Finally, cast any numeric columns from 64-bit to 32-bit data types,
    while filling any nulls that may be present with the sentinel
    value -1.

    Parameters
    ----------
    df: DataFrame
        Input dataframe
    columns_to_keep: list
        List of columns to keep in the result
    column_renames: dict
        Mapping that specifies the column renaming to apply

    Returns
    -------
    DataFrame
    """
    # rename columns
    colname_cleanup = {col: col.strip().lower() for col in df.columns}
    df = df.rename(columns=colname_cleanup)
    df = df.rename(column_renames, axis=1)

    # Simplify the payment_type column
    df["is_credit_card"] = df["payment_type"] == 1

    # Drop unwanted columns, and cast data down from
    # 64-bit type to 32-bit type when possible
    for col in df.columns:
        if col not in columns_to_keep:
            print(f"Dropping ({col})")
            df = df.drop(columns=col)
            continue

        # cast int64->int32, float64->float32
        # and fill nulls with -1
        dtype = df[col].dtype
        if dtype.kind in {"i", "f"}:
            if dtype.itemsize == 8:
                df[col] = df[col].astype(dtype.kind + str(dtype.itemsize))
            df[col] = df[col].fillna(-1)

    return df
clean _ column 命名为 df:
columns_to_keep = [
    "pickup_datetime",
    "dropoff_datetime",
    "passenger_count",
    "pickup_longitude",
    "pickup_latitude",
    "rate_code",
    "fare_amount",
    "pickup_location",
    "dropoff_location",
    "is_credit_card",
    "airport_fee",
]

column_renames = {
    "tpep_pickup_datetime": "pickup_datetime",
    "tpep_dropoff_datetime": "dropoff_datetime",
    "ratecodeid": "rate_code",
    "pulocationid": "pickup_location",
    "dolocationid": "dropoff_location",
}

df = clean_columns(df, columns_to_keep, column_renames)
display(df.head())
4.3 可视化和过滤数据
我们分析的下一步是识别数据中的任何统计异常,例如,由于人为错误而输入错误的数据?
这里作者使用的经典的可视化库Seaborn。
# TODO: using the cuDF DataFrame gdf, make a boxplot
# of the fare_amount to passenger_count using seaborn

sns.boxplot(x="passenger_count", y="fare_amount", data=gdf.to_pandas())
4.4 使用用户定义的函数计算行程距离:
此部分很有趣,Haversine距离公式给出了一个球上两个点之间的距离:
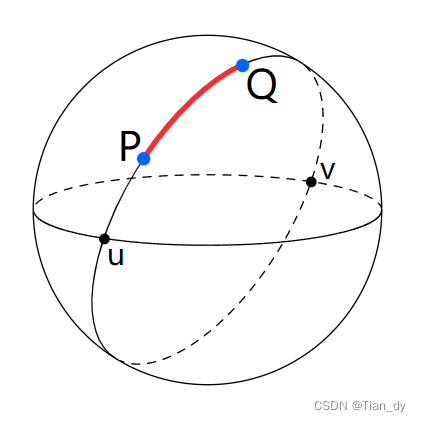
我们想使用”接”、“送”地点坐标之间的haversine距离来衡量行程距离。当然,这是一个近似值,因为大多数出租车出行都不是一条直线。但这足以在之后产生一些有用的解,并有助于说明如何将用户定义的函数与cuDF一起使用。
from math import asin, cos, pi, sin, sqrt


def haversine_distance(row):
    x_1, y_1, x_2, y_2 = (
        row["pickup_latitude"],
        row["pickup_longitude"],
        row["dropoff_latitude"],
        row["dropoff_longitude"],
    )
    x_1 = pi / 180 * x_1
    y_1 = pi / 180 * y_1
    x_2 = pi / 180 * x_2
    y_2 = pi / 180 * y_2

    dlon = y_2 - y_1
    dlat = x_2 - x_1
    a = sin(dlat / 2) ** 2 + cos(x_1) * cos(x_2) * sin(dlon / 2) ** 2

    c = 2 * asin(sqrt(a))
    r = 6371  # Radius of earth in kilometers

    return c * r

%%time
# need to remove string columns before using `apply()`
# in cuDF
gdf_numeric = gdf.select_dtypes(exclude="object")
gdf["h_distance"] = gdf_numeric.apply(haversine_distance, axis=1)
gdf.head()
在GPU上调用apply()的速度要快得多。
事实上,调用apply()所花费的大部分时间都在JIT编译中。如果再次运行UDF,将看到与第一次运行相比,它所花费的时间非常小。
4.6 用cuML拟合一个简单的监督模型
cuML支持大量的监督模型,所有这些模型都模拟scikit学习接口。参阅自述文件(https://github.com/rapidsai/cuml)查看最近的列表。尝试一个非常常见但功能强大的模型——用于分类的随机森林集合。具体来说,想对旅行是否用信用卡支付(正类)进行分类。
from cuml.ensemble import RandomForestClassifier as cuRandomForestClassifier
from sklearn.ensemble import RandomForestClassifier as skRandomForestClassifier

%%time

# Scikit-learn will parallelize over all CPU cores with n_jobs=-1

sk_model = skRandomForestClassifier(n_estimators=250, n_jobs=-1)
sk_model.fit(X_train_np, y_train_np)

%%time

# TODO: Build a similar model on GPU with cuML
# This is RandomForest estimator builds 250 separate trees, each of which tries to predict whether or
# not a transaction uses a credit card, then averages the results together. Note again that its' the same
# API as sklearn but significantly faster. These speedups typically get greater as the dataset grows.

cuml_model = cuRandomForestClassifier(n_estimators=250)
cuml_model.fit(X_train_gpu, y_train_gpu)

# Let's use the model to predict from the test set and evaluate the predictions' accuracy
rf_predictions = cuml_model.predict(X_test_gpu)

# Compute the probability that the transaction used a credit card, according to our model
rf_probabilities = cuml_model.predict_proba(X_test_gpu)[:, 1]

## Just as cuML provides utilities for data preprocessing and splitting, it also provides a
## wide set of GPU-accelerated metrics, like accuracy and AUC score. These are fast and
## ensure you don't need to fall back to CPU for any of your pipeline.
print("Accuracy: ", cuml.metrics.accuracy.accuracy_score(y_test_gpu, rf_predictions))
print("AUC: ", cuml.metrics.roc_auc_score(y_test_gpu, rf_probabilities))
代码部分学习要点总结:
- CUML提供了与流行的Scikit-Learn库相似的功能和API,用于机器学习;
- 结合HVPLOT等工具,CUML允许使用无监督的学习技术探索和查找大量数据的模式;
- cuml不仅提供了强大的,GPU的预测模型,还提供了用于数据预处理和指标的有用实用程序,可将数据保留在GPU上并加速机器学习管道的每个部分。
5.John Zedlewski的总结、拓展部分
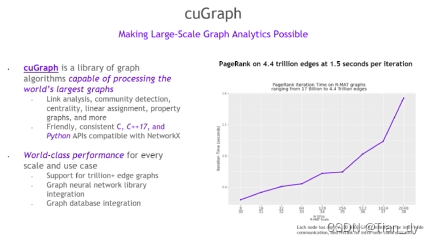
CuGraph使大尺度图分析成为可能:
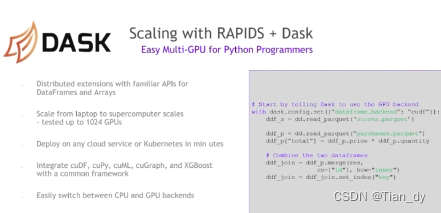
和DASK结合:
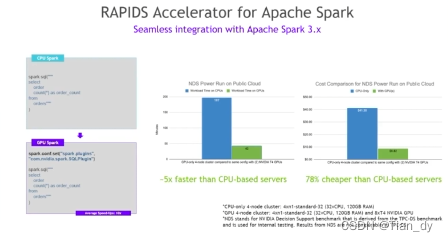
和Spark分布式框架结合:
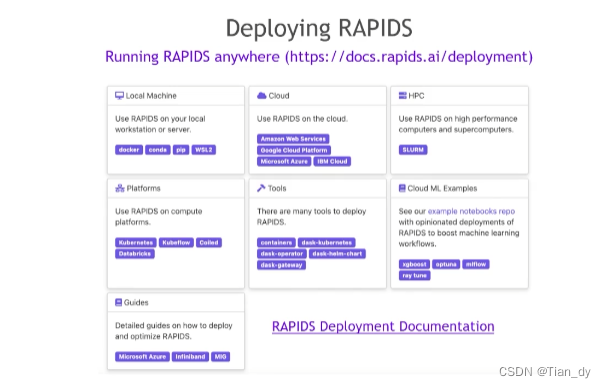
RAPIDS的学习途径很广泛,社区友好,推荐如下:
还有相关课程推荐:
6. 个人总结
- 模型部署一直都是很大的挑战,RAPIDS使数据科学的大模型部署更为轻量简单,以大幅提升效率;
- 基于Python生态,对Pandas、Sklearn等机器学习统计分析的库原生支持友好;
- RAPIDS结构是基于不同的库来实现数据科学从一端到另一端的加速;


 1782
1782


 被折叠的 条评论
为什么被折叠?
被折叠的 条评论
为什么被折叠?
 到【灌水乐园】发言


