


Prometheus(由go语言(golang)开发)是一开源的监控&报警&时间序列数据库的组合。 适合监控docker容器。因为kubernetes(俗称k8s)的流行带动了 prometheus的发展。
普罗米修斯特征
- 多维度数据模型
- 灵活的查询语言
- 不依赖分布式存储,单个服务器节点是自主的
- 以HTTP方式,通过pull模型拉去时间序列数据
- 也可以通过中间网关支持push模型
- 通过服务发现或者静态配置,来发现目标服务对象
- 支持多种多样的图表和界面展示
普罗米修斯原理架构图

Prometheus 直接或通过中介推送网关从检测的作业中抓取指标,用于短期作业。它将所有抓取的样本存储在本地,并对这些数据运行规则,以从现有数据聚合和记录新的时间序列或生成警报。Grafana或其他 API 使用者可用于可视化收集的数据。
环境部署
所有服务器同步骤
关闭防火墙 SElinux 修改/etc/hosts
[root@Prometheus ~]# vim /etc/hosts
[root@Prometheus ~]# cat /etc/hosts
192.168.10.19 Prometheus
192.168.10.243 client
设置时间同步
所有服务器安装ntpdate
[root@Prometheus ~]# yum install ntpdate -y
进行时间同步
[root@Prometheus ~]# ntpdate cn.ntp.org.cn
20 Aug 15:21:33 ntpdate[12200]: adjust time server 120.197.116.202 offset 0.001502 sec
[root@Prometheus ~]# date
2021年 08月 20日 星期五 15:21:45 CST
安装prometheus
点击进去可以选择安装包
解压安装包
[root@Prometheus ~]# tar zxvf prometheus-2.29.1.linux-amd64.tar.gz
[root@Prometheus ~]# ls
prometheus-2.29.1.linux-amd64.tar.gz prometheus-2.29.1.linux-amd64
移动并修改名字
[root@Prometheus ~]# mv prometheus-2.29.1.linux-amd64 /usr/local/promethues [root@Prometheus ~]# cd /usr/local/promethues/
[root@Prometheus promethues]# ls
console_libraries LICENSE prometheus promtool consoles NOTICE prometheus.yml
后台启动prometheus
[root@Prometheus promethues]# ./prometheus
--config.file="/usr/local/promethues/prometheus.yml" &
查看服务是否启动 端口9090
[root@Prometheus promethues]# netstat -napt | grep prometheus
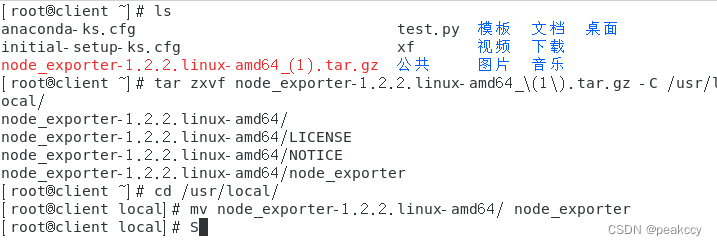
在本地安装上node-exporter插件,node-exporter用于采集服务器层面的运行指标 [root@Prometheus ~]# tar -zxvf node_exporter-1.2.2.linux-amd64\ \(1\).tar.gz -C /usr/local/ [root@Prometheus ~]# cd /usr/local/
[root@Prometheus local]# mv node_exporter-1.2.2.linux-amd64/ node_exporter
切换目录
[root@Prometheus local]# cd node_exporter/
[root@Prometheus node_exporter]# ls
LICENSE node_exporter NOTICE
永久在后台运行
[root@Prometheus node_exporter]# nohup /usr/local/node_exporter/node_exporter &
[2] 73670 nohup: 忽略输入并把输出追加到"nohup.out"
查看端口
[root@Prometheus node_exporter]# netstat -natp | grep :9100
在浏览器中进行访问测试

查看Status中的Targets项,可以看到默认监控的localhost与就是本机
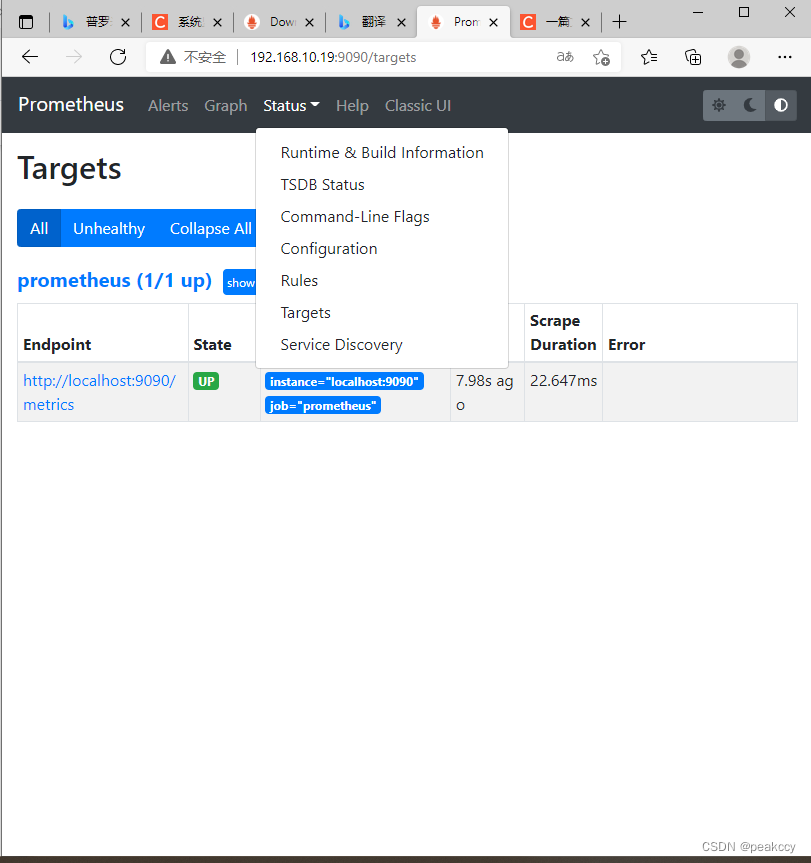
监控接口:192.168.10.19:9090/metrics可以查看监控的数据

普罗米修斯的 web 页面操作
查看cpu的运行状态(首页搜索栏中输入process_cpu_seconds_total)
点击 Graph 选项

监控远程 Linux 主机
在远程linux主机(被监控端)上安装 node_exporter 组件
点击链接进行下载 csdn - 安全中心
启动node_exporter程序
1.切换目录
2.永久运行并在后台运行

查看端口占用情况

扩展: nohup命令:如果把启动node_exporter的终端给关闭,那么进程也会随之关闭。nohup命令会帮你解决这个问题
使用http协议+9100端口收集Linux主机信息
通过浏览器访问:http://192.168.10.243:9100/metrics 就可以看到 node_exporter 在被监控端手机的监控信息

在 Prometheus 服务器的配置文件中添加被监控机器的配置段
[root@Prometheus promethues]# vim /usr/local/promethues/prometheus.yml
添加以下配置项 注:缩进问题注意
- job_name: "client"
static_configs:
- targets: ["192.168.10.243:9100"]
重新启动prometheus监控系统
杀掉进程
[root@Prometheus promethues]# pkill prometheus
确认端口
[root@Prometheus promethues]# lsof -i:9090
切换目录重新启动
[root@Prometheus promethues]# cd /usr/local/prometheus
[root@Prometheus promethues prometheus]# nohup ./prometheus --config.file="/usr/local/promethues/promethues.yml" &
重新回到普罗米修斯web端查看 Status 中的 Targets 项,可以看到被监控端 node_exporter 了,并且状态为 up。

Grafana可视化图形工具
什么是Grafana
Grafana是一个开源的度量分析和可视化工具,可以通过将采集的数据分析,查询,然后进行可视化的展示,并能实现报警。
Download Grafana | Grafana Labs 网站中选择安装包
rpm安装Grafana
[root@Prometheus ~]# rpm -ivh grafana-8.1.2-1.x86_64.rpm
启动Grafana
[root@Prometheus ~]# systemctl start grafana-server
设置为开机自启
[root@Prometheus ~]# systemctl enable grafana-server
查看端口状态
[root@Prometheus ~]# lsof -i:3000
切换目录
[root@Prometheus /]# cd /usr/local/promethues/
编写yml文件
[root@Prometheus promethues]# vim /usr/local/promethues/prometheus.yml
- job_name: "node"
static_configs:
- targets: ["localhost:9100"]
杀掉prometheus
[root@Prometheus promethues]# pkill prometheus
查看端口
[root@Prometheus promethues]# lsof -i:9090
启动yml文件
[root@Prometheus promethues]# ./prometheus --config.file=prometheus.yml &
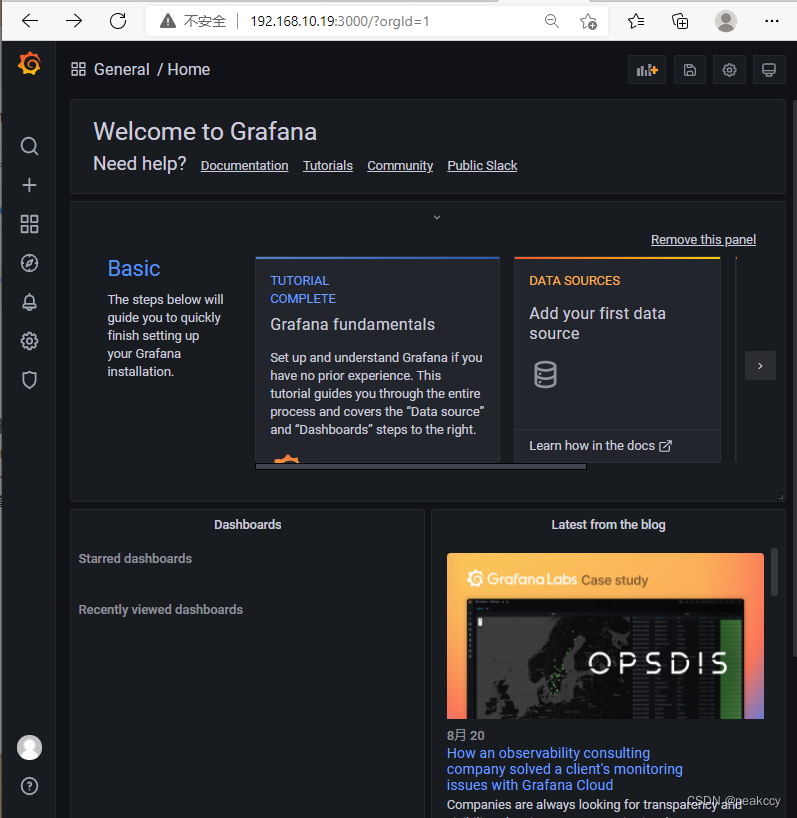
通过浏览器访问 192.168.10.19:3000 就到了Grafana的登陆页面,默认用户和密码都为admin

登录成功后会强制修改密码

点击DATA SOURCES(数据源)
选择Prometheus点击select

填写相关内容
名称 地址
部分其他选项解释
Auth:公网传输数据加密与验证用的,我们这边暂时不需要设置
Advanced HTTP settings项:15秒获取一次数据,GET方式
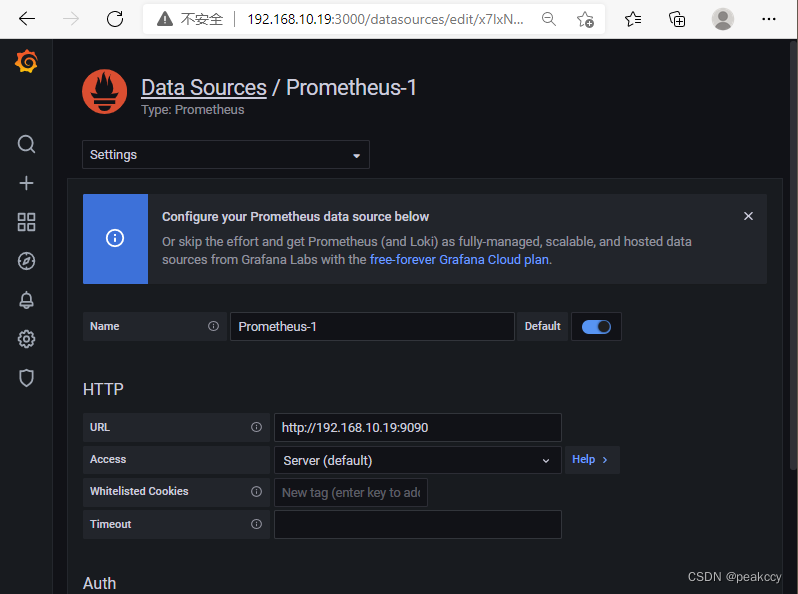
点击Save&test

点击齿轮 点击Data sources 可以看到我们的数据源

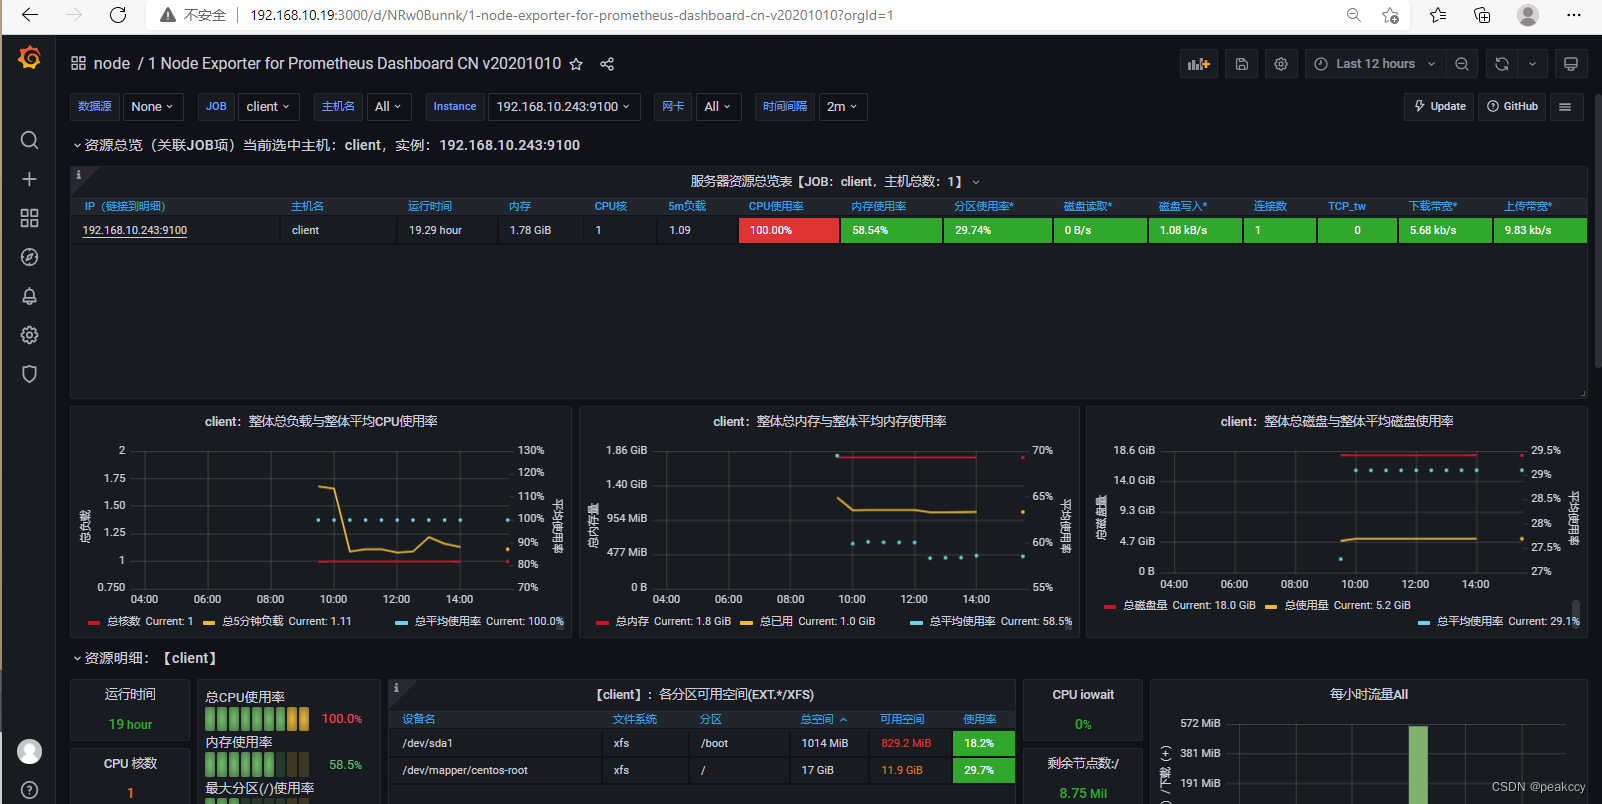
点击左边的+,定位到dashboards导入

选择prometheus

可以正常监控了


 5万+
5万+


 被折叠的 条评论
为什么被折叠?
被折叠的 条评论
为什么被折叠?
 到【灌水乐园】发言


